Highline Financial Services: MGT-530 Demand Forecasting Project

Verified

Added on  2021/10/27

|8
|1676
|356
Project
AI Summary
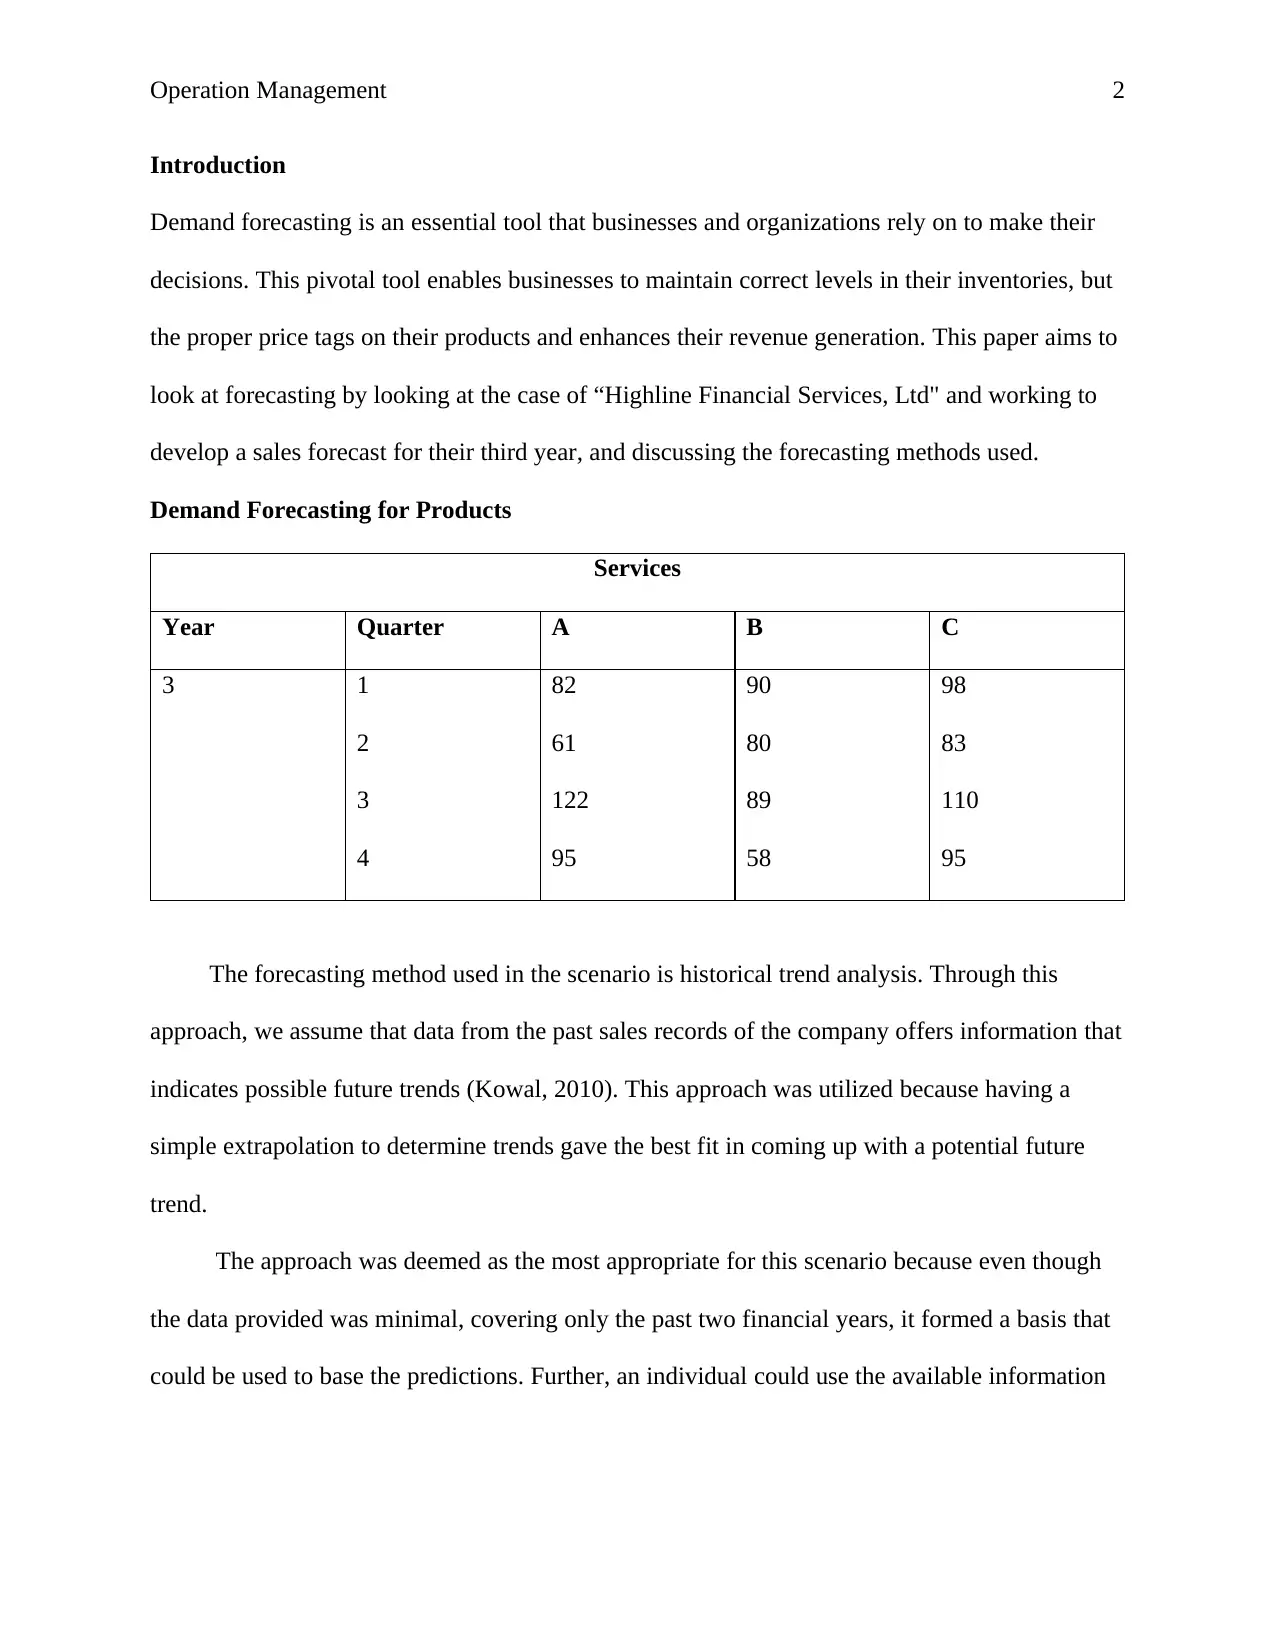
This project delves into demand forecasting using a case study of "Highline Financial Services, Ltd." The assignment focuses on developing a sales forecast for the company's third year, detailing the forecasting methods employed. The paper explores historical trend analysis and its suitability for the provided data, which includes sales figures for products A, B, and C over two years. The project justifies the choice of a linear trend method for product A, considering its consistent growth, while employing intuitive forecasting for products B and C due to their complex performance patterns. The benefits of a formalized forecasting approach are discussed, emphasizing its role in strategic planning, inventory management, and informed decision-making. The project highlights how the size of the forecast, data availability, and desired precision influence the choice of forecasting methods, offering a comprehensive analysis of demand forecasting techniques.
tabler-icon-diamond-filled.svg

Contribute Materials

Your contribution can guide someone’s learning journey. Share your documents today.
Document Page
Running head: Operation Management
MGT-530: Operation Management
Name
Institution
Course
Professor
Date
1
tabler-icon-diamond-filled.svg

Secure Best Marks with AI Grader

Need help grading? Try our AI Grader for instant feedback on your assignments.
Document Page
Operation Management
Introduction
Demand forecasting is an essential tool that businesses and organizations rely on to make their
decisions. This pivotal tool enables businesses to maintain correct levels in their inventories, but
the proper price tags on their products and enhances their revenue generation. This paper aims to
look at forecasting by looking at the case of “Highline Financial Services, Ltd" and working to
develop a sales forecast for their third year, and discussing the forecasting methods used.
Demand Forecasting for Products
Services
Year Quarter A B C
3 1
2
3
4
82
61
122
95
90
80
89
58
98
83
110
95
The forecasting method used in the scenario is historical trend analysis. Through this
approach, we assume that data from the past sales records of the company offers information that
indicates possible future trends (Kowal, 2010). This approach was utilized because having a
simple extrapolation to determine trends gave the best fit in coming up with a potential future
trend.
The approach was deemed as the most appropriate for this scenario because even though
the data provided was minimal, covering only the past two financial years, it formed a basis that
could be used to base the predictions. Further, an individual could use the available information
2
Document Page
Operation Management
and intuition to develop a reasonable demand estimate for the organization's product/services.
As Soyiri and Reidpath (2012) indicate, it requires information, data, and advanced knowledge.
Justification for the Forecasting Method
Different approaches were used to forecast the future demand of products A, B, and C. The
method used for product A differed from the approach used to determine the probable value for
products B and C for the four quarters.
For product A, a linear trend method was used to determine the next potential level of
demand. This is based on the fact that, unlike the other product, A registered continual growth
when the first year's sales level was compared with those of the second year throughout all the
four quarters. Although the level fluctuated between quarter one and quarter two, the rest
registered an average increase above ten units. Further, given that the rise in demand from the
other three quarters was not uniform, it was essential to get a uniform number by calculating the
average increase between all the quarters and using the number obtained to predict the future
demand level.
The formula used to calculate the average demand level for each of the four quarters in
year three was degerming the difference between quarter one in year one and quarter one in year
two. This was calculated for all the quarters and summed to obtain the average number. The
figure from the third year was thus obtained by adding the average increase to the sales demand
experienced in year two.
The linear approach used to forecast this product was utilized based on its ability to show a
straight and steady trend in an observed increase between the first two years. Further, this
approach was instrumental in attaining an upward trend that would help the firm predict the
demand for its products in the short term.
3
Document Page
Operation Management
Product B and C differed in their demand progression when compared to A. While A had
an upward trend in their demand, these two products indicated a complex performance pattern.
There were certain times when the products had an upward trend and other times that it
experienced a negative performance. For example, for product B, the first two quarters increased
the demand by ten units. However, when looking at the last two quarters, there was a drop in
demand by eight and 15 units between the first two years. The scenario is also replicated in
product C, which had a demand increase in the first quarter with nine units. However, there was
a decline in the second quarter with 15 units, and the third quarter had no change in the level of
demand while the fourth quarter had an increase of 10 units. It was not easy to determine the
trend that the product would follow going into the future by simply looking at the data. I relied
on intuitive forecasting to obtain a reliable future forecast, which provided extended capabilities
to generate demand forecasts. Therefore, to determine the third year forecast, I took the demand
forecast for year one, summed it up with the demand for year two, and used the average of the
two as the potential level of demand for year three. The formula for product b was as follows.
Year 3 quarter one demand = (years one quarter one demand +years two quarter one
demand)/2
The formula was replicated for the other quarters and for the product to develop an average
prediction of the product demand forecast.
Further, since the company has a limited historical database to lean on and make the
necessary forecast, it is risky to use an average demand increase/decrease to make the prediction.
As such, through intuition, I was able to determine that an average of the two years' demand
would offer a better projection. Mas Machuca, Sainz, and Martinez Costa (2014) assert that one
can predict future sales through an educated opinion.
4
tabler-icon-diamond-filled.svg

Secure Best Marks with AI Grader

Need help grading? Try our AI Grader for instant feedback on your assignments.
Document Page
Operation Management
The application of the intuitive approach is prompted by the fact that the data used to
project demonstrates a complex pattern. Further, it helps to improve the accuracy of the
forecasting as well as the planning process. The firm will therefore be able to eliminate the
potential challenge of stockouts in their operations. Harteis and Gruber (2008) support the need
to use intuition, indicating that it is part and parcel of professional experience and has the
potential of yielding better data, mainly when it relies on experience.
Benefits of using a Formalized Forecasting Approach
Organizations use forecasting methods as they seek to implement various production
strategies. Through forecasting, organizations use different strategies that enable them to
estimate and determine the possibility of their future business outcomes (Bass, 2018). Forecasts
are instrumental in helping organizations engage in inaccurate planning processes. A formalized
forecasting approach is one of the strategies that an organization can adopt when seeking to
identify the firm's future outlook. Unlike other forecasting methods, this approach is beneficial to
the organization since it provides a straightforward approach to use on the computer while also
quantifying the provided information.
The approach is less formalized, making it possible for the individual undertaking the
forecasting to lean on their intuition. Therefore, when an individual is seeking to undertake a
forecast for a tiny endeavor, personal intuition can attract some bias as part of the forecast.
However, as the forecast requires grows into a significant problem, an individual or organization
can't rely on this less formalized approach. This is based on the intuition used in the small
problem that cannot be relied upon to process large quantities.
Other potential benefits of utilizing a formalized approach when forecasting include
offering a wide decision range, helping to reduce a factor of uncertainty, and control over stock
5
Document Page
Operation Management
levels as a result of better inventory management. Therefore, the company will ensure that their
stock levels in the market are in line with the potential demand and, therefore, there are no
excesses or shortages. Their decision-making will also be based on well-constructed data that
will inform their actions and the strategies adopted. Further, the output provided from such an
exercise provides the organization with the necessary input for many decisions.
In conclusion, different approaches can be used in the process of product forecasts. The
size of the forecast required, the data available, and the precision required determine the
approach adopted. However, when undertaking simple forecast approaches such as formalized
approach, which adopt intuition can be adopted.
6
Document Page
Operation Management
References
Bass, B. (2018). Advantages and Disadvantages of Forecasting Methods of Production and
Operations Management. Retrieved from https://smallbusiness.chron.com/advantages-
disadvantages-forecasting-methods-production-operations-management-19309.html
Harteis, C., Gruber, H. (2008) Intuition and Professional Competence: Intuitive Versus Rational
Forecasting of the Stock Market. Vocations and Learning 1, 71–85 (2008).
https://doi.org/10.1007/s12186-007-9000-z
Kowal, J. T (2010). Three Simple Methods for new Product sales Forecasting. Retrieved from
https://www.google.com/url?
sa=t&rct=j&q=&esrc=s&source=web&cd=&cad=rja&uact=8&ved=2ahUKEwjSua-
9xpXsAhV58eAKHdlrCKQQFjARegQIDRAC&url=https%3A%2F
%2Fglobalnpsolutions.com%2Fwp-content%2Fuploads
%2F2010%2F11%2Fwhite_paper_13_New_Product_Sales-
Forecasting.pdf&usg=AOvVaw1duol4EQf8mPxiXnw8nfwx
Mas Machuca, M.; Sainz, M.; Martinez Costa, C.. (2014). A review of forecasting models for
new products Intangible Capital, vol. 10, núm. 1, Enero-Marzo, 2014, pp. 1-25Universitat
Politècnica de Catalunya Barcelona, España Retrieved from https://www.google.com/url?
sa=t&rct=j&q=&esrc=s&source=web&cd=&cad=rja&uact=8&ved=2ahUKEwiV8sLz-
ZXsAhWNERQKHfDGBasQFjAFegQIAxAC&url=https%3A%2F%2Fwww.redalyc.org
%2Fpdf%2F549%2F54930453001.pdf&usg=AOvVaw2LI5uMqOyBlOZoRcwZPot6
7
tabler-icon-diamond-filled.svg

Paraphrase This Document

Need a fresh take? Get an instant paraphrase of this document with our AI Paraphraser
Document Page
Operation Management
Soyiri, I. N., & Reidpath, D. D. (2012). Evolving forecasting classifications and applications in
health forecasting. International journal of general medicine, 5, 381–389.
https://doi.org/10.2147/IJGM.S31079
8
chevron_up_icon
1 out of 8
circle_padding
hide_on_mobile
zoom_out_icon
logo.png

Your All-in-One AI-Powered Toolkit for Academic Success.

Available 24*7 on WhatsApp / Email

[object Object]