Financial Analysis of Hilton Hotels Ltd: Opportunities and Problems
VerifiedAdded on 2021/02/19
|14
|4616
|101
Report
AI Summary
This report provides a comprehensive financial analysis of Hilton Hotels Ltd. It begins with an introduction to accounting and finance, followed by an overview of Hilton Hotels, including its corporate objectives, opportunities, and major problems faced over the past three years. The report then delves into financial statement analysis, utilizing ratio analysis to assess the company's liquidity, profitability, turnover, and gearing ratios from 2016 to 2018. Furthermore, the report compares Hilton's performance with its competitor, Intercontinental Hotels, using common size statements to highlight key financial metrics. The analysis includes interpretations of the ratios and a discussion on the company's overall financial health, concluding with recommendations on potential new ventures and overall performance evaluation. The report emphasizes the importance of maintaining current assets and focusing on key ratios like the P/E ratio to attract investors. The analysis is a valuable resource for understanding the financial performance and strategic positioning of Hilton Hotels within the hospitality industry.

Accounting and Finance
Paraphrase This Document
Need a fresh take? Get an instant paraphrase of this document with our AI Paraphraser
Table of Contents
INTRODUCTION................................................................................................................................3
Corporate objectives of Hilton Hotels Ltd and what are the opportunities and major problems ........3
Financial Statement Analysis of Hilton Hotels Ltd..............................................................................4
Comparison of performance of Hilton Hotels with the competitors of the company using
common size statement....................................................................................................................6
Advising whether company should go for new venture or not......................................................12
CONCLUSION .................................................................................................................................12
REFERENCES...................................................................................................................................13
INTRODUCTION
Accounting and Finance can be defined as the two inter-related or inter-depended items in
the preparation of financial statements. Accounting can be defined as the process of identifying,
analysing, summarizing, recording the items of financial transaction in the books of accounts.
Finance can be defined as the funding the company either through retained earnings investing back
in company or borrowing required finance from banks or various financial institutions (Atrill,
2019). Hilton Hotels Ltd is the who is engaged in Hospitality industry. It s a multinational American
company established in year 1919 by Conrad Hilton. At present company is present in 5757
locations worldwide and there are approximately 169000 employees employed by the company.
According to year 2018 company is having US $ 764 million of net income of the company. This
report covers the various opportunities and problems faced by the company and its competitors in
past 3 years. It also covers the evaluation of financial statements of the company by using ratio
analysis techniques and comparing common size statement with the competitors' common size
statement.
Corporate objectives of Hilton Hotels Ltd and what are the opportunities and
major problems
The main objectives of Hilton Hotels in past 3 years are as follows-
Company is evaluating the the current and future practices and policies of the company in
order to not only attract guests but also drive value for the company (Melissen, F., 2016);
Company has revised its both internal and external practices by designing and constructing
back brand value in 2009; Company is also engaged in setting up sustainability targets for the company by reducing
consumption of various resources such as energy consumption, Co 2 emission, water
consumption etc. (Singal, 2017).
Opportunities and major problems faced by Hilton Ltd in past 3 years
The various opportunities faced by Hilton Ltd are more number of women are entering into
hospitality sector because of which is big opportunity for the labour sector. The another opportunity
in the hospitality sector is the demand for the quality in sector is increasing. People are becoming
more concern about the climate and health which adds more value to the hospitality sector.
Increasing the Globalisation means more number of increase in travellers and tourists which is next
opportunity for the company (Patton, and et.al., 2016).
Various Problems faced by Hilton Hotels are lack of skilled professional employees
decreases the quality of services offered by the employees. Due to increase in the terrorist attacks
and political unrest there is decrease in the travellers from one country to another. Big Black market
⊘ This is a preview!⊘
Do you want full access?
Subscribe today to unlock all pages.
Trusted by 1+ million students worldwide
is the another major problem of the industry because it will also hampering the recruitment of
skilled employees for the company. Due to high changes in climate decreased the travellers from
long distance which have affected the hospitality industry.
The future challenges which can be faced by Hospitality industry are due to drastic changes
in the climate which may hamper the tourists who come from long distance. Due to the increase in
the competition bargaining power of the customers is increasing which may reduce the cost of per
room for Hilton Hotel Ltd (Sheresheva, 2016).
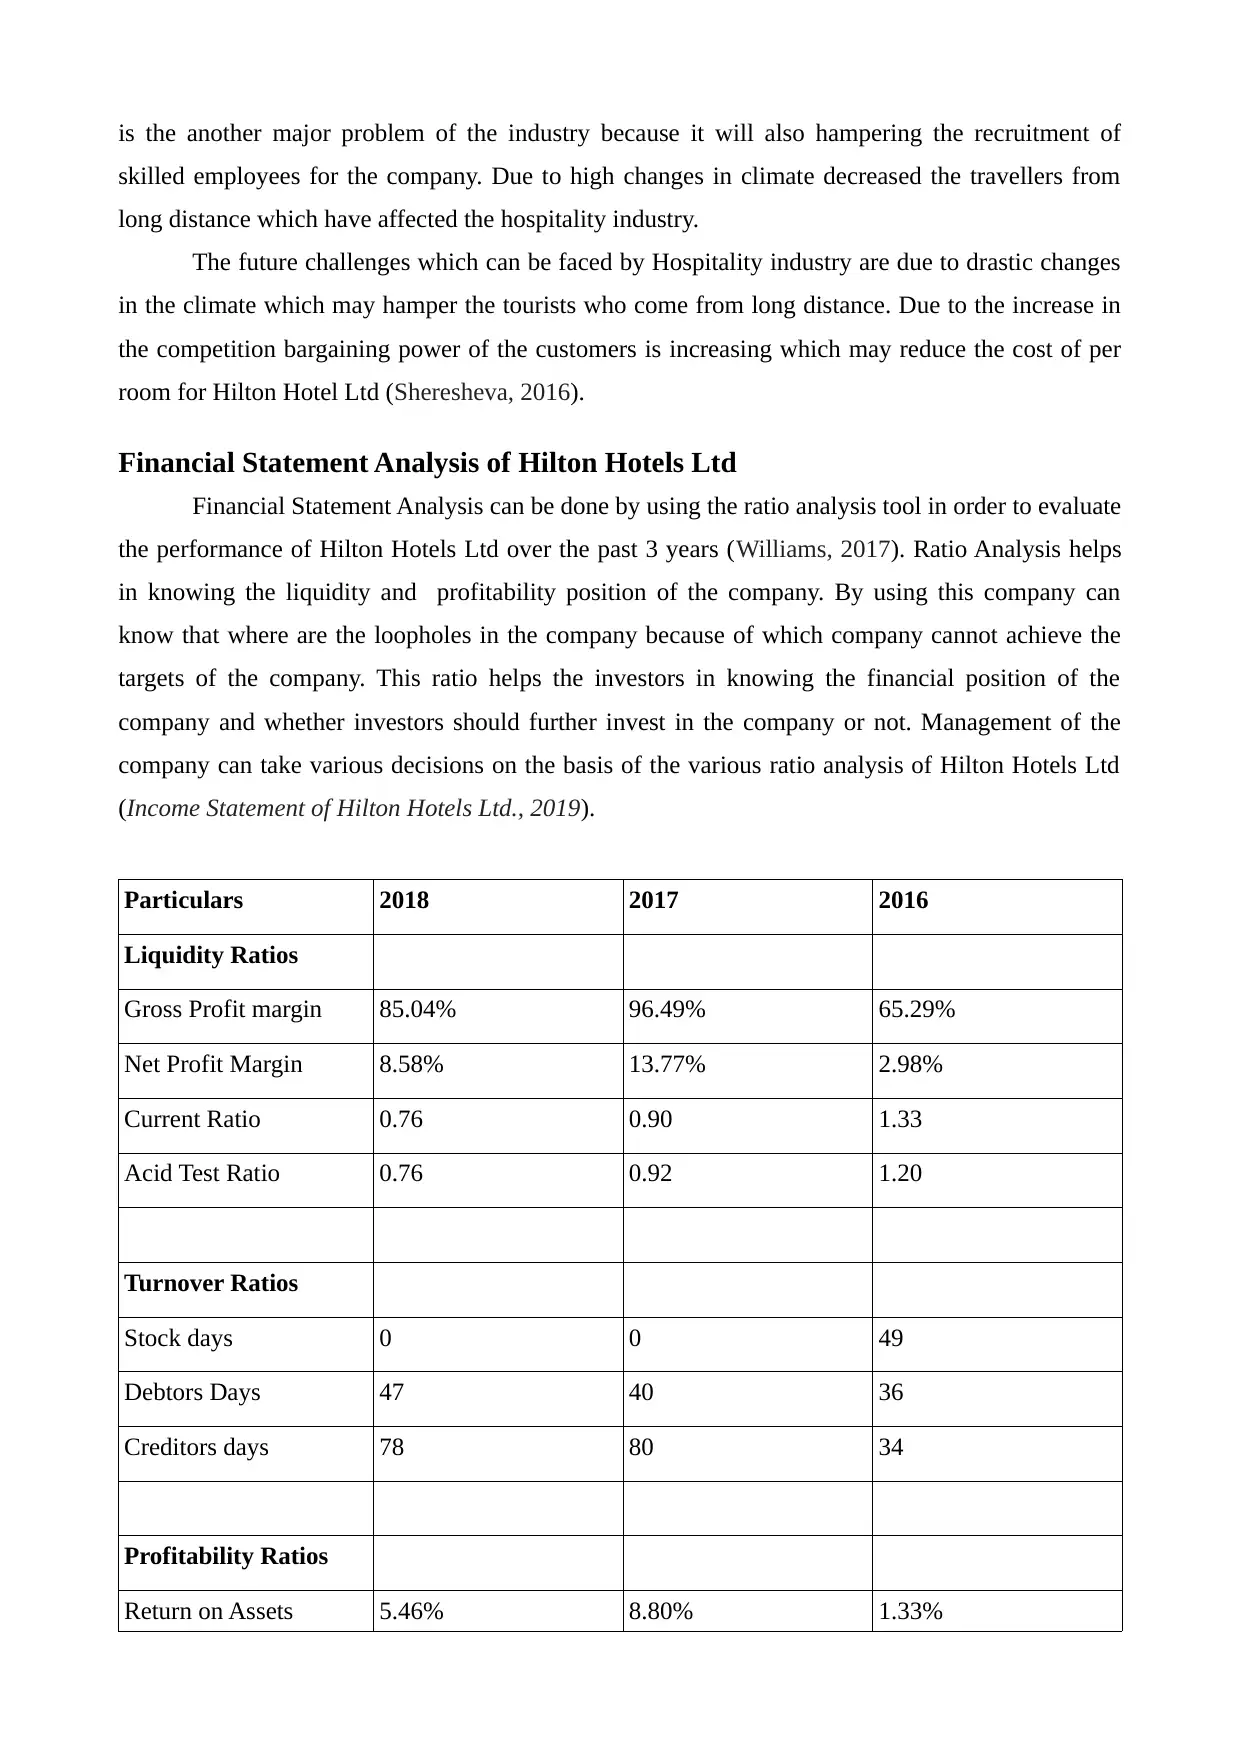
Financial Statement Analysis of Hilton Hotels Ltd
Financial Statement Analysis can be done by using the ratio analysis tool in order to evaluate
the performance of Hilton Hotels Ltd over the past 3 years (Williams, 2017). Ratio Analysis helps
in knowing the liquidity and profitability position of the company. By using this company can
know that where are the loopholes in the company because of which company cannot achieve the
targets of the company. This ratio helps the investors in knowing the financial position of the
company and whether investors should further invest in the company or not. Management of the
company can take various decisions on the basis of the various ratio analysis of Hilton Hotels Ltd
(Income Statement of Hilton Hotels Ltd., 2019).
Particulars 2018 2017 2016
Liquidity Ratios
Gross Profit margin 85.04% 96.49% 65.29%
Net Profit Margin 8.58% 13.77% 2.98%
Current Ratio 0.76 0.90 1.33
Acid Test Ratio 0.76 0.92 1.20
Turnover Ratios
Stock days 0 0 49
Debtors Days 47 40 36
Creditors days 78 80 34
Profitability Ratios
Return on Assets 5.46% 8.80% 1.33%
skilled employees for the company. Due to high changes in climate decreased the travellers from
long distance which have affected the hospitality industry.
The future challenges which can be faced by Hospitality industry are due to drastic changes
in the climate which may hamper the tourists who come from long distance. Due to the increase in
the competition bargaining power of the customers is increasing which may reduce the cost of per
room for Hilton Hotel Ltd (Sheresheva, 2016).
Financial Statement Analysis of Hilton Hotels Ltd
Financial Statement Analysis can be done by using the ratio analysis tool in order to evaluate
the performance of Hilton Hotels Ltd over the past 3 years (Williams, 2017). Ratio Analysis helps
in knowing the liquidity and profitability position of the company. By using this company can
know that where are the loopholes in the company because of which company cannot achieve the
targets of the company. This ratio helps the investors in knowing the financial position of the
company and whether investors should further invest in the company or not. Management of the
company can take various decisions on the basis of the various ratio analysis of Hilton Hotels Ltd
(Income Statement of Hilton Hotels Ltd., 2019).
Particulars 2018 2017 2016
Liquidity Ratios
Gross Profit margin 85.04% 96.49% 65.29%
Net Profit Margin 8.58% 13.77% 2.98%
Current Ratio 0.76 0.90 1.33
Acid Test Ratio 0.76 0.92 1.20
Turnover Ratios
Stock days 0 0 49
Debtors Days 47 40 36
Creditors days 78 80 34
Profitability Ratios
Return on Assets 5.46% 8.80% 1.33%
Paraphrase This Document
Need a fresh take? Get an instant paraphrase of this document with our AI Paraphraser
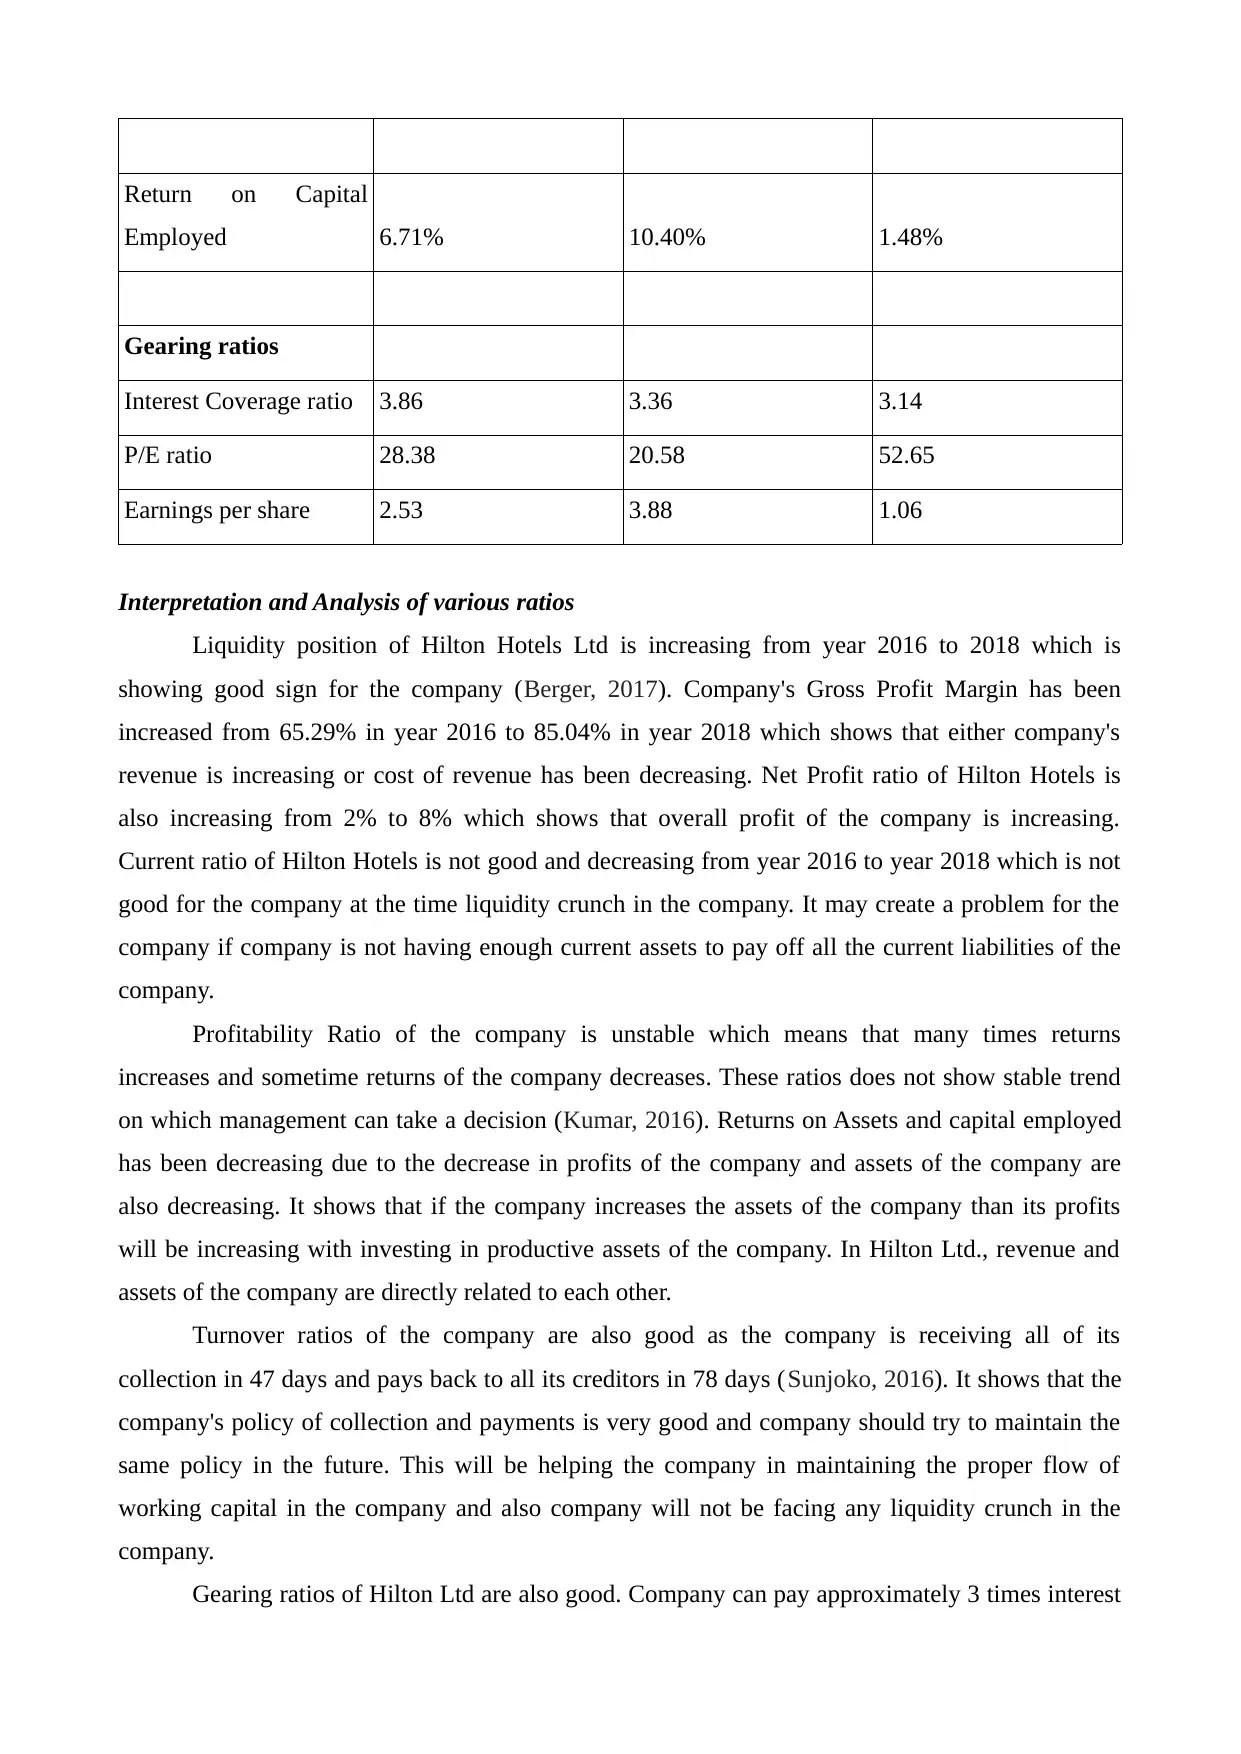
Return on Capital
Employed 6.71% 10.40% 1.48%
Gearing ratios
Interest Coverage ratio 3.86 3.36 3.14
P/E ratio 28.38 20.58 52.65
Earnings per share 2.53 3.88 1.06
Interpretation and Analysis of various ratios
Liquidity position of Hilton Hotels Ltd is increasing from year 2016 to 2018 which is
showing good sign for the company (Berger, 2017). Company's Gross Profit Margin has been
increased from 65.29% in year 2016 to 85.04% in year 2018 which shows that either company's
revenue is increasing or cost of revenue has been decreasing. Net Profit ratio of Hilton Hotels is
also increasing from 2% to 8% which shows that overall profit of the company is increasing.
Current ratio of Hilton Hotels is not good and decreasing from year 2016 to year 2018 which is not
good for the company at the time liquidity crunch in the company. It may create a problem for the
company if company is not having enough current assets to pay off all the current liabilities of the
company.
Profitability Ratio of the company is unstable which means that many times returns
increases and sometime returns of the company decreases. These ratios does not show stable trend
on which management can take a decision (Kumar, 2016). Returns on Assets and capital employed
has been decreasing due to the decrease in profits of the company and assets of the company are
also decreasing. It shows that if the company increases the assets of the company than its profits
will be increasing with investing in productive assets of the company. In Hilton Ltd., revenue and
assets of the company are directly related to each other.
Turnover ratios of the company are also good as the company is receiving all of its
collection in 47 days and pays back to all its creditors in 78 days (Sunjoko, 2016). It shows that the
company's policy of collection and payments is very good and company should try to maintain the
same policy in the future. This will be helping the company in maintaining the proper flow of
working capital in the company and also company will not be facing any liquidity crunch in the
company.
Gearing ratios of Hilton Ltd are also good. Company can pay approximately 3 times interest
charges of the company from the available profits before interest and taxes are paid. It shows that
the company is having profits to pay all its financial charges (Muthee, 2016). P/E ratio of the
company has been decreased from 52.65 times to 28.38 times which shows that the yield of
company on EPS has been decreasing. It is because of increase in market price share of the
company and EPS of the company remains almost constant. Company should improve its market
price share because this ratio is specially analysed by investors to know whether they should invest
in the company or not.
Overall the performance of the company is good and company should focus on maintaining
the current assets in the company. Proper availability of current assets will be helping the company
in pay off all its current liabilities at the time of liquidity crunch in the company. Hilton Ltd should
try to maintain the same collection and payables policy in the company. Company should increase
its more investment in assets so as to increase the revenue of the company. Company should focus
on P/E ratio because this ratio affects the decision of the investors. Thus, overall performance of
Hilton Hotels Ltd is good and company should try to maintain the same performance of the
company.
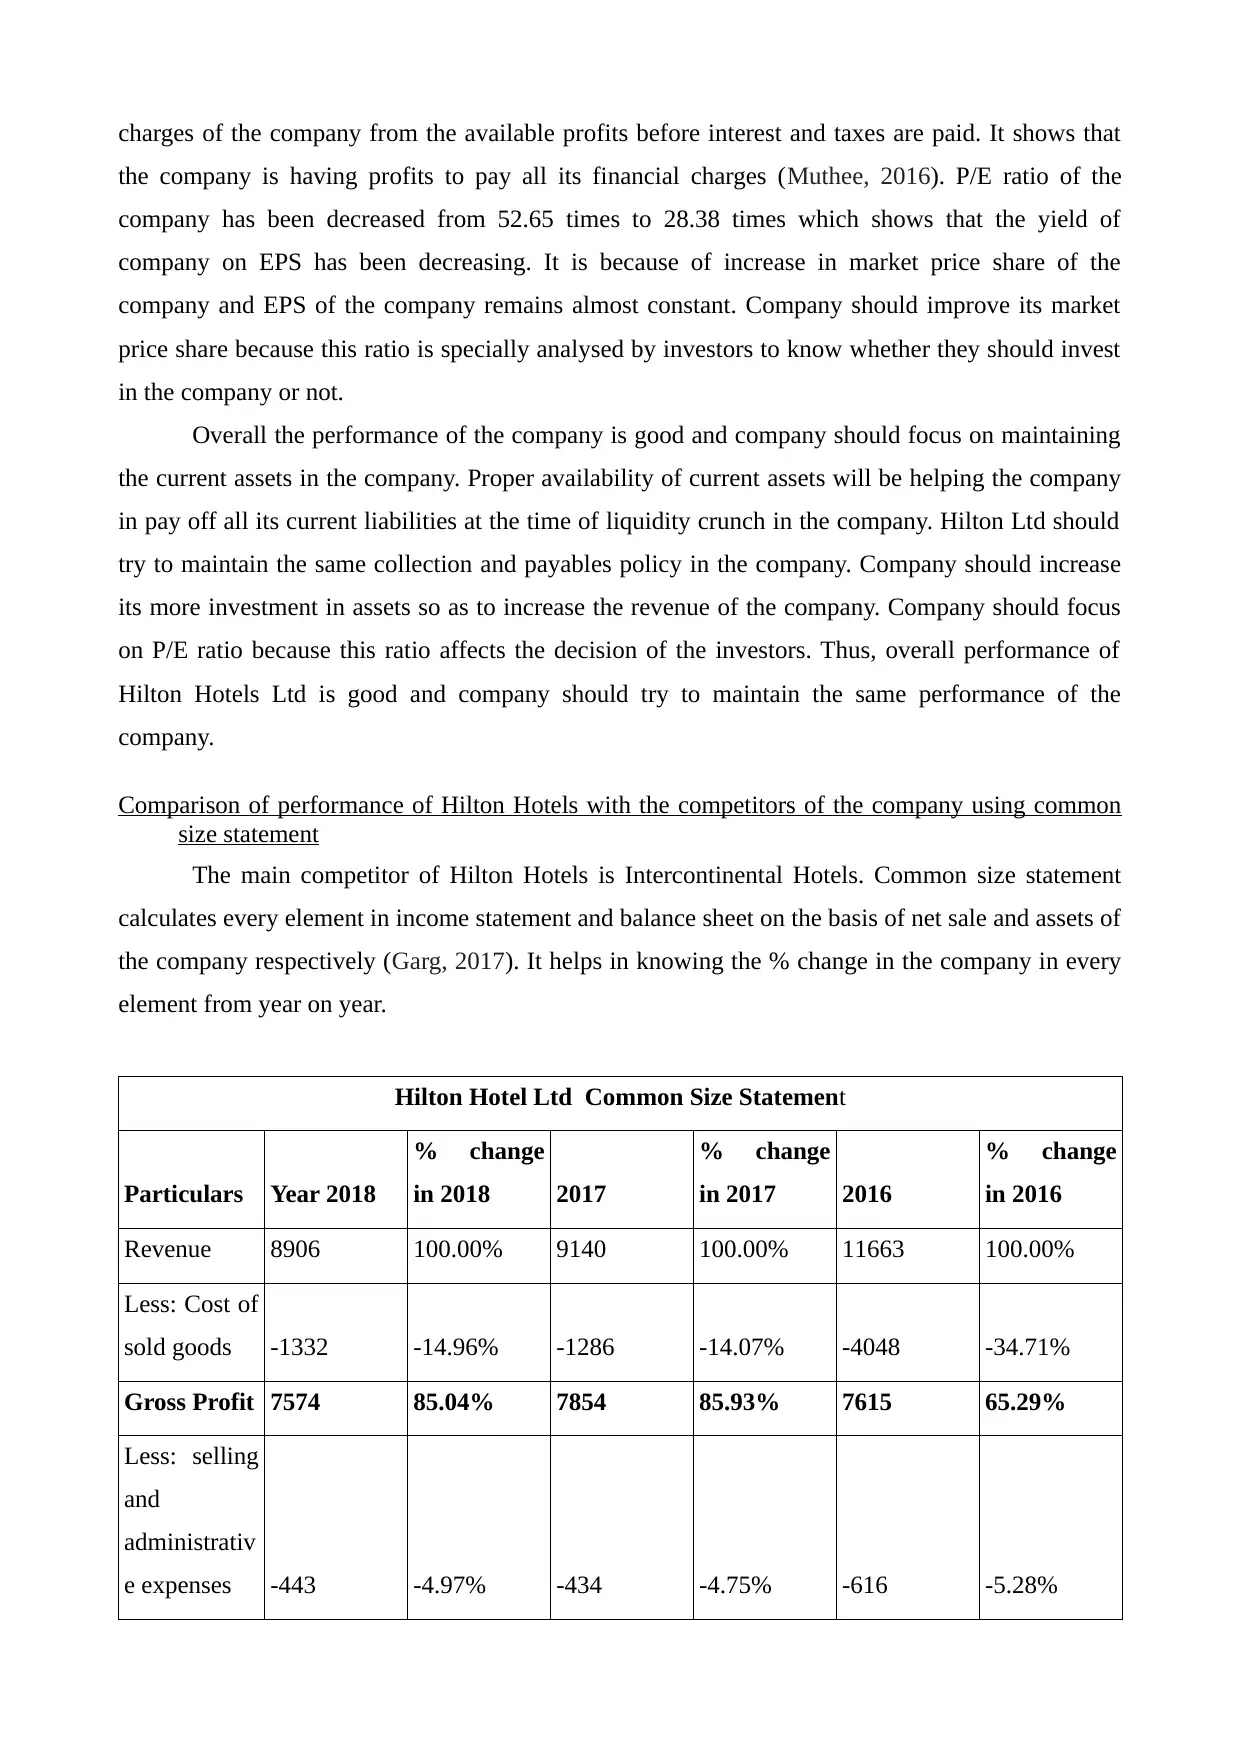
Comparison of performance of Hilton Hotels with the competitors of the company using common
size statement
The main competitor of Hilton Hotels is Intercontinental Hotels. Common size statement
calculates every element in income statement and balance sheet on the basis of net sale and assets of
the company respectively (Garg, 2017). It helps in knowing the % change in the company in every
element from year on year.
Hilton Hotel Ltd Common Size Statement
Particulars Year 2018
% change
in 2018 2017
% change
in 2017 2016
% change
in 2016
Revenue 8906 100.00% 9140 100.00% 11663 100.00%
Less: Cost of
sold goods -1332 -14.96% -1286 -14.07% -4048 -34.71%
Gross Profit 7574 85.04% 7854 85.93% 7615 65.29%
Less: selling
and
administrativ
e expenses -443 -4.97% -434 -4.75% -616 -5.28%
the company is having profits to pay all its financial charges (Muthee, 2016). P/E ratio of the
company has been decreased from 52.65 times to 28.38 times which shows that the yield of
company on EPS has been decreasing. It is because of increase in market price share of the
company and EPS of the company remains almost constant. Company should improve its market
price share because this ratio is specially analysed by investors to know whether they should invest
in the company or not.
Overall the performance of the company is good and company should focus on maintaining
the current assets in the company. Proper availability of current assets will be helping the company
in pay off all its current liabilities at the time of liquidity crunch in the company. Hilton Ltd should
try to maintain the same collection and payables policy in the company. Company should increase
its more investment in assets so as to increase the revenue of the company. Company should focus
on P/E ratio because this ratio affects the decision of the investors. Thus, overall performance of
Hilton Hotels Ltd is good and company should try to maintain the same performance of the
company.
Comparison of performance of Hilton Hotels with the competitors of the company using common
size statement
The main competitor of Hilton Hotels is Intercontinental Hotels. Common size statement
calculates every element in income statement and balance sheet on the basis of net sale and assets of
the company respectively (Garg, 2017). It helps in knowing the % change in the company in every
element from year on year.
Hilton Hotel Ltd Common Size Statement
Particulars Year 2018
% change
in 2018 2017
% change
in 2017 2016
% change
in 2016
Revenue 8906 100.00% 9140 100.00% 11663 100.00%
Less: Cost of
sold goods -1332 -14.96% -1286 -14.07% -4048 -34.71%
Gross Profit 7574 85.04% 7854 85.93% 7615 65.29%
Less: selling
and
administrativ
e expenses -443 -4.97% -434 -4.75% -616 -5.28%
⊘ This is a preview!⊘
Do you want full access?
Subscribe today to unlock all pages.
Trusted by 1+ million students worldwide
Less: other
operating
expenses -5699 -63.99% -6048 -66.17% -5158 -44.23%
Operating
Income 1432 16.08% 1372 15.01% 1841 15.78%
Less:Interest
Expense -371 -4.17% -408 -4.46% -587 -5.03%
Other
Income/
(expense) 17 0.19% -34 -0.37% -1 -0.01%
Income
before taxes 1078 12.10% 930 10.18% 1255 10.76%
Less: Taxes -314 -3.53% 329 3.60% -907 -7.78%
Income
after Taxes 764 8.58% 1259 13.77% 348 2.98%
Intercontinental Hotel Ltd Common Size Statement
Particulars Year 2018
% change
in 2018 2017
% change
in 2017 2016
% change
in 2016
Revenue 4337 100.00% 4075 100.00% 3912 100.00%
Less: Cost of
sold goods -3666 -84.53% -3354 -82.31% -3169 -81.01%
Gross Profit 691 15.93% 846 20.76% 824 21.06%
Less: selling
and
administrativ
e expenses -20 -0.46% -125 -3.07% -81 -2.07%
Less: other
operating
expenses 0 0.00% 0 0.00% 0 0.00%
operating
expenses -5699 -63.99% -6048 -66.17% -5158 -44.23%
Operating
Income 1432 16.08% 1372 15.01% 1841 15.78%
Less:Interest
Expense -371 -4.17% -408 -4.46% -587 -5.03%
Other
Income/
(expense) 17 0.19% -34 -0.37% -1 -0.01%
Income
before taxes 1078 12.10% 930 10.18% 1255 10.76%
Less: Taxes -314 -3.53% 329 3.60% -907 -7.78%
Income
after Taxes 764 8.58% 1259 13.77% 348 2.98%
Intercontinental Hotel Ltd Common Size Statement
Particulars Year 2018
% change
in 2018 2017
% change
in 2017 2016
% change
in 2016
Revenue 4337 100.00% 4075 100.00% 3912 100.00%
Less: Cost of
sold goods -3666 -84.53% -3354 -82.31% -3169 -81.01%
Gross Profit 691 15.93% 846 20.76% 824 21.06%
Less: selling
and
administrativ
e expenses -20 -0.46% -125 -3.07% -81 -2.07%
Less: other
operating
expenses 0 0.00% 0 0.00% 0 0.00%
Paraphrase This Document
Need a fresh take? Get an instant paraphrase of this document with our AI Paraphraser
Operating
Income 671 15.47% 721 17.69% 743 18.99%
Less:Interest
Expense -76 -1.75% -72 -1.77% -80 -2.04%
Other
Income/
(expense) -110 -2.54% 12 0.29% -31 -0.79%
Income
before taxes 485 11.18% 656 16.10% 632 16.16%
Less: Taxes -133 -3.07% -115 -2.82% -173 -4.42%
Income
after Taxes 352 8.12% 541 13.28% 459 11.73%
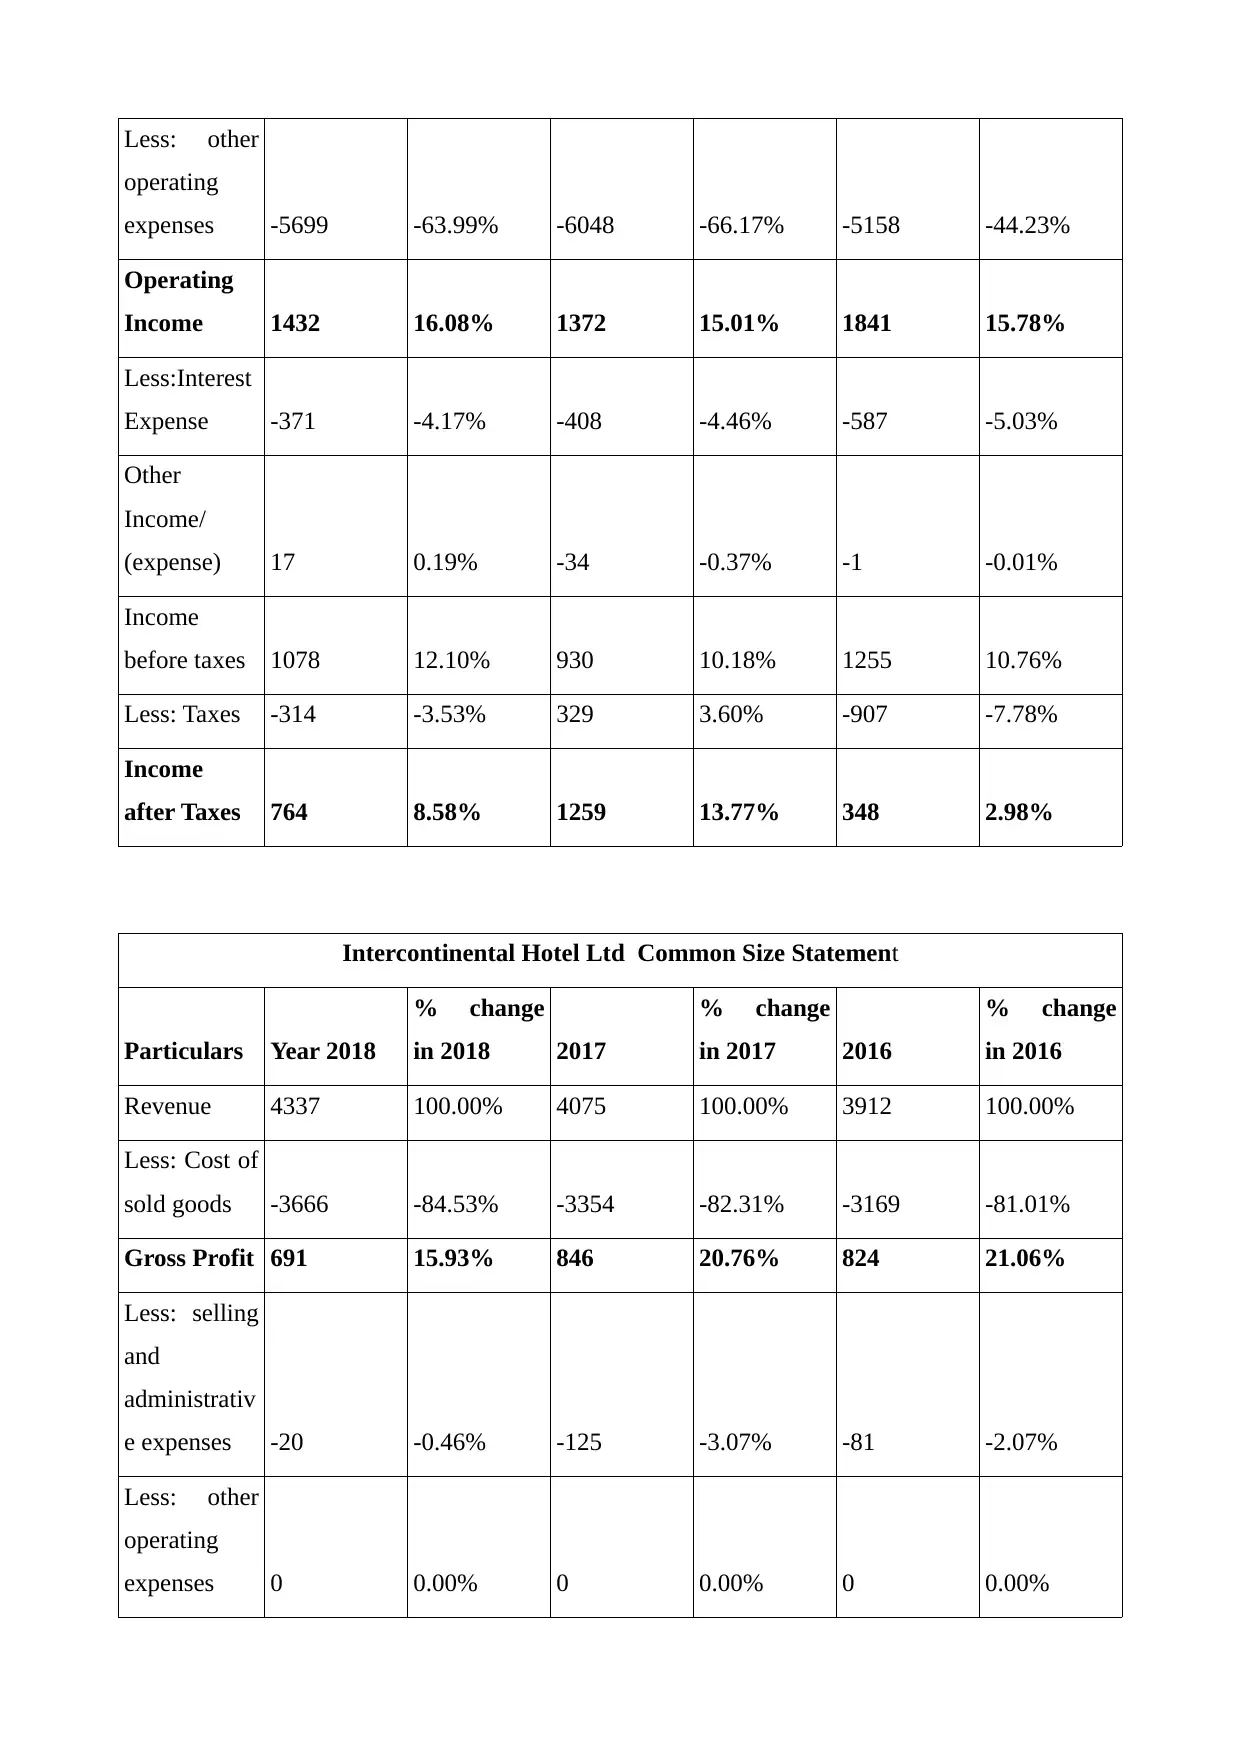
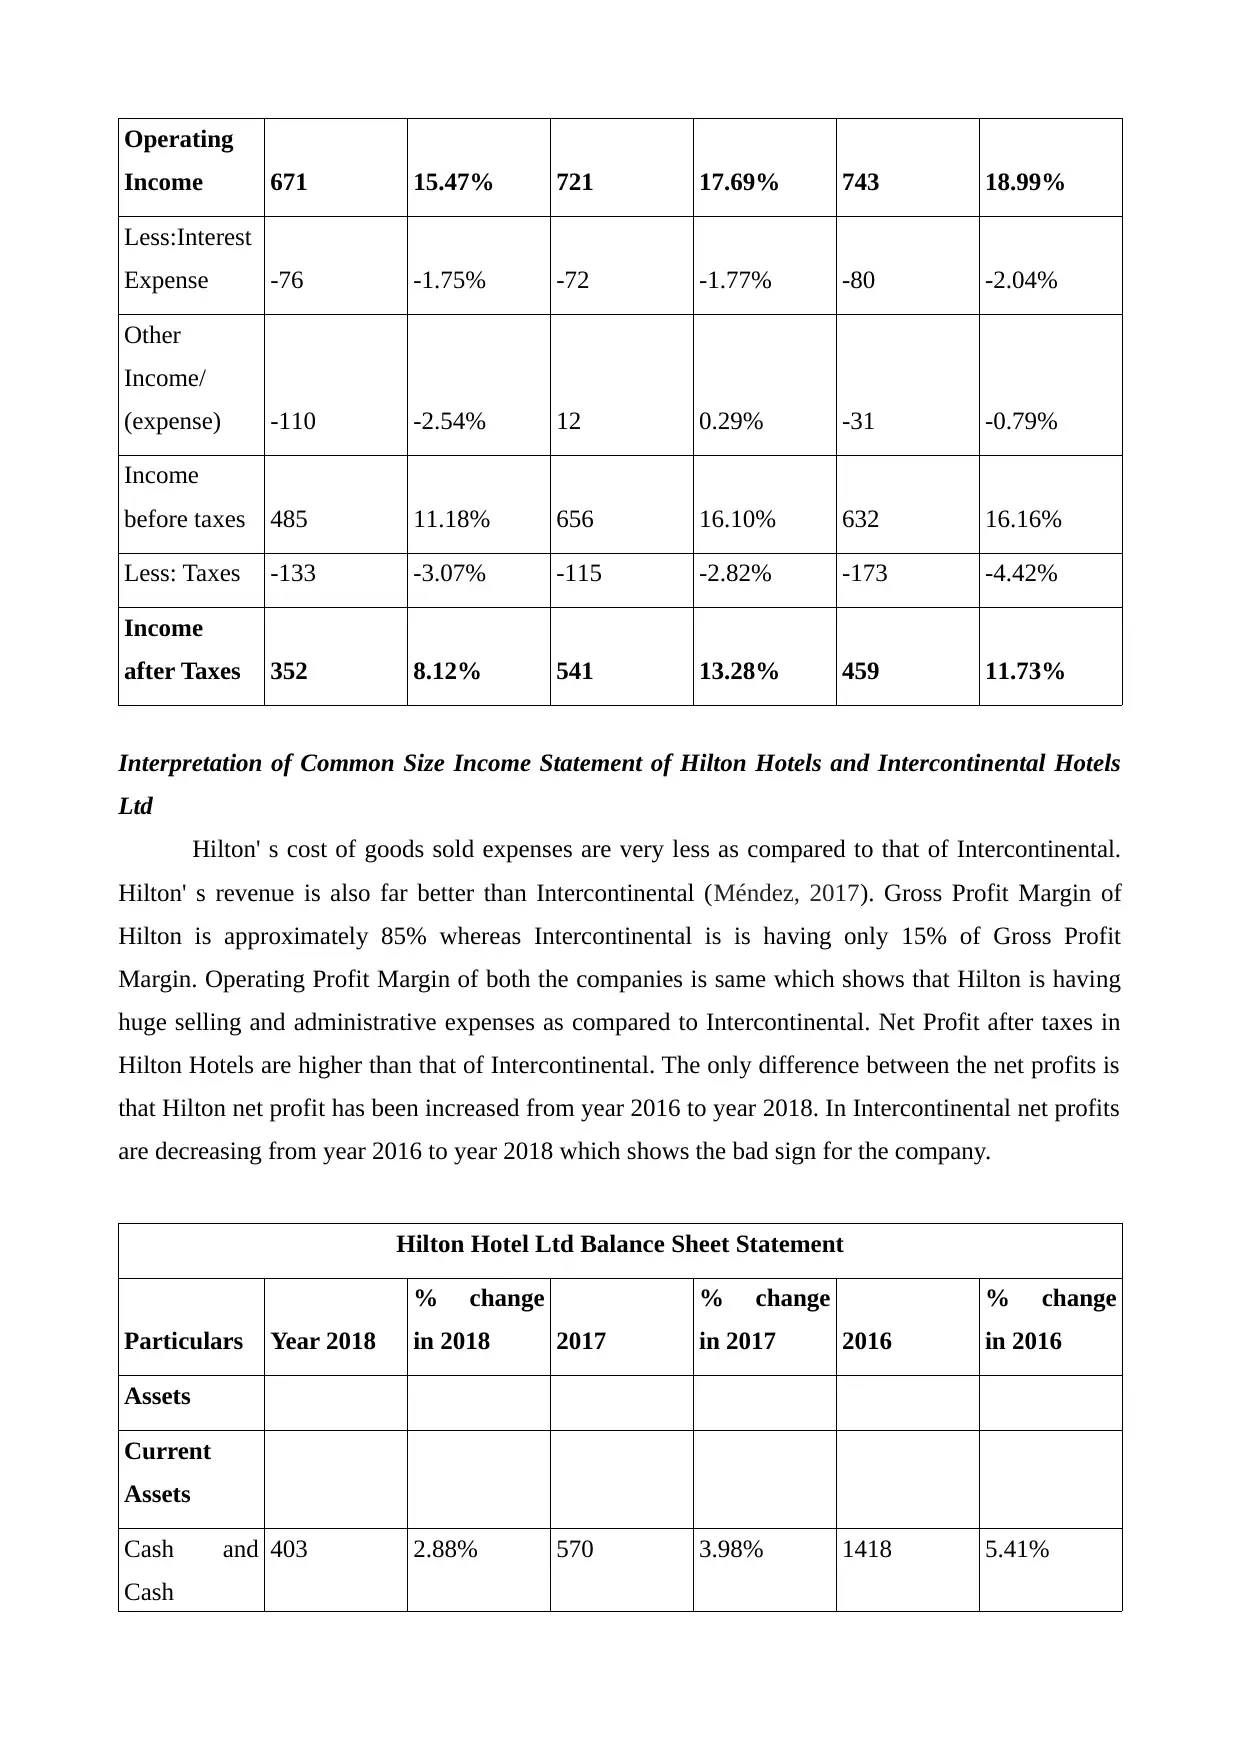
Interpretation of Common Size Income Statement of Hilton Hotels and Intercontinental Hotels
Ltd
Hilton' s cost of goods sold expenses are very less as compared to that of Intercontinental.
Hilton' s revenue is also far better than Intercontinental (Méndez, 2017). Gross Profit Margin of
Hilton is approximately 85% whereas Intercontinental is is having only 15% of Gross Profit
Margin. Operating Profit Margin of both the companies is same which shows that Hilton is having
huge selling and administrative expenses as compared to Intercontinental. Net Profit after taxes in
Hilton Hotels are higher than that of Intercontinental. The only difference between the net profits is
that Hilton net profit has been increased from year 2016 to year 2018. In Intercontinental net profits
are decreasing from year 2016 to year 2018 which shows the bad sign for the company.
Hilton Hotel Ltd Balance Sheet Statement
Particulars Year 2018
% change
in 2018 2017
% change
in 2017 2016
% change
in 2016
Assets
Current
Assets
Cash and
Cash
403 2.88% 570 3.98% 1418 5.41%
Income 671 15.47% 721 17.69% 743 18.99%
Less:Interest
Expense -76 -1.75% -72 -1.77% -80 -2.04%
Other
Income/
(expense) -110 -2.54% 12 0.29% -31 -0.79%
Income
before taxes 485 11.18% 656 16.10% 632 16.16%
Less: Taxes -133 -3.07% -115 -2.82% -173 -4.42%
Income
after Taxes 352 8.12% 541 13.28% 459 11.73%
Interpretation of Common Size Income Statement of Hilton Hotels and Intercontinental Hotels
Ltd
Hilton' s cost of goods sold expenses are very less as compared to that of Intercontinental.
Hilton' s revenue is also far better than Intercontinental (Méndez, 2017). Gross Profit Margin of
Hilton is approximately 85% whereas Intercontinental is is having only 15% of Gross Profit
Margin. Operating Profit Margin of both the companies is same which shows that Hilton is having
huge selling and administrative expenses as compared to Intercontinental. Net Profit after taxes in
Hilton Hotels are higher than that of Intercontinental. The only difference between the net profits is
that Hilton net profit has been increased from year 2016 to year 2018. In Intercontinental net profits
are decreasing from year 2016 to year 2018 which shows the bad sign for the company.
Hilton Hotel Ltd Balance Sheet Statement
Particulars Year 2018
% change
in 2018 2017
% change
in 2017 2016
% change
in 2016
Assets
Current
Assets
Cash and
Cash
403 2.88% 570 3.98% 1418 5.41%
Equivalents
Prepaid
Expenses 160 1.14% 111 0.78% 137 0.52%
Accounts
Receivable 1150 8.22% 998 6.98% 1143 4.36%
Inventory 0 0.00% 0 0.00% 541 2.06%
Other
Current
Assets 270 1.93% 307 2.15% 318 1.21%
Total
current
assets 1983 14.17% 1986 13.88% 3557 13.57%
Non
Current
Assets 0.00%
Tangible
Assets 367 2.62% 353 2.47% 8930 34.07%
Intangible
Assets 11316 80.86% 11422 79.83% 12310 46.97%
Deferred
income taxes 90 0.64% 113 0.79% 117 0.45%
Other Long
term assets 239 1.71% 434 3.03% 1297 4.95%
Total Non
Current
assets 12012 85.83% 12322 86.12% 22654 86.43%
Total Assets 13995 100.00% 14308 100.00% 26211 100.00%
Liabilities
and
Equity's
⊘ This is a preview!⊘
Do you want full access?
Subscribe today to unlock all pages.
Trusted by 1+ million students worldwide
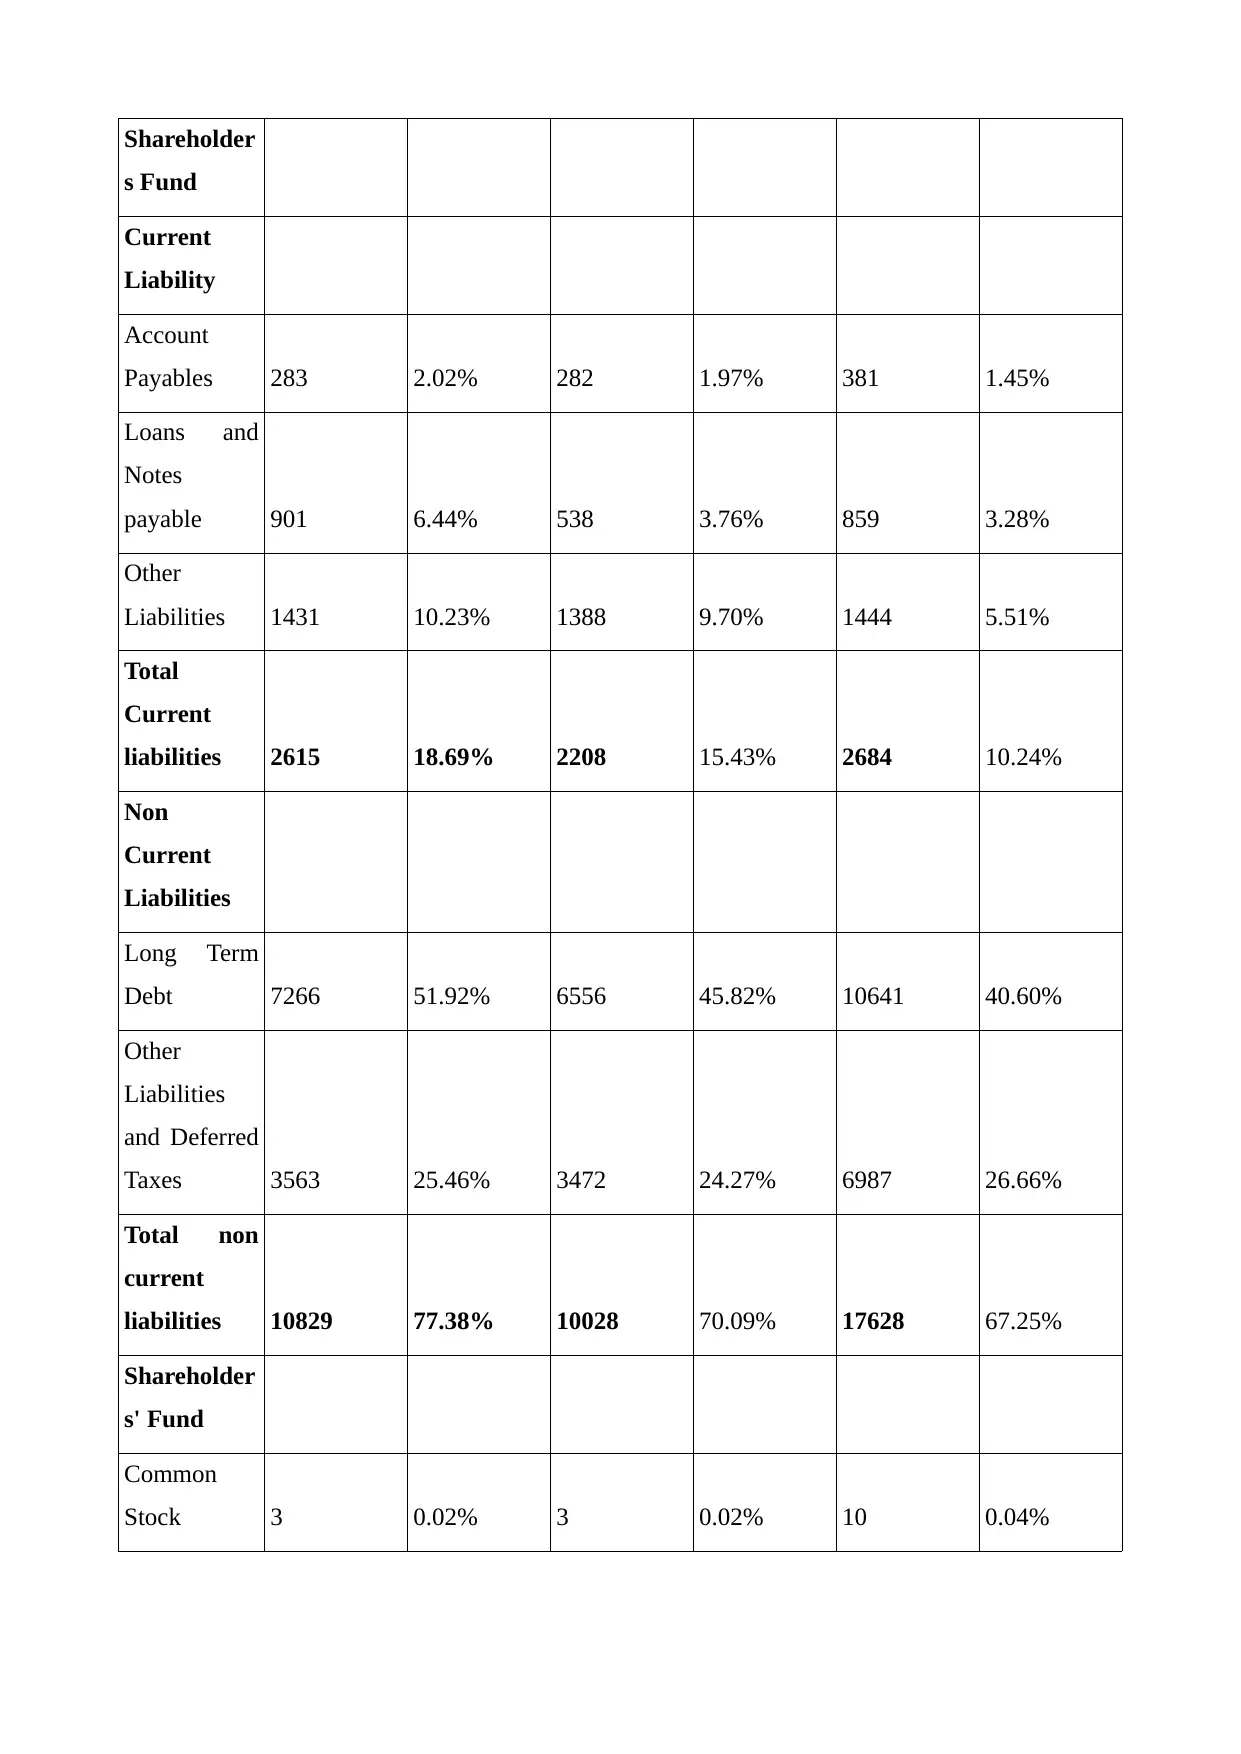
Shareholder
s Fund
Current
Liability
Account
Payables 283 2.02% 282 1.97% 381 1.45%
Loans and
Notes
payable 901 6.44% 538 3.76% 859 3.28%
Other
Liabilities 1431 10.23% 1388 9.70% 1444 5.51%
Total
Current
liabilities 2615 18.69% 2208 15.43% 2684 10.24%
Non
Current
Liabilities
Long Term
Debt 7266 51.92% 6556 45.82% 10641 40.60%
Other
Liabilities
and Deferred
Taxes 3563 25.46% 3472 24.27% 6987 26.66%
Total non
current
liabilities 10829 77.38% 10028 70.09% 17628 67.25%
Shareholder
s' Fund
Common
Stock 3 0.02% 3 0.02% 10 0.04%
Paraphrase This Document
Need a fresh take? Get an instant paraphrase of this document with our AI Paraphraser

Retained
Earnings -6417 -45.85% -6596 -46.10% -3323 -12.68%
Accumulated
Other
Income 6965 49.77% 8665 60.56% 9212 35.15%
Total
shareholder
s fund 551 3.94% 2072 14.48% 5899 22.51%
Total
Liabilities
and
Shareholder
s Fund 13995 100.00% 14308 100.00% 26211 100.00%
Intercontinental Hotel Ltd Balance Sheet Statement
Particulars Year 2018
% change
in 2018 2017
% change
in 2017 2016
% change
in 2016
Assets
Current
Assets
Cash and
Cash
Equivalents 705 19.53% 184 6.51% 226 8.44%
Accounts
Receivable 522 14.46% 494 17.47% 482 18.01%
Inventory 5 0.14% 3 0.11% 3 0.11%
Total
current
assets 1232 34.14% 681 24.08% 711 26.56%
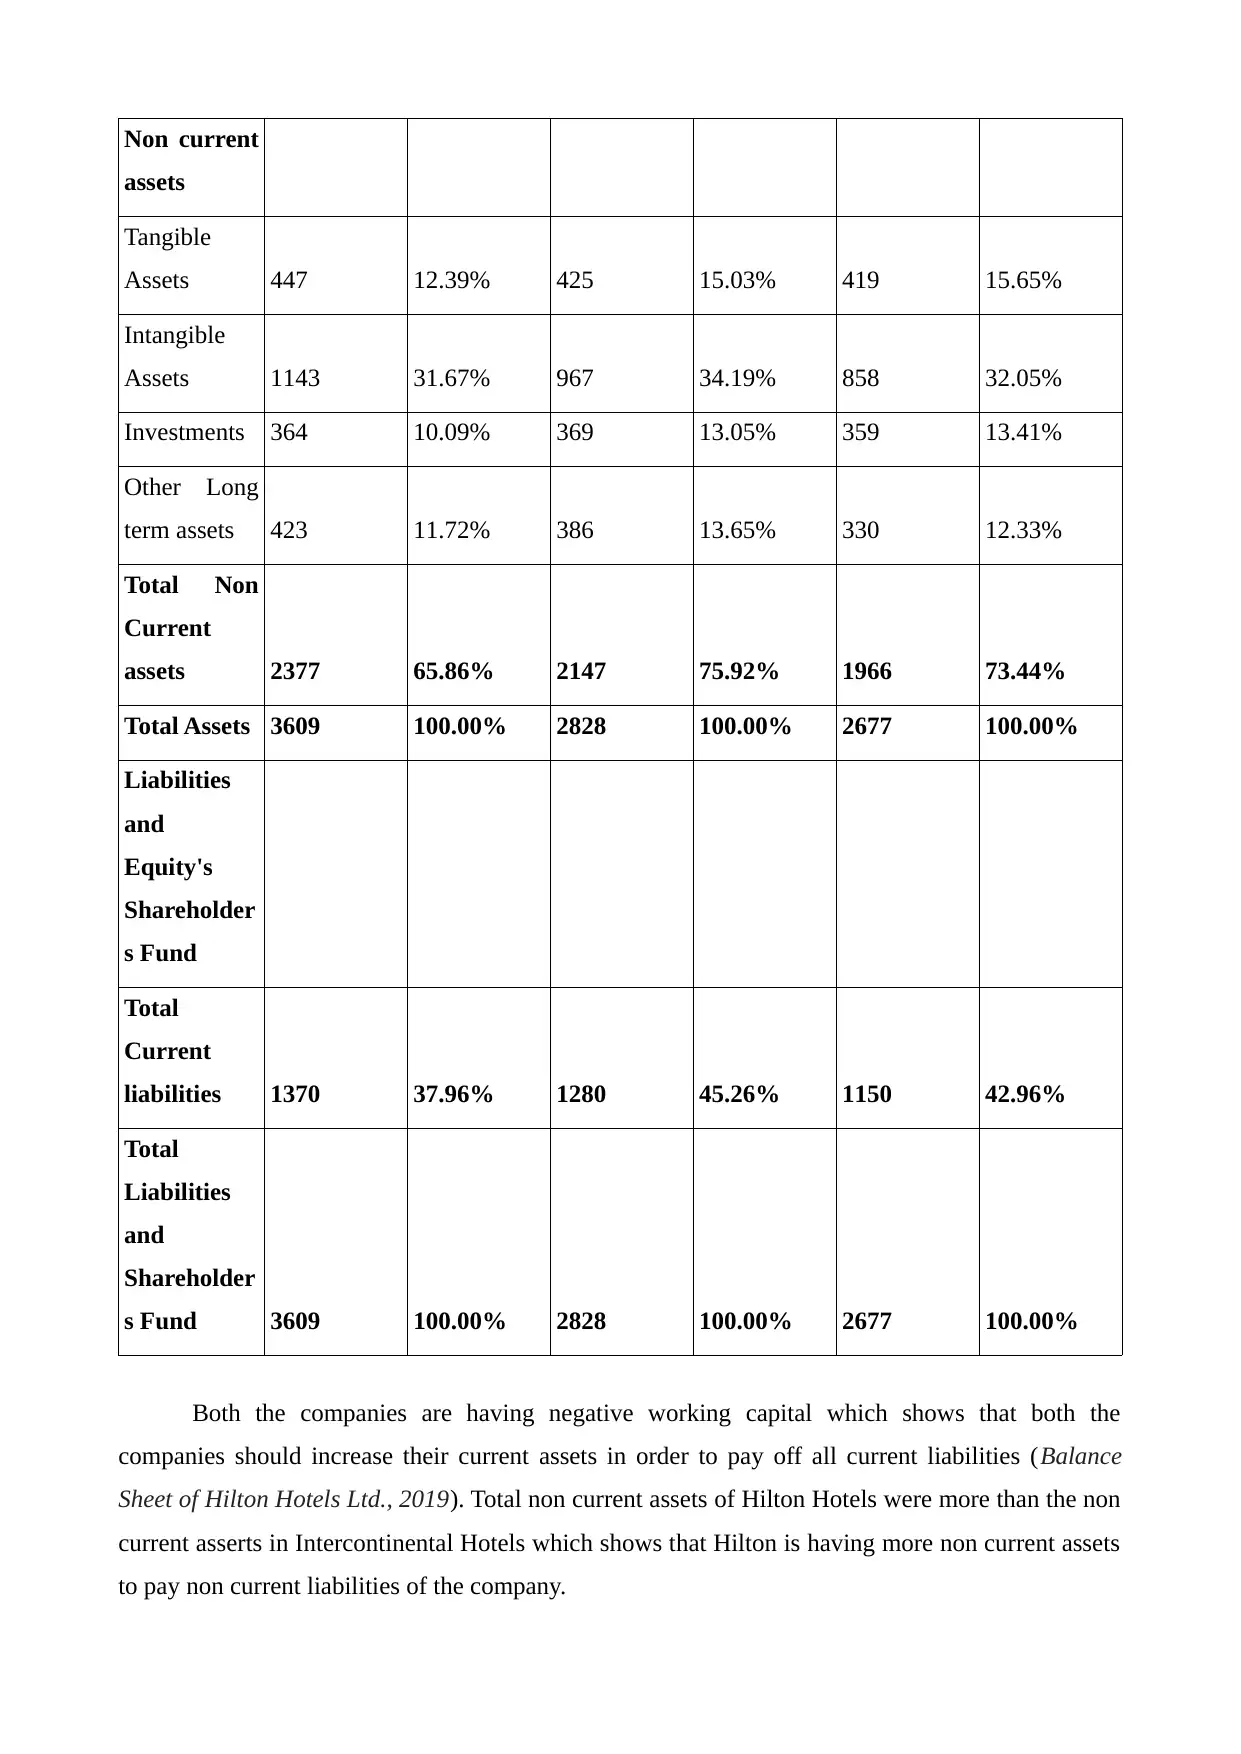
Non current
assets
Tangible
Assets 447 12.39% 425 15.03% 419 15.65%
Intangible
Assets 1143 31.67% 967 34.19% 858 32.05%
Investments 364 10.09% 369 13.05% 359 13.41%
Other Long
term assets 423 11.72% 386 13.65% 330 12.33%
Total Non
Current
assets 2377 65.86% 2147 75.92% 1966 73.44%
Total Assets 3609 100.00% 2828 100.00% 2677 100.00%
Liabilities
and
Equity's
Shareholder
s Fund
Total
Current
liabilities 1370 37.96% 1280 45.26% 1150 42.96%
Total
Liabilities
and
Shareholder
s Fund 3609 100.00% 2828 100.00% 2677 100.00%
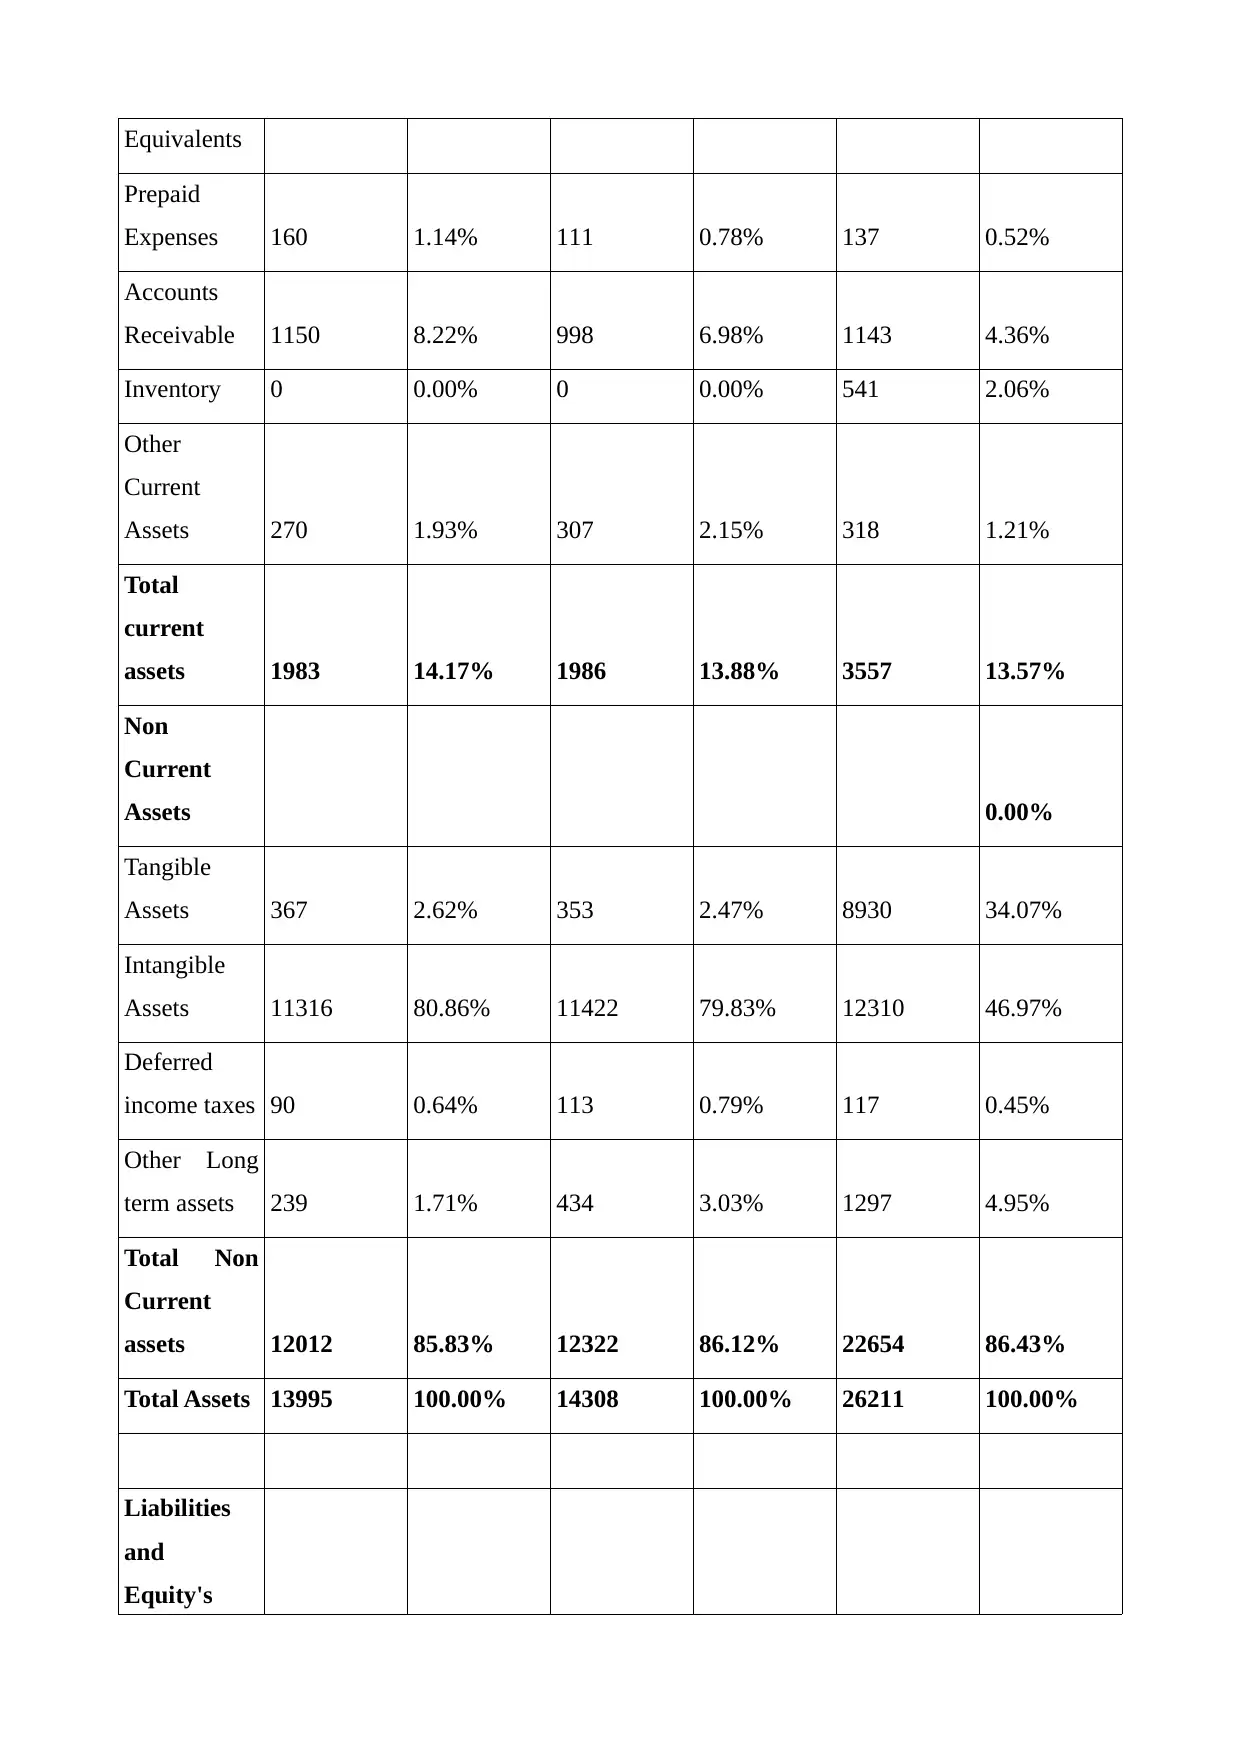
Both the companies are having negative working capital which shows that both the
companies should increase their current assets in order to pay off all current liabilities (Balance
Sheet of Hilton Hotels Ltd., 2019). Total non current assets of Hilton Hotels were more than the non
current asserts in Intercontinental Hotels which shows that Hilton is having more non current assets
to pay non current liabilities of the company.
assets
Tangible
Assets 447 12.39% 425 15.03% 419 15.65%
Intangible
Assets 1143 31.67% 967 34.19% 858 32.05%
Investments 364 10.09% 369 13.05% 359 13.41%
Other Long
term assets 423 11.72% 386 13.65% 330 12.33%
Total Non
Current
assets 2377 65.86% 2147 75.92% 1966 73.44%
Total Assets 3609 100.00% 2828 100.00% 2677 100.00%
Liabilities
and
Equity's
Shareholder
s Fund
Total
Current
liabilities 1370 37.96% 1280 45.26% 1150 42.96%
Total
Liabilities
and
Shareholder
s Fund 3609 100.00% 2828 100.00% 2677 100.00%
Both the companies are having negative working capital which shows that both the
companies should increase their current assets in order to pay off all current liabilities (Balance
Sheet of Hilton Hotels Ltd., 2019). Total non current assets of Hilton Hotels were more than the non
current asserts in Intercontinental Hotels which shows that Hilton is having more non current assets
to pay non current liabilities of the company.
⊘ This is a preview!⊘
Do you want full access?
Subscribe today to unlock all pages.
Trusted by 1+ million students worldwide
1 out of 14
Related Documents


Your All-in-One AI-Powered Toolkit for Academic Success.
+13062052269
info@desklib.com
Available 24*7 on WhatsApp / Email
![[object Object]](/_next/static/media/star-bottom.7253800d.svg)
Unlock your academic potential
Copyright © 2020–2026 A2Z Services. All Rights Reserved. Developed and managed by ZUCOL.