Renewable Energy: Analysis of Historic vs Current Energy Projections
VerifiedAdded on 2023/04/24
|19
|3094
|411
Report
AI Summary
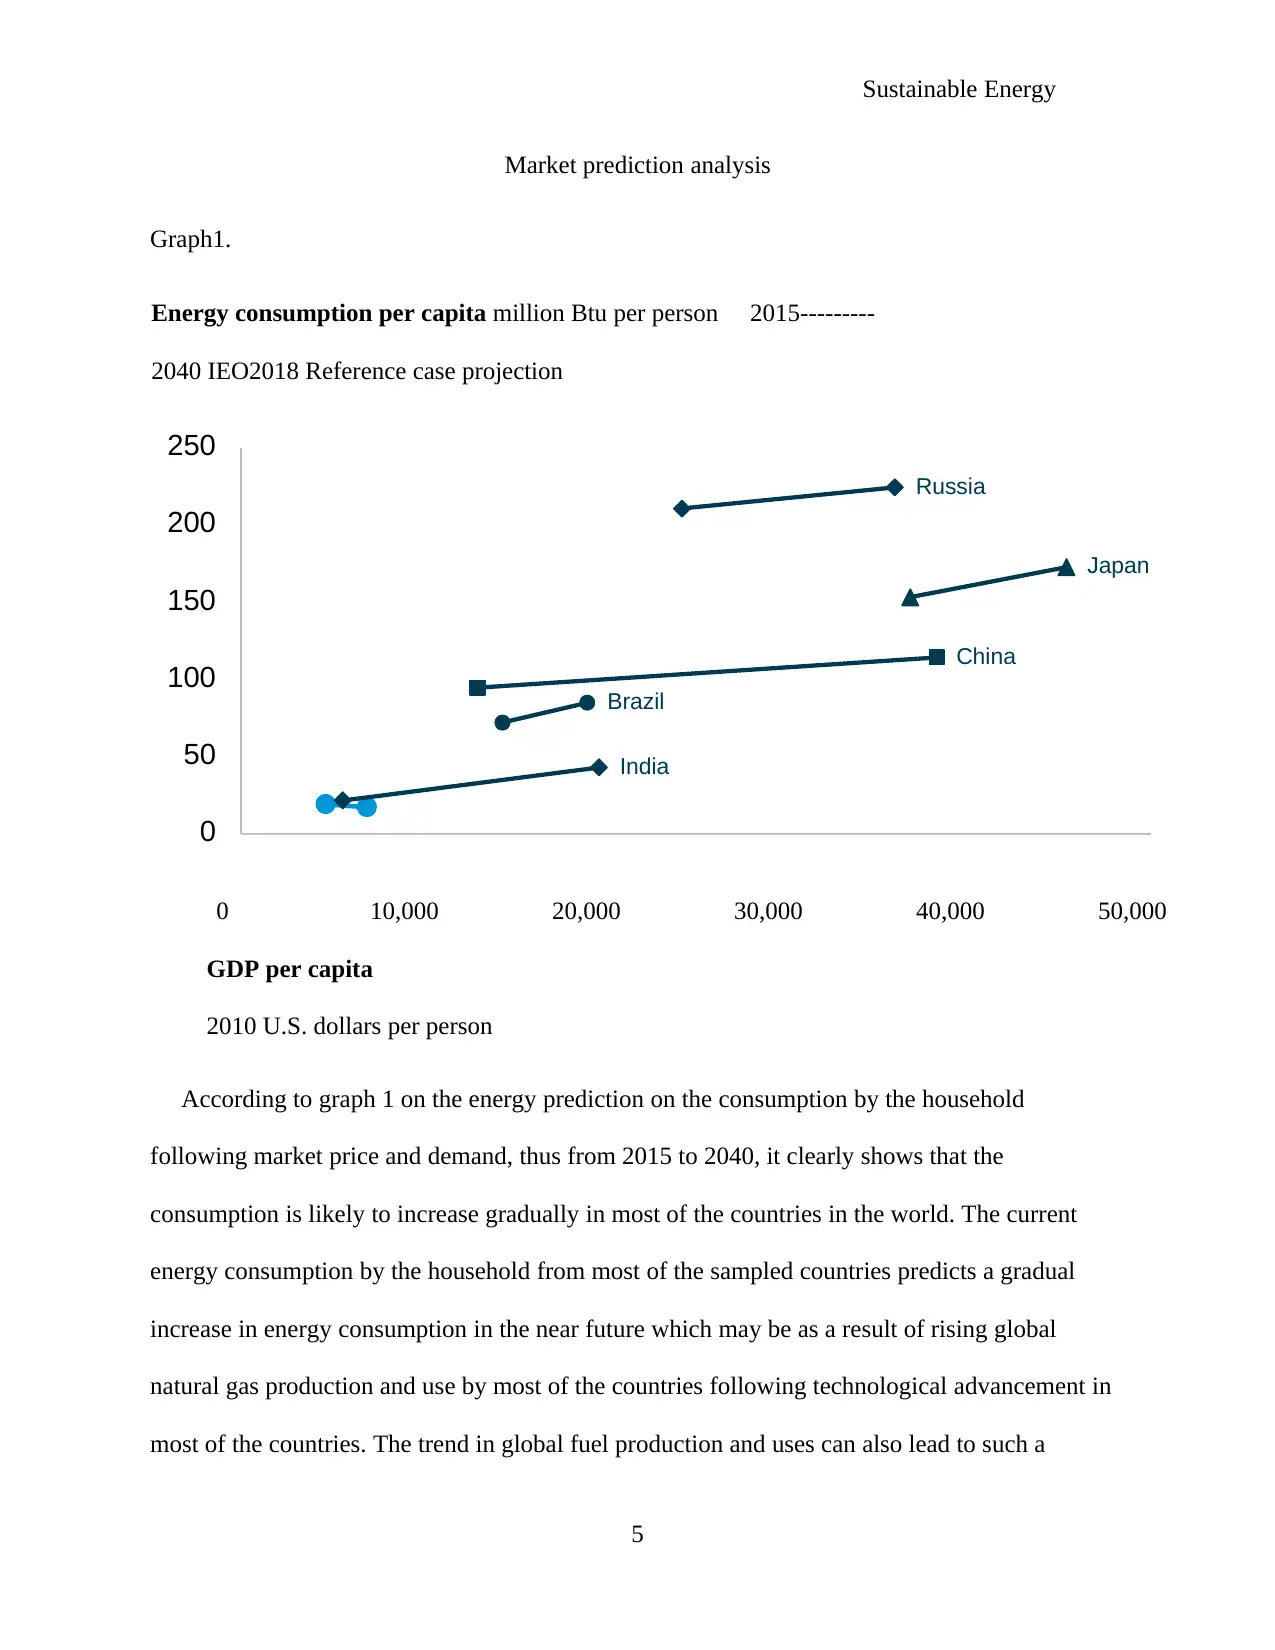
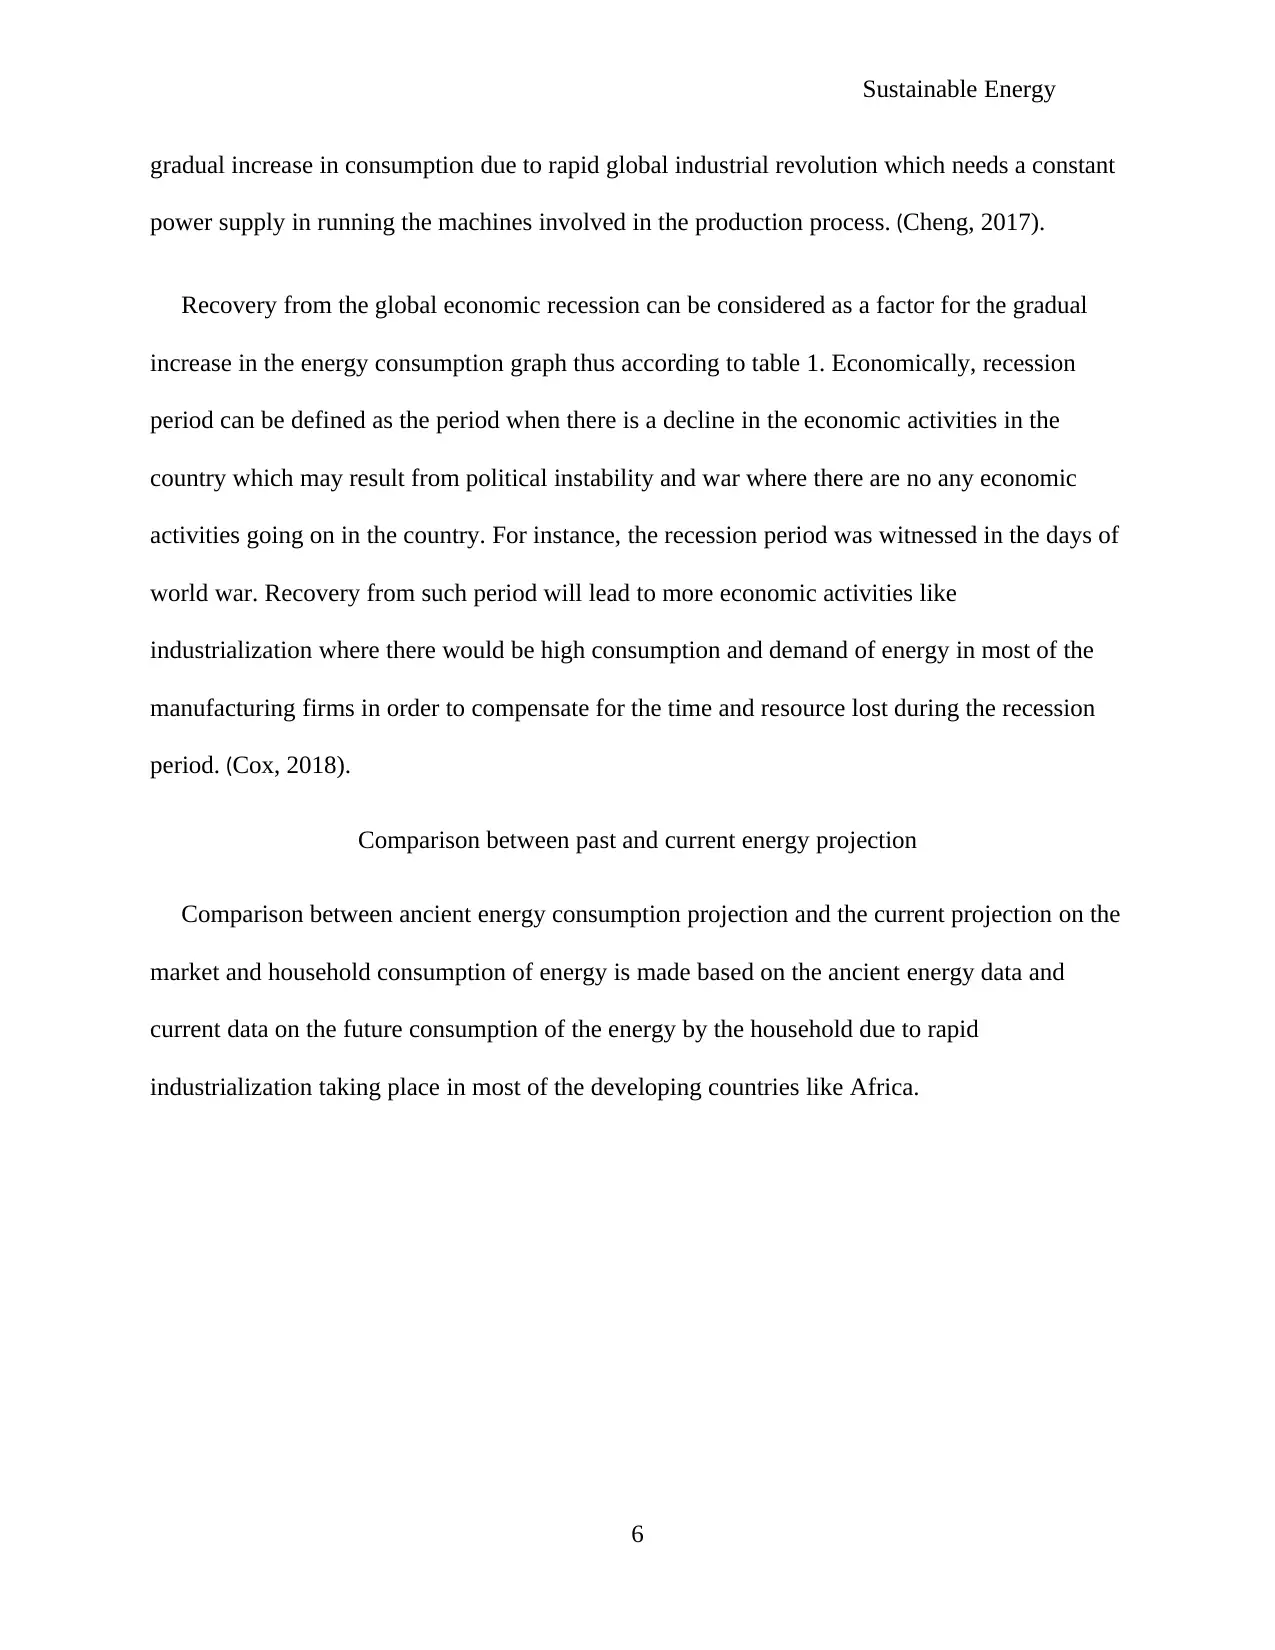
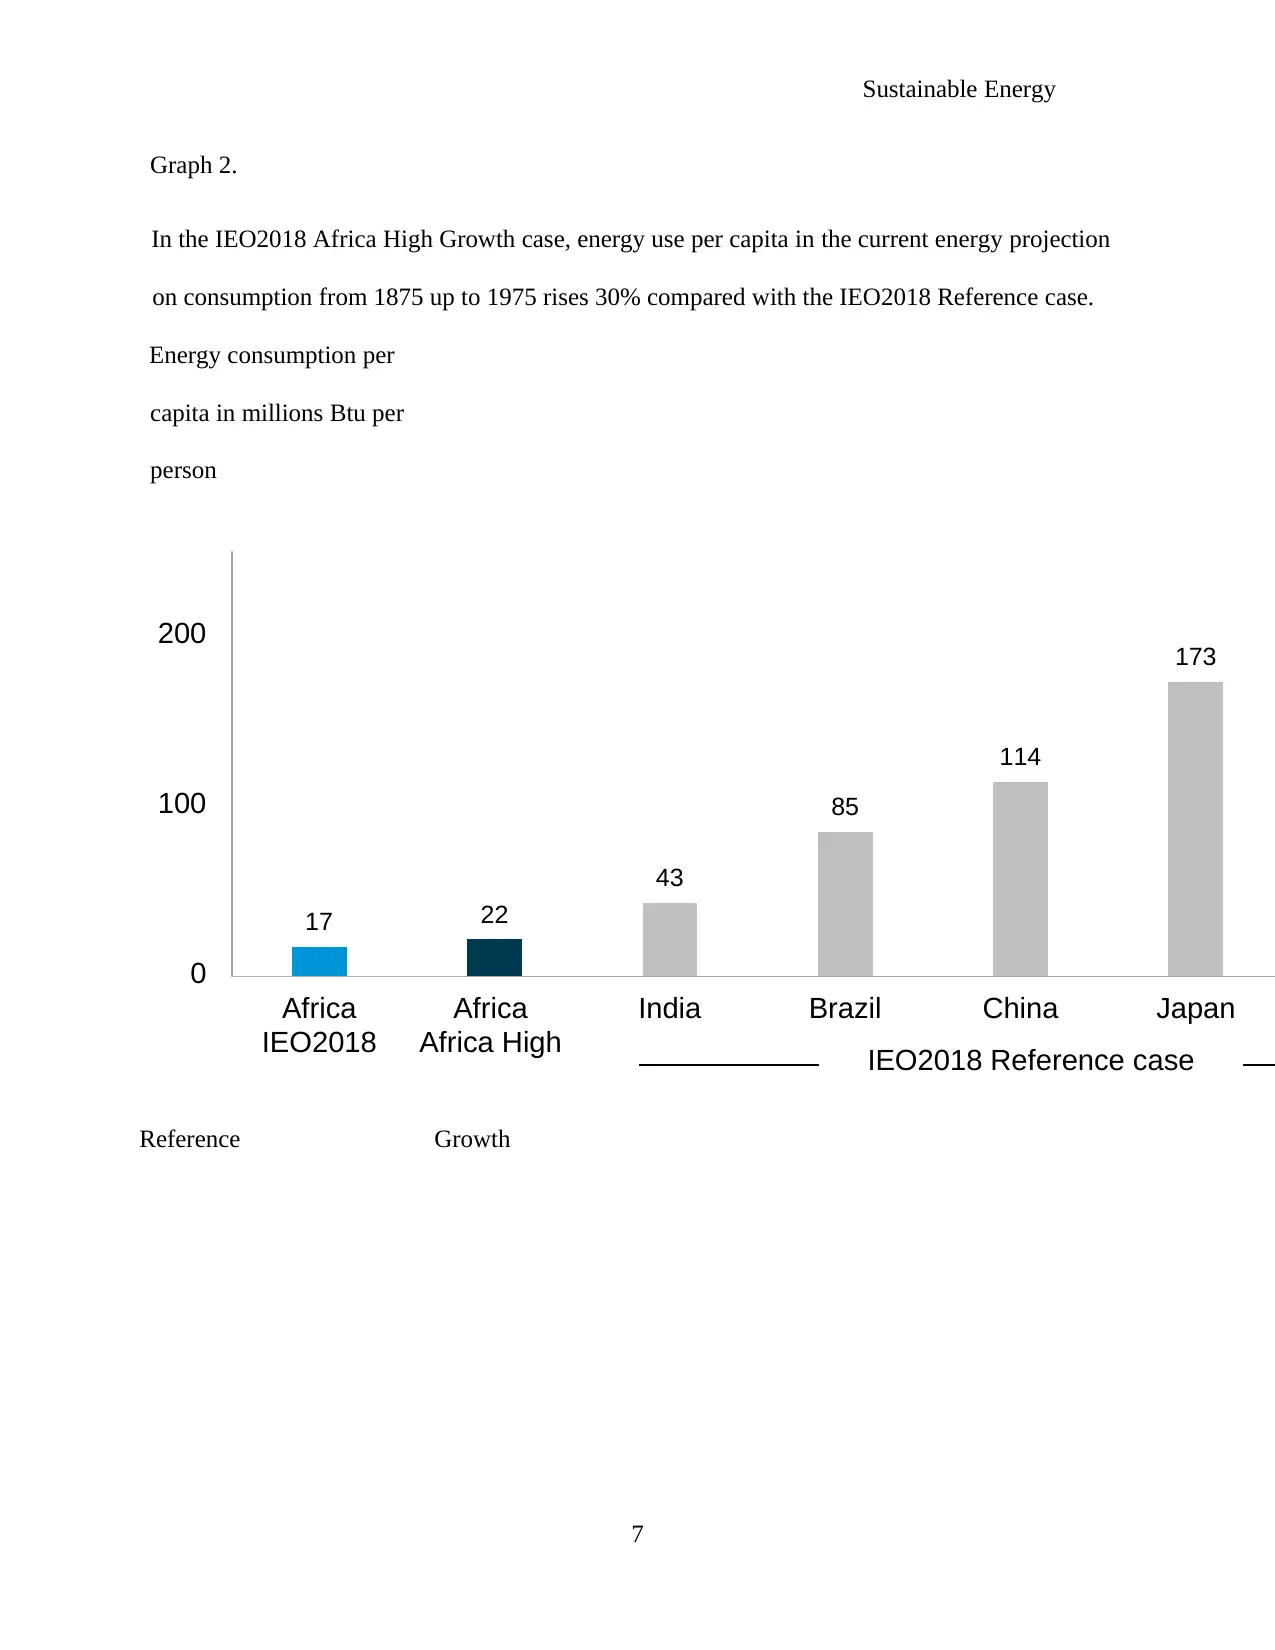
This report provides a detailed analysis of energy predictions, comparing historical projections with current data on energy consumption. It examines the differences between earlier and current energy projections, attributing these shifts to factors such as increased net electricity generation, recovery from global economic recession, rising global natural gas production, and changes in fuel consumption trends. The report includes graphical representations and tables illustrating energy consumption per capita, price summaries for various energy products, and global energy supply data. It highlights the gradual increase in energy demand and supply, emphasizing the need for increased energy production to meet market demands and the impact of technological advancements on energy production and conservation. The document is available on Desklib, a platform offering study tools and resources for students.

Sustainable Energy
Sustainable energy
By
Name
Course
Professor’s name
Institution
Location of institution
Date
1
Sustainable energy
By
Name
Course
Professor’s name
Institution
Location of institution
Date
1
Paraphrase This Document
Need a fresh take? Get an instant paraphrase of this document with our AI Paraphraser

Sustainable Energy
Executive summary
The report provided focuses on the analysis of the energy predictions made in the ancient days
on how energy market evolved from the past days to the present days. This will comprise the
comparison between past and current energy projections using graphs and tables to clearly show
the market projection of the energy consumption by the households.
The reason for the differences between the earlier energy projections and current projections is
provided into details by pointing out the possible reason for such differences in the market and
future supply of energy to the household up to 2050.
Contemporary data and graphical projection on the future supply of energy to the market
following its demand and price charged per watt is provided in the report.
2

Sustainable Energy
Introduction
The report is based on the comparison of the historic energy projections and current data on
energy consumption by the household. The comparison is made between the earlier energy
projection data in the current market and current data following the change in demand and
consumption of energy by the households. Energy prices per watt also can be considered as a
factor for the differences in the data compared. (Alper and Oguz, 2016, pg. 953-959)
Energy projection both in earlier and current data provided has portrayed a bigger difference
in consumption by the household and market supply thus depending on the price charged per
watt. The reason for the shift in energy consumption and the demand in the current market as
compared to the earlier market trend data includes the addition in net electricity generation,
rising global natural gas production and use, effects of recovery from the global economic
recession and higher coal consumption in the past days.
Comparison of the energy prediction on consumption is provided in the report and discussed
below giving relevant energy consumption graphs and tables based on the rise of consumption in
the world.
3
⊘ This is a preview!⊘
Do you want full access?
Subscribe today to unlock all pages.

Trusted by 1+ million students worldwide

Sustainable Energy
Sustainable energy
Energy being the most valuable natural resource to the development and industrialization
process in the world, the WEC energy group has provided the data analysis based on the
comparison on the ancient energy demand-supply projection and current projection. The data
analysis used by the WEC energy group, comparison data and future evolution of the energy
products are discussed in the context.
4
Paraphrase This Document
Need a fresh take? Get an instant paraphrase of this document with our AI Paraphraser

Brazil
China
India
Japan
Russia
0
50
100
150
200
250
Sustainable Energy
Market prediction analysis
Graph1.
Energy consumption per capita million Btu per person 2015---------
2040 IEO2018 Reference case projection
0 10,000 20,000 30,000 40,000 50,000
GDP per capita
2010 U.S. dollars per person
According to graph 1 on the energy prediction on the consumption by the household
following market price and demand, thus from 2015 to 2040, it clearly shows that the
consumption is likely to increase gradually in most of the countries in the world. The current
energy consumption by the household from most of the sampled countries predicts a gradual
increase in energy consumption in the near future which may be as a result of rising global
natural gas production and use by most of the countries following technological advancement in
most of the countries. The trend in global fuel production and uses can also lead to such a
5

Sustainable Energy
gradual increase in consumption due to rapid global industrial revolution which needs a constant
power supply in running the machines involved in the production process. (Cheng, 2017).
Recovery from the global economic recession can be considered as a factor for the gradual
increase in the energy consumption graph thus according to table 1. Economically, recession
period can be defined as the period when there is a decline in the economic activities in the
country which may result from political instability and war where there are no any economic
activities going on in the country. For instance, the recession period was witnessed in the days of
world war. Recovery from such period will lead to more economic activities like
industrialization where there would be high consumption and demand of energy in most of the
manufacturing firms in order to compensate for the time and resource lost during the recession
period. (Cox, 2018).
Comparison between past and current energy projection
Comparison between ancient energy consumption projection and the current projection on the
market and household consumption of energy is made based on the ancient energy data and
current data on the future consumption of the energy by the household due to rapid
industrialization taking place in most of the developing countries like Africa.
6
⊘ This is a preview!⊘
Do you want full access?
Subscribe today to unlock all pages.

Trusted by 1+ million students worldwide

17 22
43
85
114
173
0
100
200
Africa
IEO2018
Africa
Africa High
India Brazil China Japan
IEO2018 Reference case
Sustainable Energy
Graph 2.
In the IEO2018 Africa High Growth case, energy use per capita in the current energy projection
on consumption from 1875 up to 1975 rises 30% compared with the IEO2018 Reference case.
Energy consumption per
capita in millions Btu per
person
Reference Growth
7
Paraphrase This Document
Need a fresh take? Get an instant paraphrase of this document with our AI Paraphraser

Sustainable Energy
Table 1.
Price summary (historical and forecast)
2017 2018 2019 2020
WTI Crude Oila
dollars per barrel
50.79 65.06 54.79 58
Brent Crude Oil
dollars per barrel
54.15 71.19 61.03 62
Gasolineb
dollars per gallon
2.42 2.73 2.47 2.56
Dieselc
dollars per gallon
2.65 3.18 2.95 3.15
Heating Oild
dollars per gallon
2.51 3.02 2.86 2.99
Natural Gasd
dollars per thousand cubic feet
10.86 10.5 10.79 10.92
Electricityd
cents per kilowatt-hour
12.89 12.91 13.25 13.45
aWest Texas Intermediate.
average regular pump price.
Note: Italics indicate forecast.
cOn-highway retail.
dU.S. Residential average.
8

Sustainable Energy
Table 2: World energy supply 1950 – 2050 (data known until 1974). Source: Ion (1978).
Graph 3. Energy supply and demand projection
9
Table 2: World energy supply 1950 – 2050 (data known until 1974). Source: Ion (1978).
Graph 3. Energy supply and demand projection
9
⊘ This is a preview!⊘
Do you want full access?
Subscribe today to unlock all pages.

Trusted by 1+ million students worldwide

Sustainable Energy
According to graph 2, it predicts the demand of energy in developing countries like Africa
for a period ranging from 1875 to 1975 where the demand and consumption of energy
specifically in developing nations are expected to increase by 30%.
In graph 3, the supply and demand for energy globally increases gradually for a period
ranging from 1995 to 2050. It focuses on the current energy demand projection by the household
and manufacturing firms. There is a gradual increase in the demand of most of the energy
products in the current market following the analysis on graph 3.
Table 1 focuses on the price summary of the energy products from the year 2017 to 2020. It
can be clearly summarized that the price of the energy products in the table 1 increase per year
thus following market demand for such products as noted in graph 3. The projection on the price
of energy products by table 1 for three consecutive years shows a gradual increase in price thus
the future price of the energy products will be higher than the current price. (Dayarathna, Wen,
and Fan, 2016, pg 732-794).
Table 2 shows the energy products supply and demand by the household where the supply
and demand for energy is spotted to rise per year for a period that ranges between1995 to 2050.
The supply-demand data on the energy products across the world increases yearly in that the
supply for the energy products needs to be increased as more energy production or mining
should be increased by the oil producing countries so as to meet the market demand for the
energy products thus avoiding shortage in the near future. (Erturk, and Inman, 2011).
10
Paraphrase This Document
Need a fresh take? Get an instant paraphrase of this document with our AI Paraphraser

Sustainable Energy
Reasons for the differences
Addition in net electricity generation
Addition in net electricity generation by different states will increase the supply of energy
products in the market and to households. When there is a large production of energy within the
country, its supply will tend to increase rapidly since the country will have excess energy thus
electricity for its domestic consumption thus may resolve to sell its surplus electricity to the
neighboring countries who do not produce such energy so as to earn foreign currencies over such
trade thus will boost the economic status of that particular country. (Firoozabadi, 2016).
Addition in net generation of energy products like electricity will supplement local industries
involved in the production process with cheap power thus promotes local firms’ development
which in return will contribute to economic development through the employment of the
particular country’s citizens.
Effects of recovery from the global economic recession
Recession period can be defined as that particular period where there is a decline in the
economic activities in the country. Recession period may be as a result of political instability
where the country is at war and there is no trade going on in the country. World recession period
was witnessed back during the world wars where every nation was involved in a war. (Fumo, and
Biswas, 2015, pg 332-343).
Global recovery from recession period can be considered a reason for the differences in the
earlier energy projection and current projection since during the recovery period, countries will
strive to develop some of its dormant economic activities which were affected during the
11

Sustainable Energy
recession period. Industrialization is considered one the major recovery option every country will
start at since it's considered as a major driver for economic growth.
Consumption of energy by the manufacturing industries has led to the rapid increase and
demand of energy products just after the recession period as more factories came up to fill the
inadequacy of some basic products needed by the households and by that consumption and
demand for energy increase giving the difference between the two projections. (Giménez, and
Bisquert, 2016, pg 403-407).
Rising global natural gas production
Technological advancement in most of the country has led to an increasing rate of natural gas
production globally. Following the high cost importing natural gas from oil producing countries
which are considered high, there is a rising attempt of producing natural gas by different states in
order to forgo the cost of importing the energy products. Through these activities, there is a rapid
increase in production and supply of energy products into the market which results to differ in
two projections thus current and ancient projection on the demand and supply of energy
products. (Inglesi-Lotz, 2016, pg 58-63).
Rise in production also increase the energy consumption within a country since it is readily
and cheaply available to the local consumers as compared to earlier imported ones. Through
these, energy supply will reach up to the less fortunate households which could not afford to hire
the imported energy product which is relatively expensive compared to locally produced
products.
12
⊘ This is a preview!⊘
Do you want full access?
Subscribe today to unlock all pages.

Trusted by 1+ million students worldwide
1 out of 19
Related Documents
Your All-in-One AI-Powered Toolkit for Academic Success.
+13062052269
info@desklib.com
Available 24*7 on WhatsApp / Email
Unlock your academic potential
Copyright © 2020–2025 A2Z Services. All Rights Reserved. Developed and managed by ZUCOL.


