Analysis of Energy Supply Projections and Current Data - Module Report
VerifiedAdded on 2022/09/18
|13
|2793
|27
Report
AI Summary
This report provides a comprehensive comparison of historic energy projections and current data, focusing on the global energy supply and demand from 1950 to 2050. It examines the gap between projected and actual energy supply, highlighting the underestimation of energy demand and overestimation of per capita projections in the past. The report analyzes the use of conventional versus renewable energy sources, emphasizing the need for sustainable energy generation, particularly through wind, solar, geothermal, and nuclear fusion. It explores the reasons for discrepancies in energy projections, including financial speculation, government regulations, fuel imports and exports, global factors, power generation changes, and energy losses. The report references the United Nations' Sustainable Development Goals (SDGs), specifically Goal 7, which emphasizes the importance of clean, affordable, and safe energy for the world. The conclusion underscores the necessity of transitioning from fossil fuels to inexhaustible energy sources to meet future energy demands and achieve global sustainability goals.
Running Head: MARKETING
0
Marketing
Sustainable Energy
(Student Details: )
9/3/2019
0
Marketing
Sustainable Energy
(Student Details: )
9/3/2019
Paraphrase This Document
Need a fresh take? Get an instant paraphrase of this document with our AI Paraphraser
Marketing
1
Executive Summary
The report is all about calculating differences amid the projected energy supply since the year
1950 to 2050 while studying and analyzing the data and graphics related to world energy
supply and demand. To do so, the data from different sources has been collected, integrated,
analysed and re-assessed for solving the problem of sustainable energy. This report has
accessed several measures of generating clean, safe and affordable energy to supply the
whole world people. In this way, the main findings are suggesting that world needs to
generate more and more sustainable energy while replacing conventional energy resources
with non-conventional energy resources like wind, solar, geothermal and nuclear fusion.
Moreover, some key reasons responsible for the differences amid projected and actual energy
supply have been found successfully. In a nutshell, the forecasted data can be made real and
actual data of total energy demand of the world, when the whole world’s energy agencies will
work towards achieving 17 SDGs set by United Nations with the help of generating and
supplying sustainable energy.
Marketing
2
Contents
Executive Summary...................................................................................................................1
Sustainable Energy.....................................................................................................................3
Introduction................................................................................................................................3
Data analysis and graphics.........................................................................................................3
Reasons for differences between projected and actual..............................................................8
Financial speculation..............................................................................................................8
Government regulations.........................................................................................................8
Imports and Exports of fuels..................................................................................................8
Global factors.........................................................................................................................8
Power generation changes......................................................................................................8
Energy losses..........................................................................................................................9
Conclusion..................................................................................................................................9
References................................................................................................................................10
⊘ This is a preview!⊘
Do you want full access?
Subscribe today to unlock all pages.
Trusted by 1+ million students worldwide
Marketing
3
Sustainable Energy
Introduction
This report is focused on conducting a comparison survey of historic energy projections as
well as current data. The discussion is going to include the renewable energy modules in
order to analyse predictions made in the past in relation to how energy markets were
anticipated to evolve up to date and beyond as well. Besides, data analysis and data graphics
will be presented within the report in the context of global energy supply projections
(Fadaeenejad et al., 2014). To do so, this discussion is going to analyse and organize energy
supply data for the whole world from diverse sources. The reasons why previous predictions
of the evolution of energy markets differed from what actually transpired will be discussed in
detail. Additionally, an analysis of how the energy predictions affect our current attempts to
project forward will be conducted. Thus, a summary of the discussion will be presented at the
end of the report while concluding the reasons for differences amid actual as well as
projected energy supply calculations.
Data analysis and graphics
Post conducting a comparison of historic energy projections with the current data, it has been
found that there is a considerable gap in between world energy supply and demand from 1950
to 2050 (Birol, 2018). As we know that total energy generated is always less than energy
demanded by the world users. This is because world is continuously using conventional
energy resources such as coal, oil, fossil fuels, to generate electrical power for daily use (Arto
et al., 2016).
The possible graph of world energy supply from 1950 to 2050 is clearly suggesting that
world energy agencies are using non-renewable sources like coal, lignite, NGL, crude oil,
natural gas and many other exhaustible resources for supplying energy all across the world.
This data presented in the following figure is directing the world to use renewable energy
resources. In this context, people should follow the Sustainable Development Goals (SDG)
set by United Nations so that sustainable future of the world can be ensured. Besides, hydro
Paraphrase This Document
Need a fresh take? Get an instant paraphrase of this document with our AI Paraphraser
Marketing
4
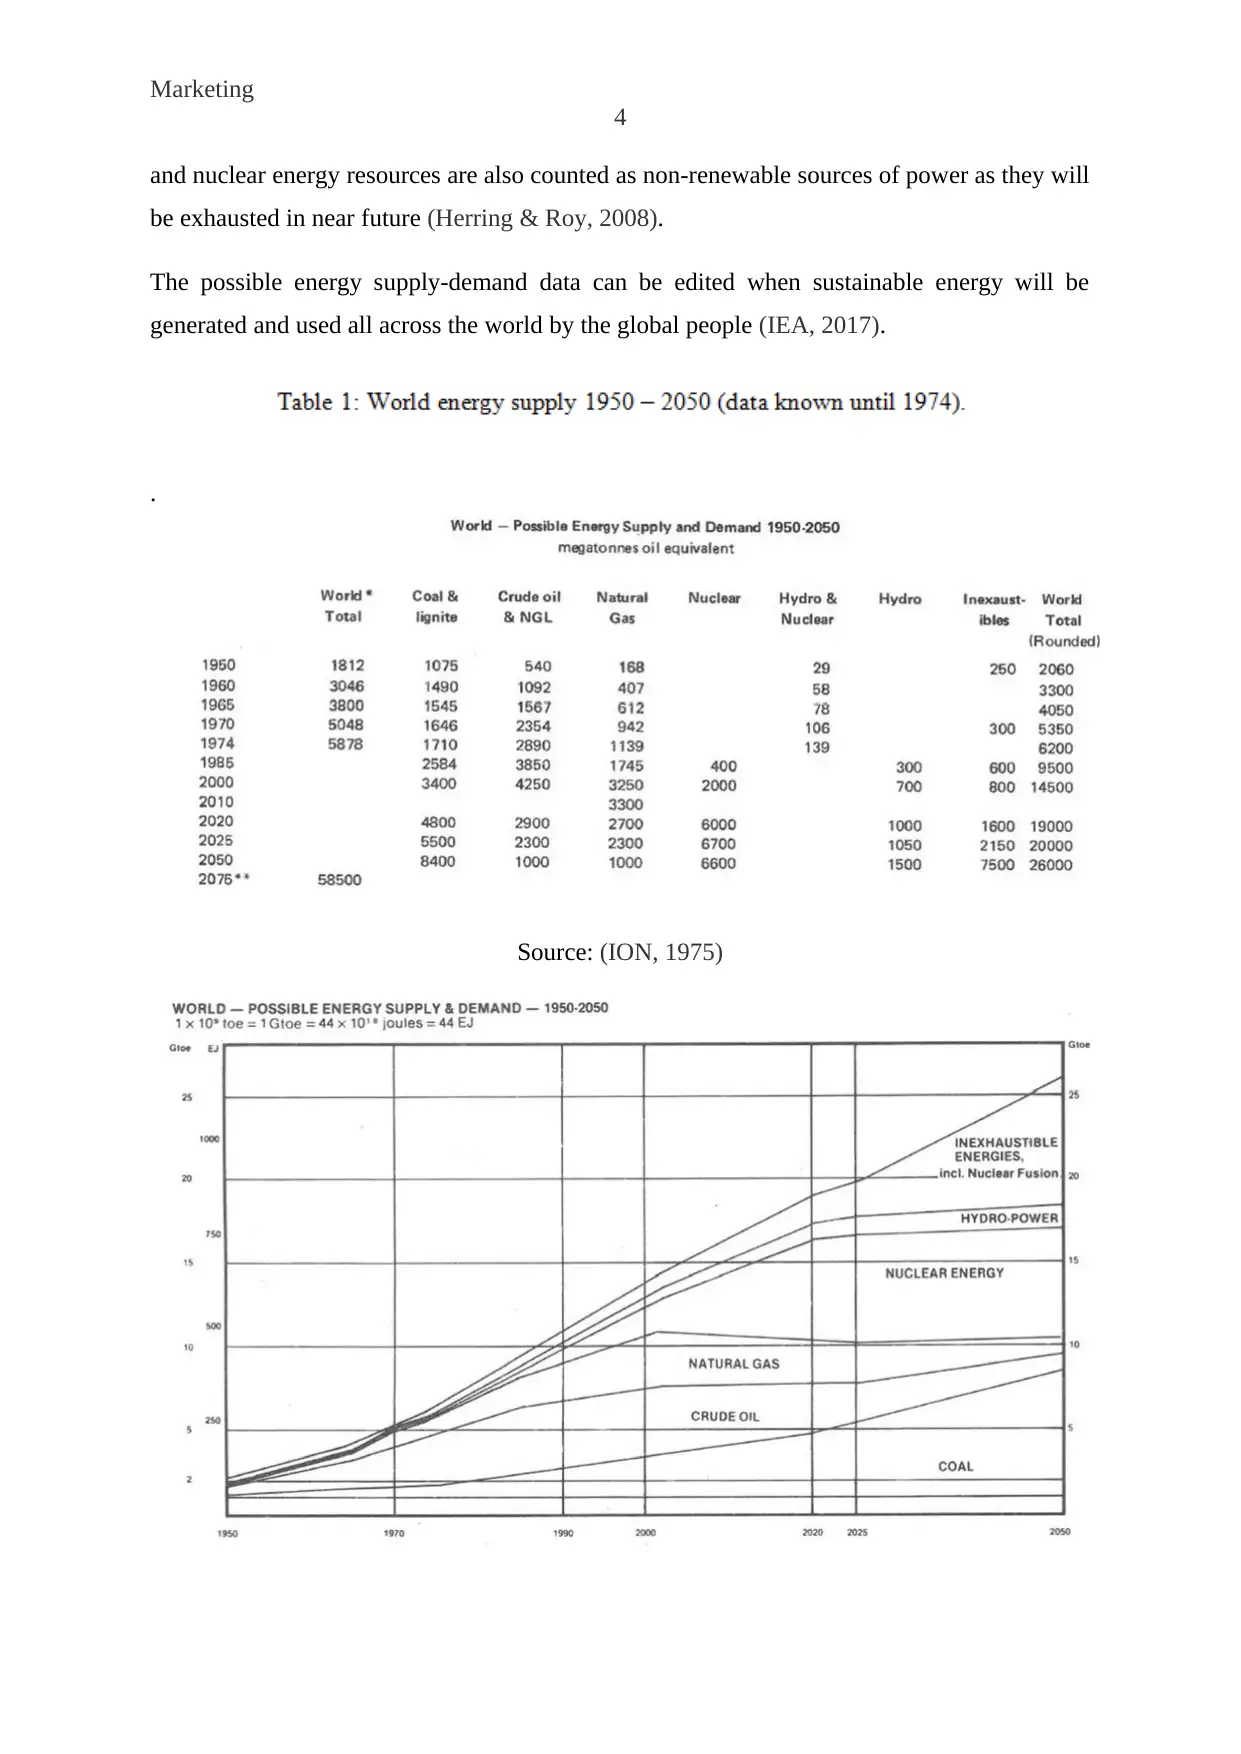
and nuclear energy resources are also counted as non-renewable sources of power as they will
be exhausted in near future (Herring & Roy, 2008).
The possible energy supply-demand data can be edited when sustainable energy will be
generated and used all across the world by the global people (IEA, 2017).
.
Source: (ION, 1975)
4
and nuclear energy resources are also counted as non-renewable sources of power as they will
be exhausted in near future (Herring & Roy, 2008).
The possible energy supply-demand data can be edited when sustainable energy will be
generated and used all across the world by the global people (IEA, 2017).
.
Source: (ION, 1975)
Marketing
5
In this context, it is worth knowing that there is a ‘stacked line’ chart so the amount is the
vertical distance between the lines, not the line itself. Apart from this, crude oil and gas
become very small by the year 2050, and the top line shows the total, reaching 26 Gtoe
(26,000 Mtoe in the table); this is not the value of inexhaustible energies including nuclear
fusion and renewables like biomass, solar and wind energy (Brunner & Rechberger, 2015).
Nuclear energy in the form of nuclear fusion is one of the best resources of energy generation
and thereby supply to all over the world. Besides, the International Energy Forum (IEF) is
aiming to have good mutual understanding as well as awareness of common energy interests
among their members. While including all of the six continents as well as accounting for
more than 90% of world energy supply and demand for gas and oil, the IEF not only
consumed and produced countries of the OPEC and IEA but also Transit States and major
players outside of the memberships. The data and graphics analysis of the given figure and
table suggests that fuel categorization must be used. For example, biofuels, oil and liquids
categorization will be useful approach for producing sustainable energy for the entire world.
It has been observed in the outcomes of the various surveys related to energy that renewable
resources categorization, as well as non-marketed energy, is the source to achieve SDGs by
2030 (ION, 1975).
Apart from this, energy planning is essential for the world's energy planners in order to
accurately plan energy supply-demand for the future. In addition, it is useful for utilizing
renewable and sustainable energy resources to a superior extent. The data analysis and
research conducted in this paper suggesting that past projections of regional and global
energy consumption are typically compared to real-time data (United Nations Development
Programme, 2018). Energy projections created in the past decades for total energy demand
were typically underestimated; yet per capita projections were overestimating real-time
trends. It has been found that while considering the construction sector, commercial and
residential energy consumption was underestimated within WEO 1982 as well as WEO 1994.
Therefore, wherever per capita values have been considered, higher values than real-time data
were projected (Hill et al., 1995).
⊘ This is a preview!⊘
Do you want full access?
Subscribe today to unlock all pages.
Trusted by 1+ million students worldwide
Marketing
6
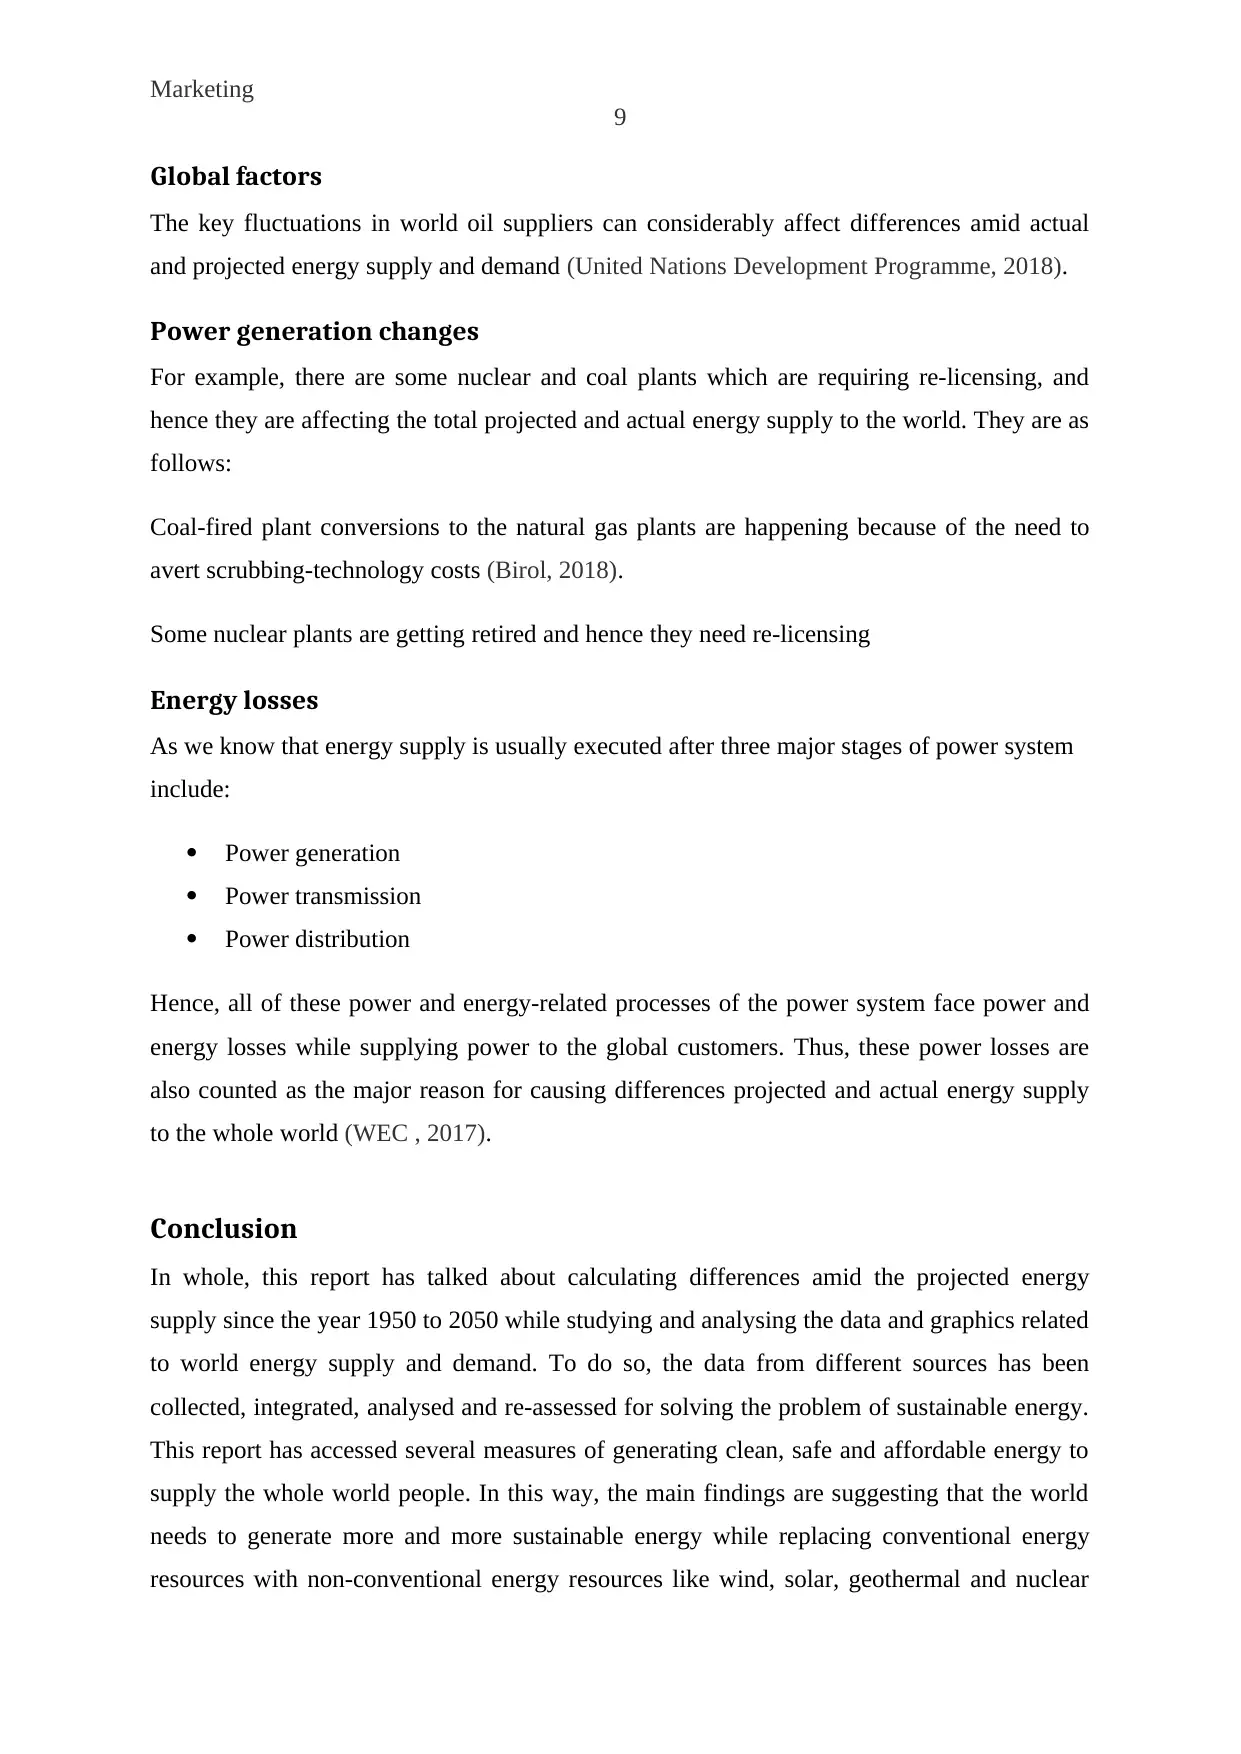
The energy forecasting is very useful while modelling system or in policy efforts, as all the
kinds of uncertainties must be known in advance. This paper has analysed the real errors
within past forecasts (Aman et al., 2013). The data and graphs suggest that the anticipated
general distribution usually fails to model the frequency of final results accurately as depicted
by the past years’ energy supply and demand. Subsequently, the conservation of fossil fuels
and their replacement with the inexhaustible is recommended to the world energy agencies.
This gap amid energy projections in the past, present and future from the supply as well as
demand perspectives, is clearly suggesting that significant reasons are preventing world from
meeting the demand with adequate energy supply (World Bank, 2015).
Source: (Union of concerned Scientists, 2018)
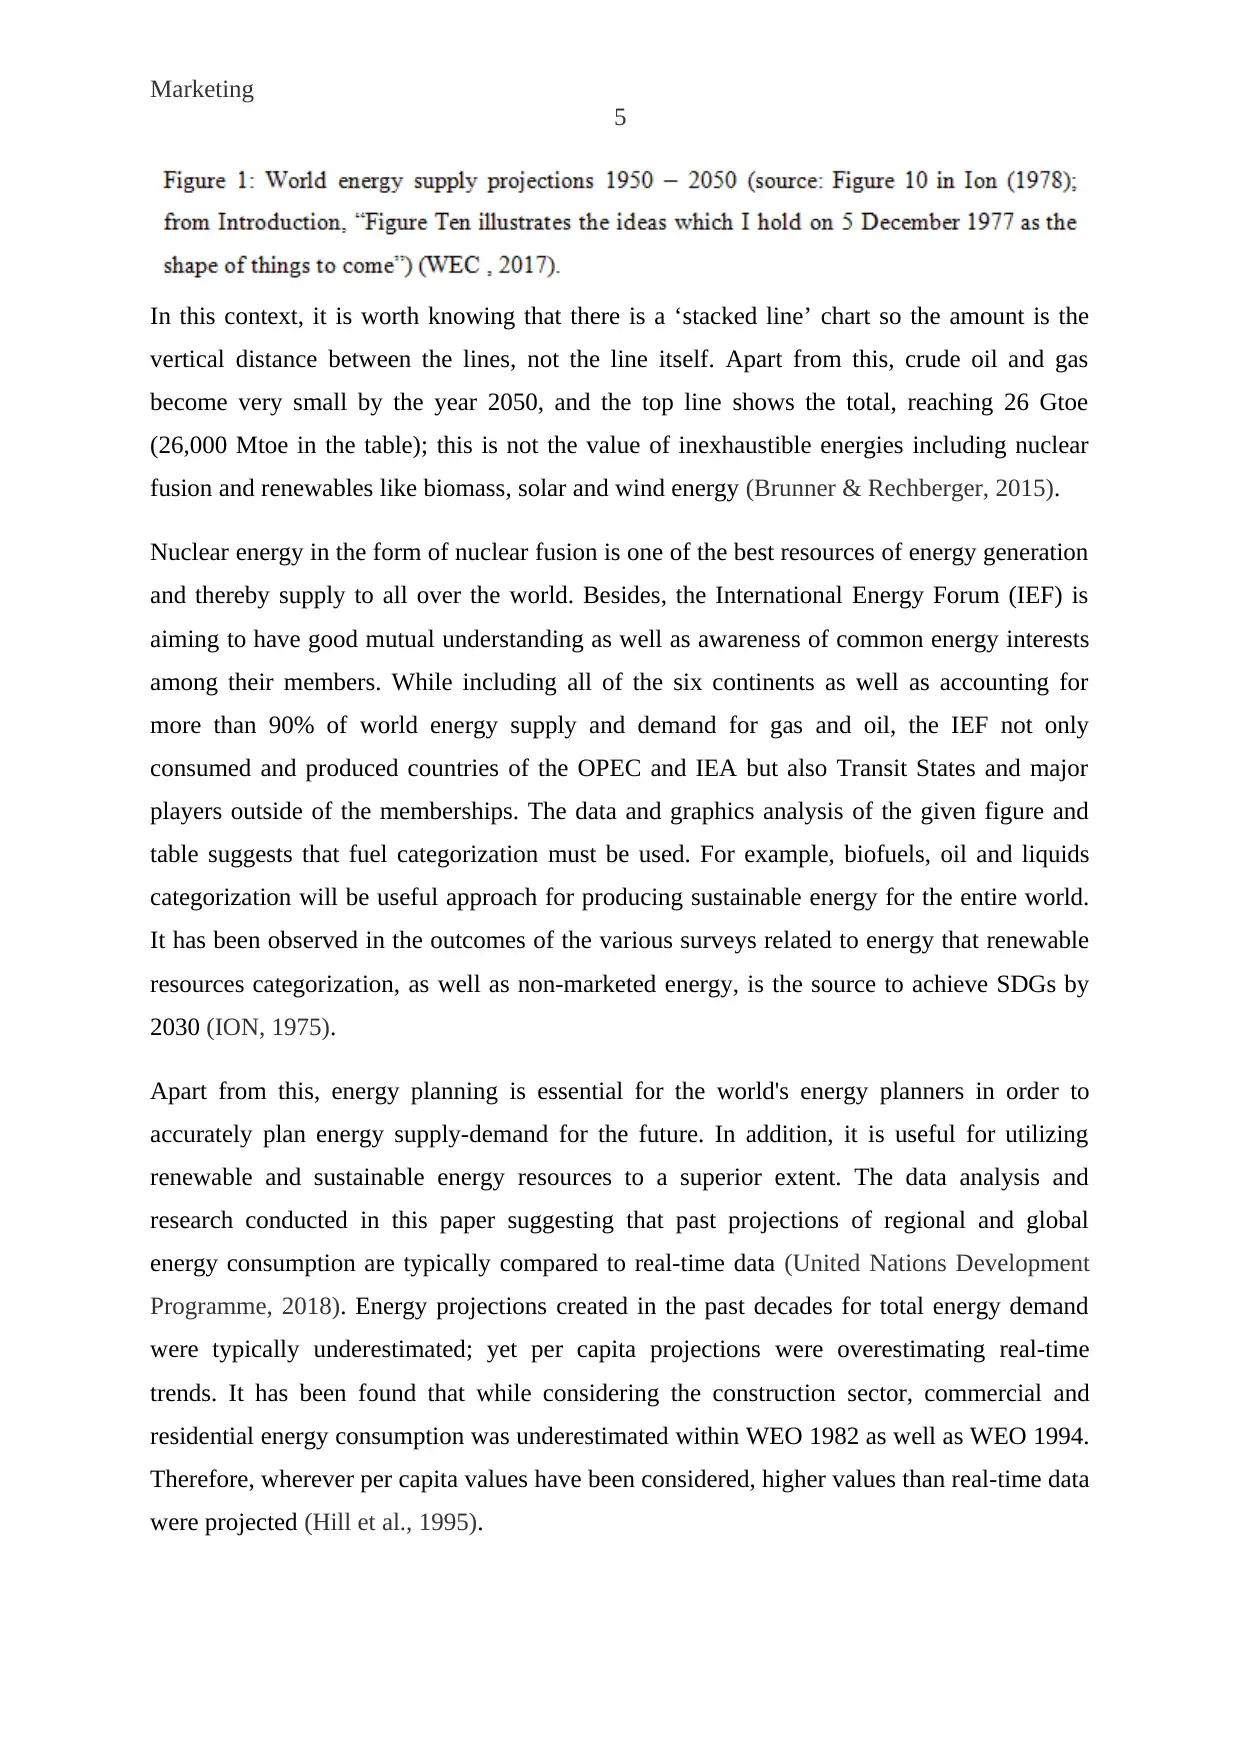
Moreover, as described by the (United Nations, 2018) Goal-7 of the 17 SDGs is all about
ensuring safe, affordable and clean energy for the entire world. To do so, the world needs to
generate, transmit, and supply sustainable energy to the whole world. The above is only
possible when energy will be generated with the help of renewable energy resources.
Presently, the renewable resources counted for supplying the sustainable energy to the world
are geothermal, solar hot water, solar PV, combines hear and power, wind, biofuels, biomass,
solar space heating, and nuclear fusion energy. By using such renewable energy resources,
the world can be evolved from a sustainability viewpoint (Inderwildi & King, 2012).
6
The energy forecasting is very useful while modelling system or in policy efforts, as all the
kinds of uncertainties must be known in advance. This paper has analysed the real errors
within past forecasts (Aman et al., 2013). The data and graphs suggest that the anticipated
general distribution usually fails to model the frequency of final results accurately as depicted
by the past years’ energy supply and demand. Subsequently, the conservation of fossil fuels
and their replacement with the inexhaustible is recommended to the world energy agencies.
This gap amid energy projections in the past, present and future from the supply as well as
demand perspectives, is clearly suggesting that significant reasons are preventing world from
meeting the demand with adequate energy supply (World Bank, 2015).
Source: (Union of concerned Scientists, 2018)
Moreover, as described by the (United Nations, 2018) Goal-7 of the 17 SDGs is all about
ensuring safe, affordable and clean energy for the entire world. To do so, the world needs to
generate, transmit, and supply sustainable energy to the whole world. The above is only
possible when energy will be generated with the help of renewable energy resources.
Presently, the renewable resources counted for supplying the sustainable energy to the world
are geothermal, solar hot water, solar PV, combines hear and power, wind, biofuels, biomass,
solar space heating, and nuclear fusion energy. By using such renewable energy resources,
the world can be evolved from a sustainability viewpoint (Inderwildi & King, 2012).
Paraphrase This Document
Need a fresh take? Get an instant paraphrase of this document with our AI Paraphraser
Marketing
7
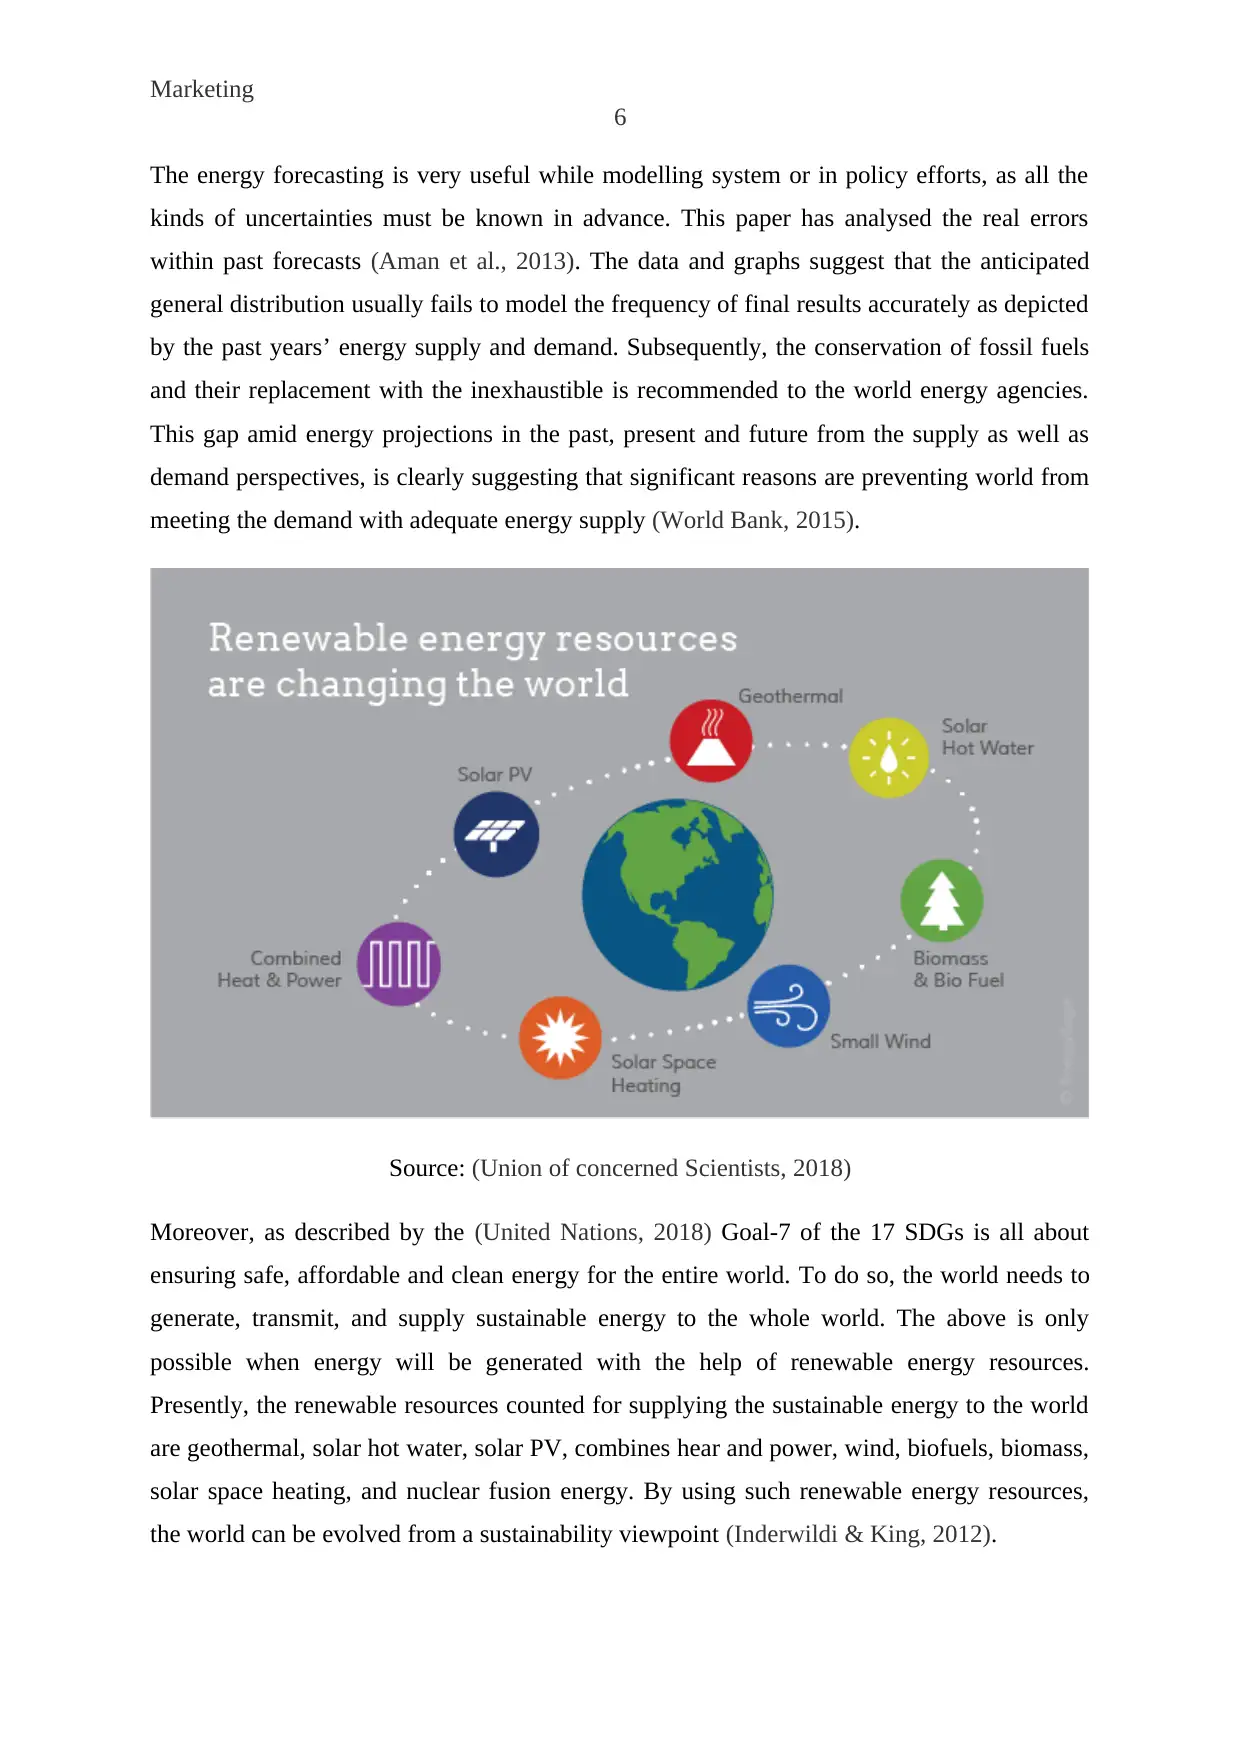
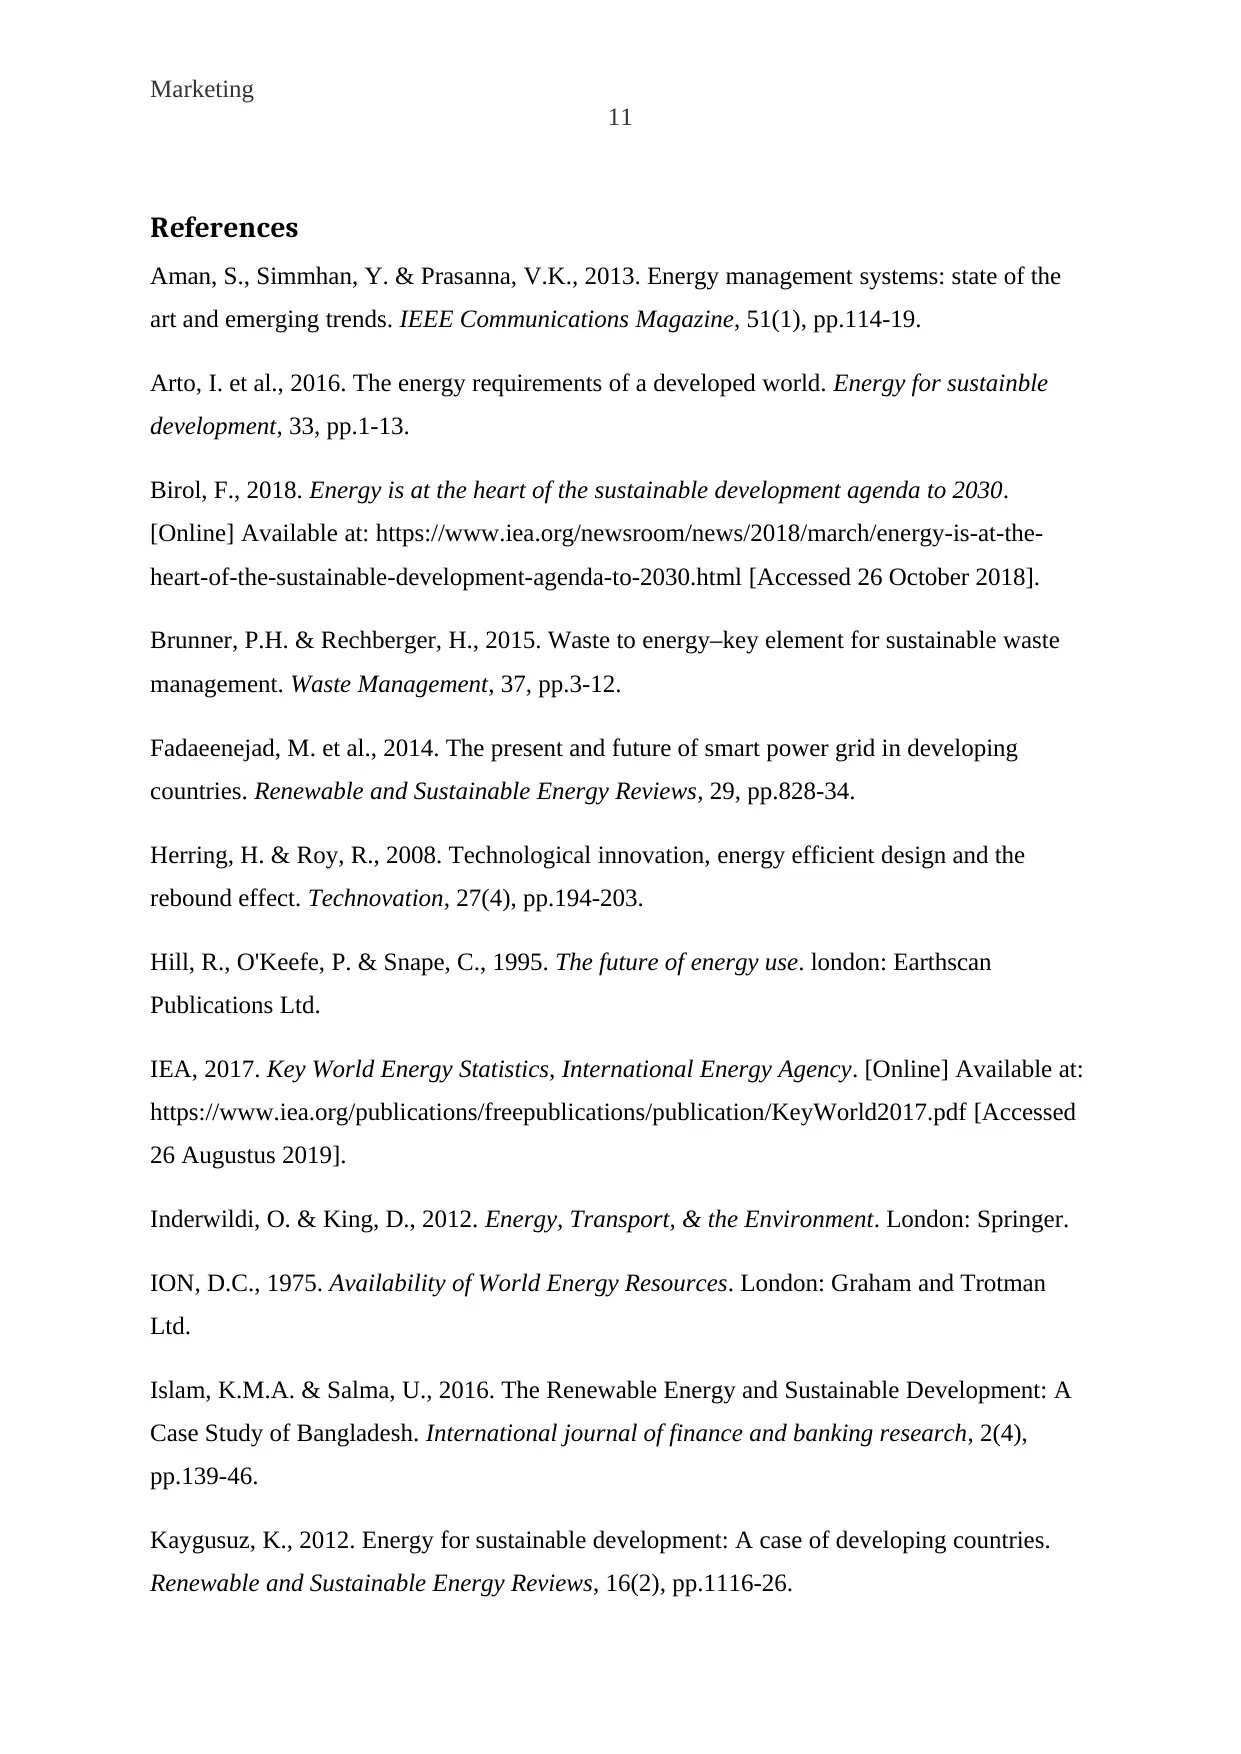
Source: (Fadaeenejad et al., 2014)
Likewise, the above-mentioned graph is showing that energy supplied to the whole world will
be clean and safe if the targets for alternative fuel utilisation for the years 2010-2050 will be
met appropriately. Therefore, a constant increase in the targets set for renewable energy
resources can be seen in the above-mentioned figure, which is showing that alternative fuels
must be used with the global population hike day-by-day.
7
Source: (Fadaeenejad et al., 2014)
Likewise, the above-mentioned graph is showing that energy supplied to the whole world will
be clean and safe if the targets for alternative fuel utilisation for the years 2010-2050 will be
met appropriately. Therefore, a constant increase in the targets set for renewable energy
resources can be seen in the above-mentioned figure, which is showing that alternative fuels
must be used with the global population hike day-by-day.
Marketing
8
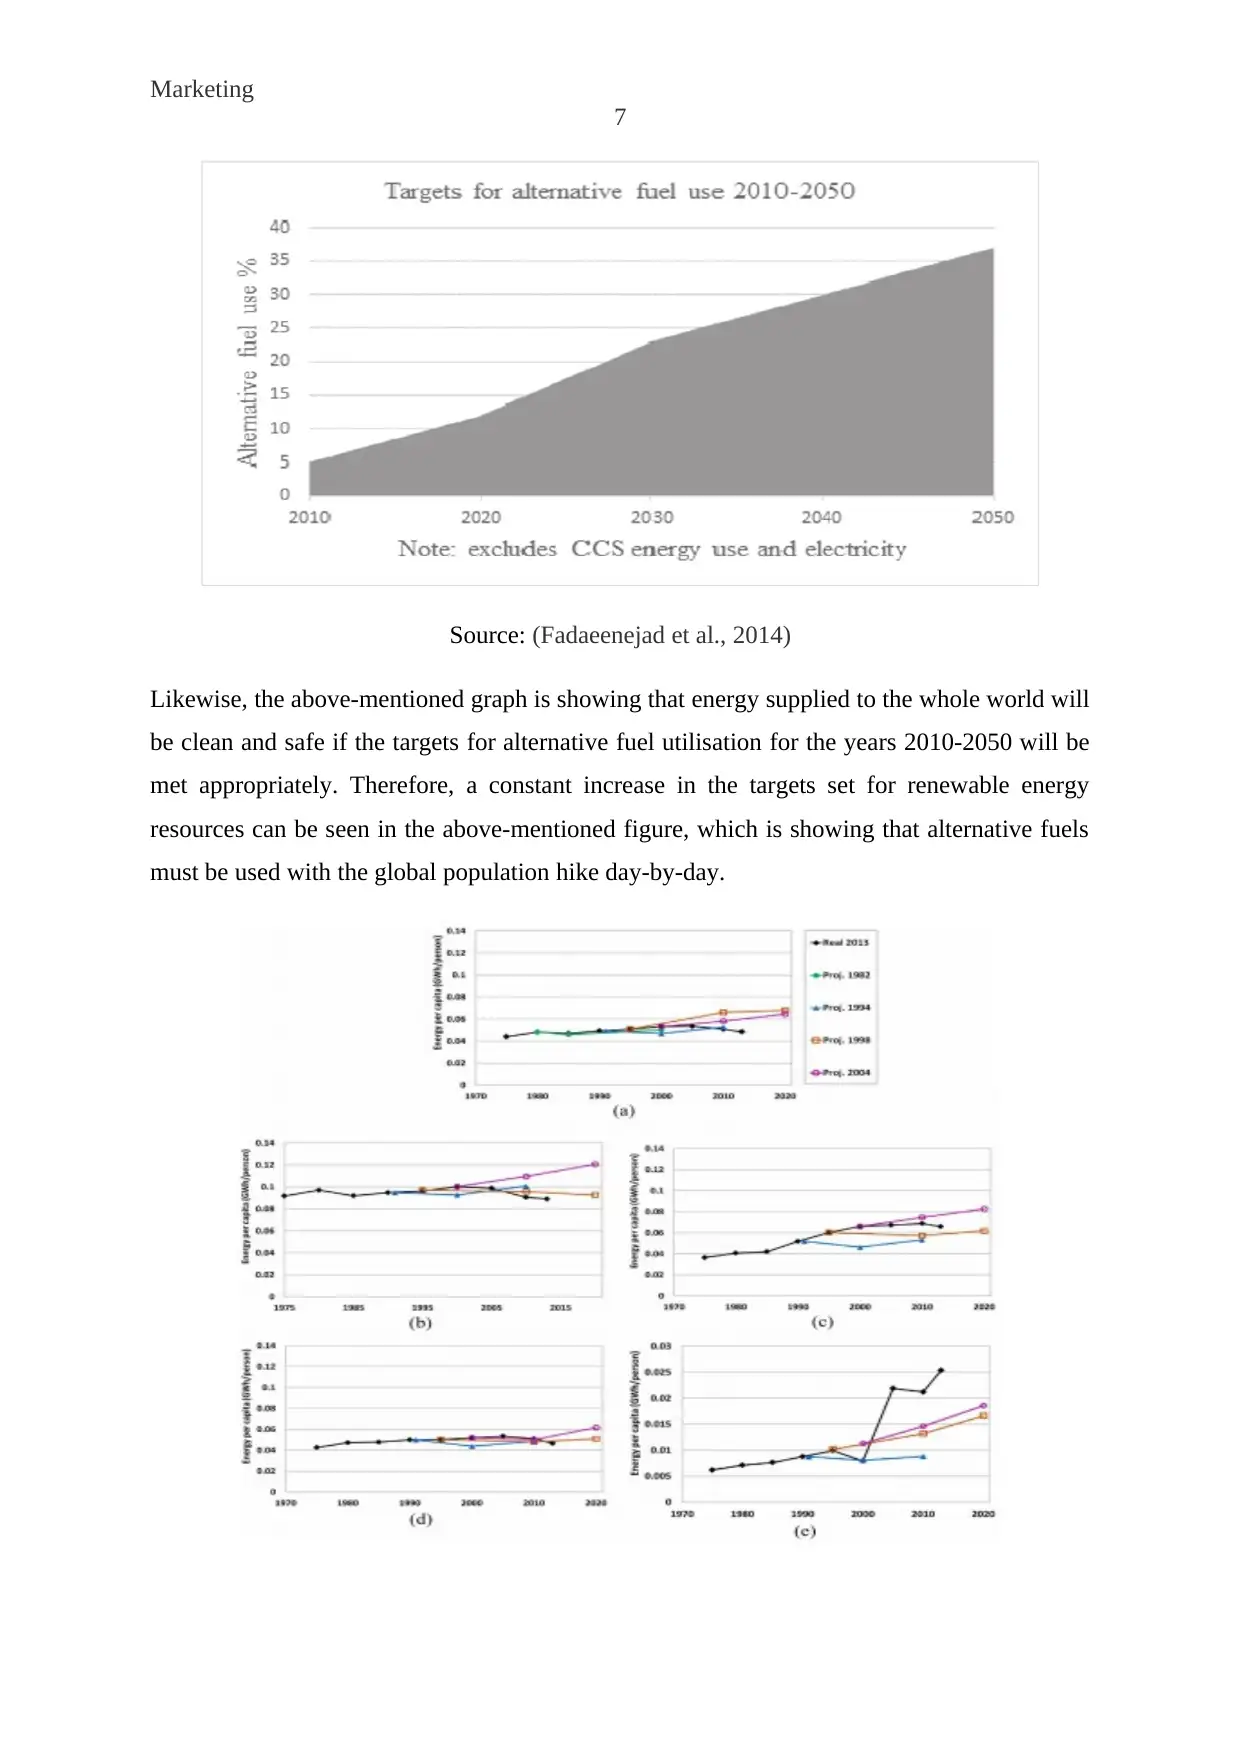
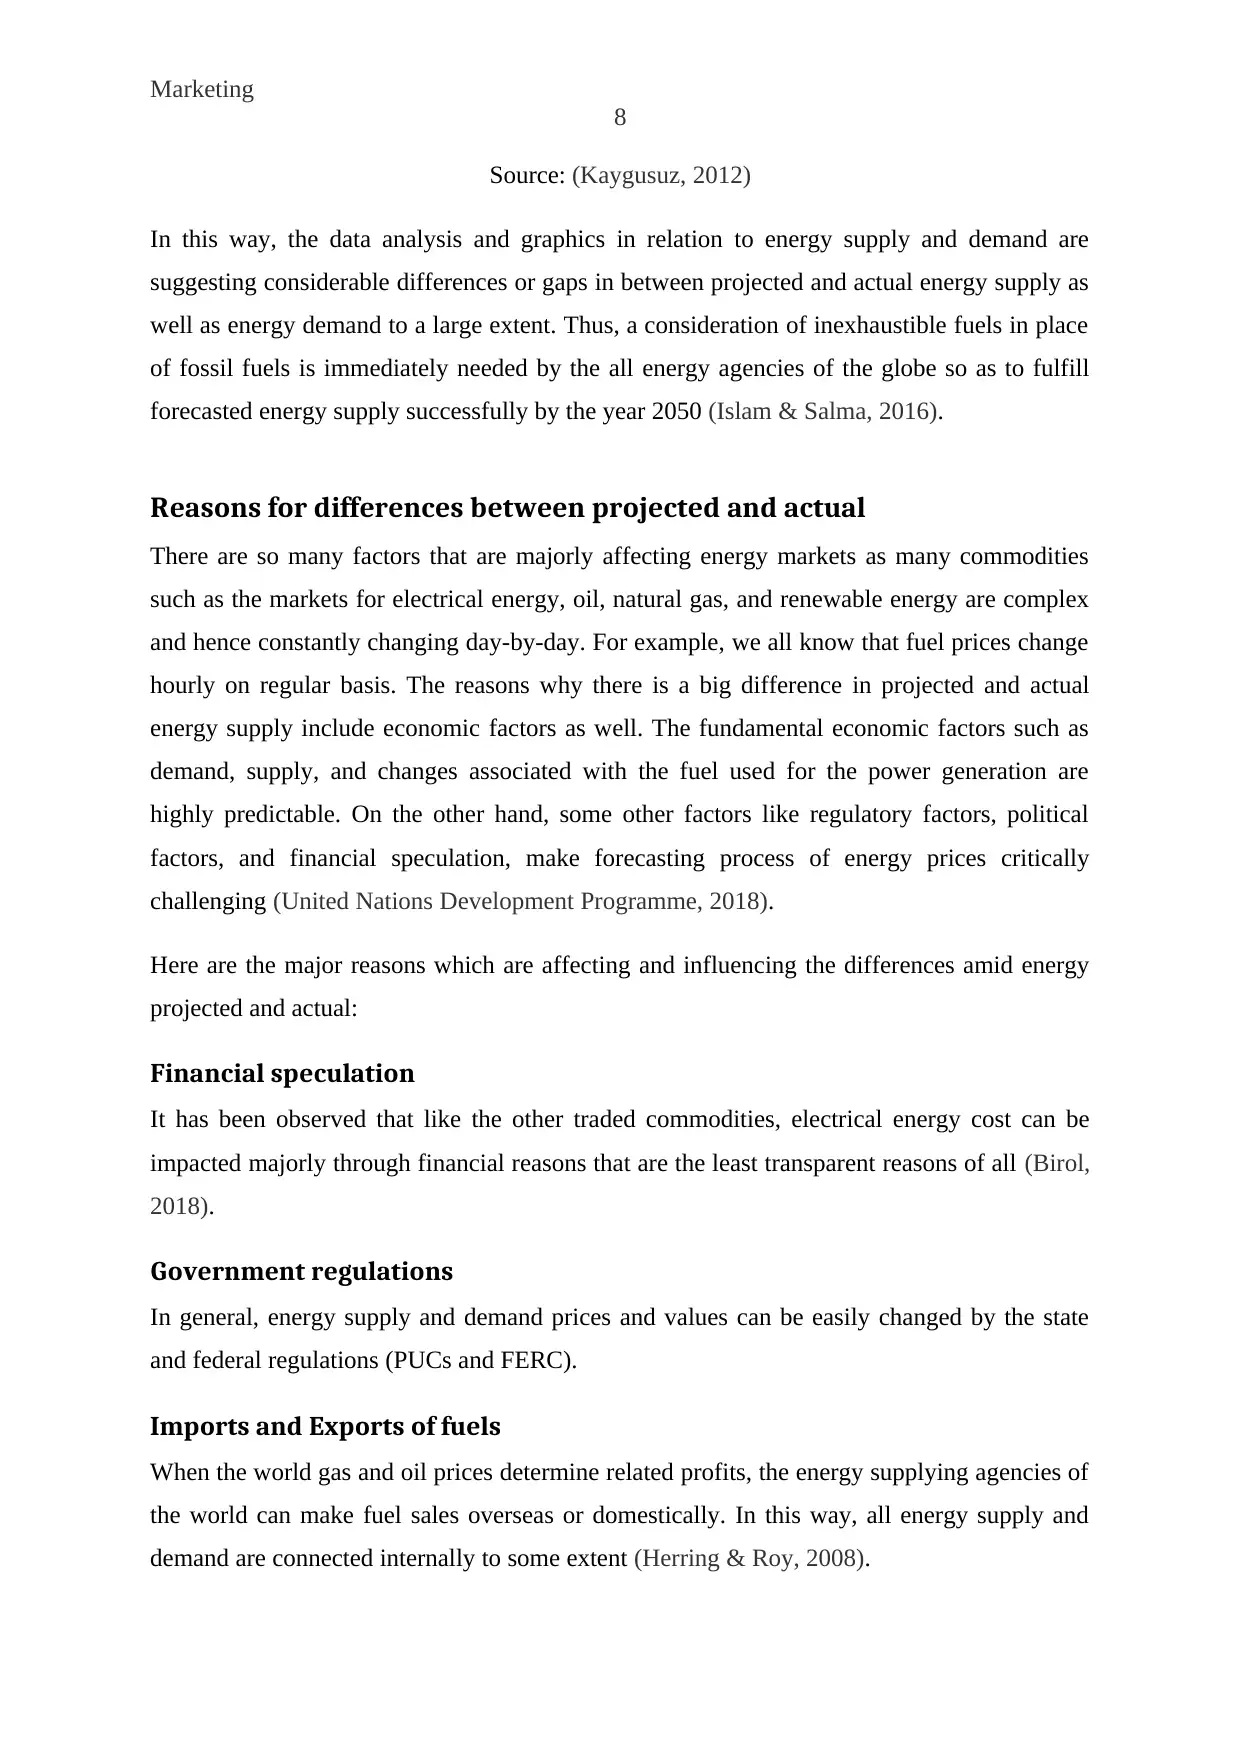
Source: (Kaygusuz, 2012)
In this way, the data analysis and graphics in relation to energy supply and demand are
suggesting considerable differences or gaps in between projected and actual energy supply as
well as energy demand to a large extent. Thus, a consideration of inexhaustible fuels in place
of fossil fuels is immediately needed by the all energy agencies of the globe so as to fulfill
forecasted energy supply successfully by the year 2050 (Islam & Salma, 2016).
Reasons for differences between projected and actual
There are so many factors that are majorly affecting energy markets as many commodities
such as the markets for electrical energy, oil, natural gas, and renewable energy are complex
and hence constantly changing day-by-day. For example, we all know that fuel prices change
hourly on regular basis. The reasons why there is a big difference in projected and actual
energy supply include economic factors as well. The fundamental economic factors such as
demand, supply, and changes associated with the fuel used for the power generation are
highly predictable. On the other hand, some other factors like regulatory factors, political
factors, and financial speculation, make forecasting process of energy prices critically
challenging (United Nations Development Programme, 2018).
Here are the major reasons which are affecting and influencing the differences amid energy
projected and actual:
Financial speculation
It has been observed that like the other traded commodities, electrical energy cost can be
impacted majorly through financial reasons that are the least transparent reasons of all (Birol,
2018).
Government regulations
In general, energy supply and demand prices and values can be easily changed by the state
and federal regulations (PUCs and FERC).
Imports and Exports of fuels
When the world gas and oil prices determine related profits, the energy supplying agencies of
the world can make fuel sales overseas or domestically. In this way, all energy supply and
demand are connected internally to some extent (Herring & Roy, 2008).
8
Source: (Kaygusuz, 2012)
In this way, the data analysis and graphics in relation to energy supply and demand are
suggesting considerable differences or gaps in between projected and actual energy supply as
well as energy demand to a large extent. Thus, a consideration of inexhaustible fuels in place
of fossil fuels is immediately needed by the all energy agencies of the globe so as to fulfill
forecasted energy supply successfully by the year 2050 (Islam & Salma, 2016).
Reasons for differences between projected and actual
There are so many factors that are majorly affecting energy markets as many commodities
such as the markets for electrical energy, oil, natural gas, and renewable energy are complex
and hence constantly changing day-by-day. For example, we all know that fuel prices change
hourly on regular basis. The reasons why there is a big difference in projected and actual
energy supply include economic factors as well. The fundamental economic factors such as
demand, supply, and changes associated with the fuel used for the power generation are
highly predictable. On the other hand, some other factors like regulatory factors, political
factors, and financial speculation, make forecasting process of energy prices critically
challenging (United Nations Development Programme, 2018).
Here are the major reasons which are affecting and influencing the differences amid energy
projected and actual:
Financial speculation
It has been observed that like the other traded commodities, electrical energy cost can be
impacted majorly through financial reasons that are the least transparent reasons of all (Birol,
2018).
Government regulations
In general, energy supply and demand prices and values can be easily changed by the state
and federal regulations (PUCs and FERC).
Imports and Exports of fuels
When the world gas and oil prices determine related profits, the energy supplying agencies of
the world can make fuel sales overseas or domestically. In this way, all energy supply and
demand are connected internally to some extent (Herring & Roy, 2008).
⊘ This is a preview!⊘
Do you want full access?
Subscribe today to unlock all pages.
Trusted by 1+ million students worldwide
Marketing
9
Global factors
The key fluctuations in world oil suppliers can considerably affect differences amid actual
and projected energy supply and demand (United Nations Development Programme, 2018).
Power generation changes
For example, there are some nuclear and coal plants which are requiring re-licensing, and
hence they are affecting the total projected and actual energy supply to the world. They are as
follows:
Coal-fired plant conversions to the natural gas plants are happening because of the need to
avert scrubbing-technology costs (Birol, 2018).
Some nuclear plants are getting retired and hence they need re-licensing
Energy losses
As we know that energy supply is usually executed after three major stages of power system
include:
Power generation
Power transmission
Power distribution
Hence, all of these power and energy-related processes of the power system face power and
energy losses while supplying power to the global customers. Thus, these power losses are
also counted as the major reason for causing differences projected and actual energy supply
to the whole world (WEC , 2017).
Conclusion
In whole, this report has talked about calculating differences amid the projected energy
supply since the year 1950 to 2050 while studying and analysing the data and graphics related
to world energy supply and demand. To do so, the data from different sources has been
collected, integrated, analysed and re-assessed for solving the problem of sustainable energy.
This report has accessed several measures of generating clean, safe and affordable energy to
supply the whole world people. In this way, the main findings are suggesting that the world
needs to generate more and more sustainable energy while replacing conventional energy
resources with non-conventional energy resources like wind, solar, geothermal and nuclear
Paraphrase This Document
Need a fresh take? Get an instant paraphrase of this document with our AI Paraphraser

Marketing
10
fusion. Moreover, some key reasons responsible for the differences amid projected and actual
energy supply have been found successfully. In a nutshell, the forecasted data can be made
real and actual data of total energy demand of the world, when the whole world’s energy
agencies will work towards achieving 17 SDGs set by United Nations with the help of
generating and supplying sustainable energy. In this way, this paper has successfully
compared past projections of total, per capita and per GDP primary and final energy
consumption in the world to historic energy demand data, while focusing over the world’s
energy data.
Marketing
11
References
Aman, S., Simmhan, Y. & Prasanna, V.K., 2013. Energy management systems: state of the
art and emerging trends. IEEE Communications Magazine, 51(1), pp.114-19.
Arto, I. et al., 2016. The energy requirements of a developed world. Energy for sustainble
development, 33, pp.1-13.
Birol, F., 2018. Energy is at the heart of the sustainable development agenda to 2030.
[Online] Available at: https://www.iea.org/newsroom/news/2018/march/energy-is-at-the-
heart-of-the-sustainable-development-agenda-to-2030.html [Accessed 26 October 2018].
Brunner, P.H. & Rechberger, H., 2015. Waste to energy–key element for sustainable waste
management. Waste Management, 37, pp.3-12.
Fadaeenejad, M. et al., 2014. The present and future of smart power grid in developing
countries. Renewable and Sustainable Energy Reviews, 29, pp.828-34.
Herring, H. & Roy, R., 2008. Technological innovation, energy efficient design and the
rebound effect. Technovation, 27(4), pp.194-203.
Hill, R., O'Keefe, P. & Snape, C., 1995. The future of energy use. london: Earthscan
Publications Ltd.
IEA, 2017. Key World Energy Statistics, International Energy Agency. [Online] Available at:
https://www.iea.org/publications/freepublications/publication/KeyWorld2017.pdf [Accessed
26 Augustus 2019].
Inderwildi, O. & King, D., 2012. Energy, Transport, & the Environment. London: Springer.
ION, D.C., 1975. Availability of World Energy Resources. London: Graham and Trotman
Ltd.
Islam, K.M.A. & Salma, U., 2016. The Renewable Energy and Sustainable Development: A
Case Study of Bangladesh. International journal of finance and banking research, 2(4),
pp.139-46.
Kaygusuz, K., 2012. Energy for sustainable development: A case of developing countries.
Renewable and Sustainable Energy Reviews, 16(2), pp.1116-26.
⊘ This is a preview!⊘
Do you want full access?
Subscribe today to unlock all pages.
Trusted by 1+ million students worldwide
1 out of 13
Related Documents


Your All-in-One AI-Powered Toolkit for Academic Success.
+13062052269
info@desklib.com
Available 24*7 on WhatsApp / Email
![[object Object]](/_next/static/media/star-bottom.7253800d.svg)
Unlock your academic potential
Copyright © 2020–2026 A2Z Services. All Rights Reserved. Developed and managed by ZUCOL.