Strategy Analysis: BCG Matrix for H&M Business Performance

Verified

Added on  2022/08/15

|5
|408
|168
Report
AI Summary
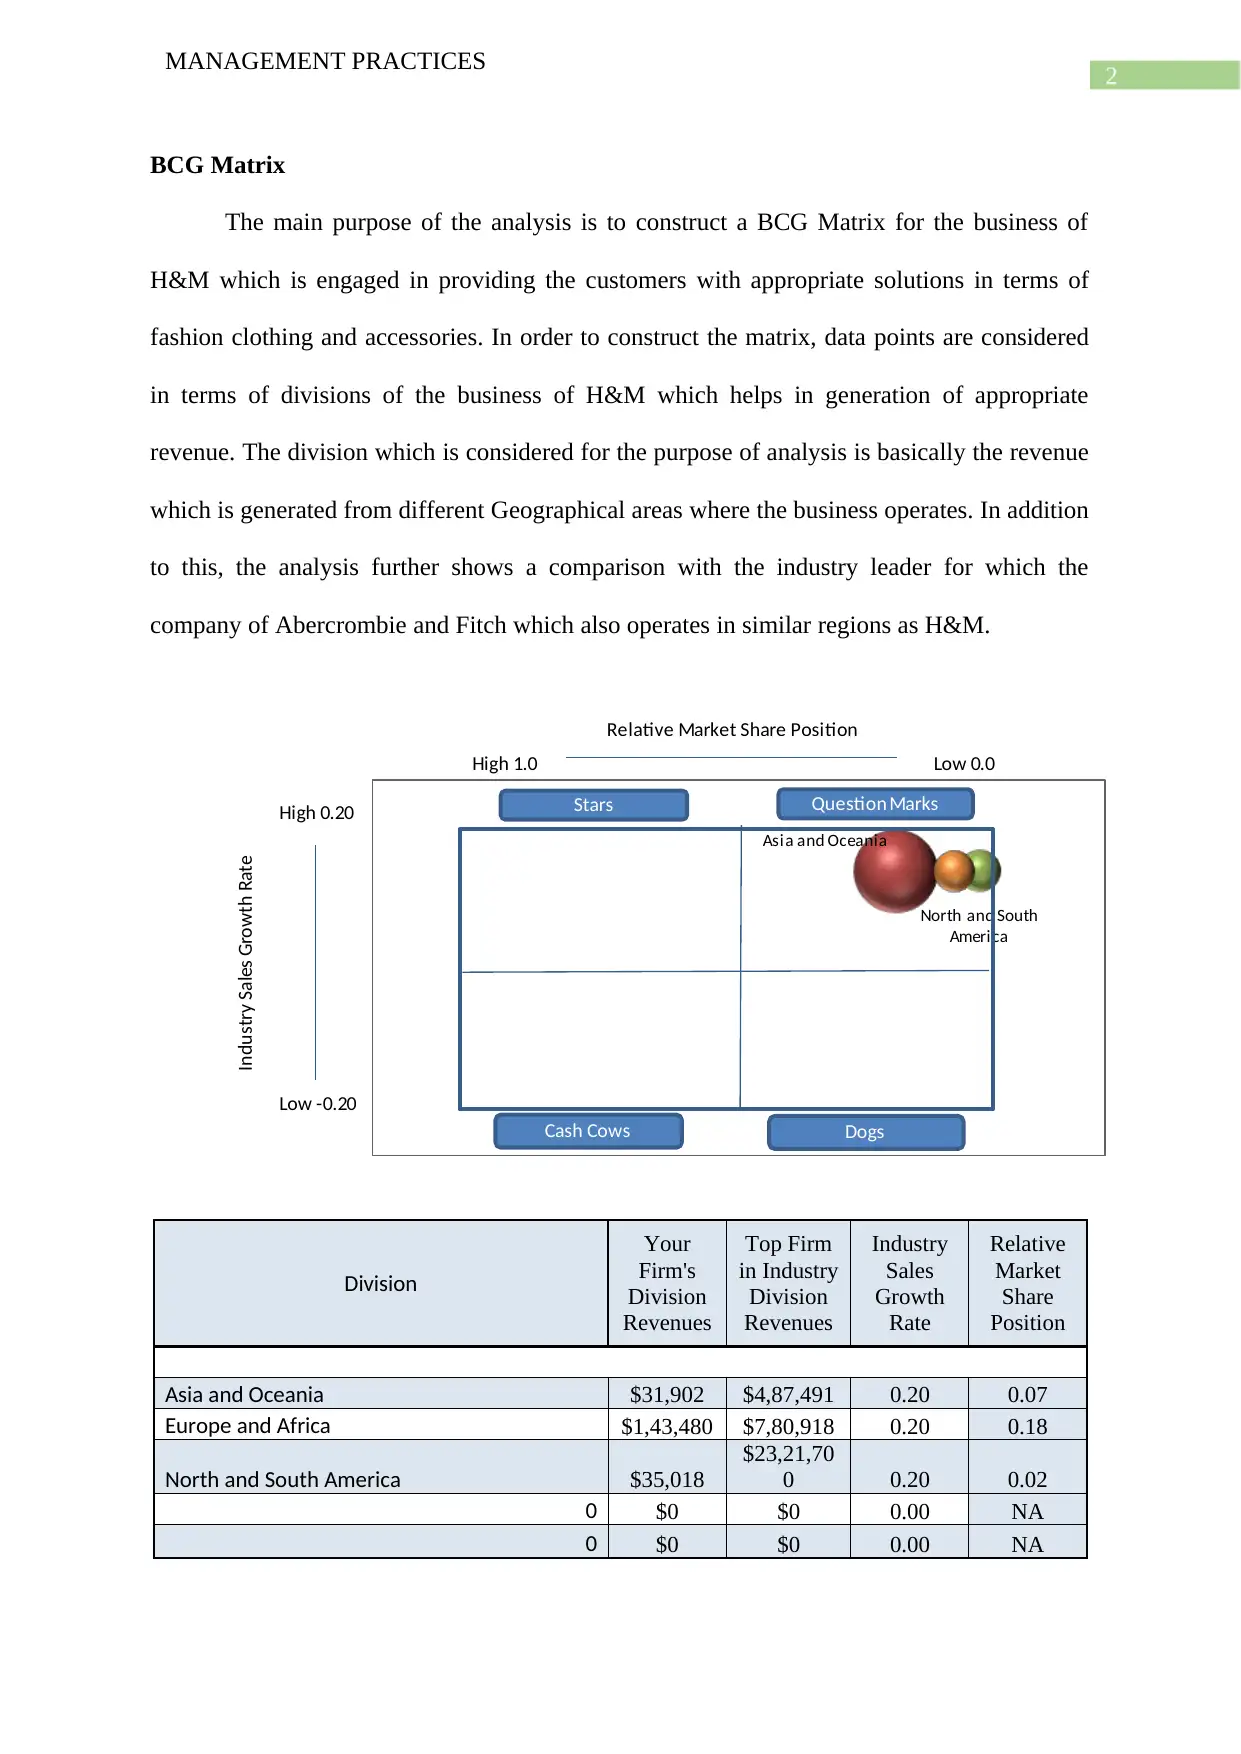
This report presents a BCG Matrix analysis for H&M, focusing on its fashion clothing and accessories business. The analysis uses divisional revenue data from different geographical areas and compares H&M's performance to the industry leader, Abercrombie & Fitch. The BCG Matrix places H&M's divisions primarily in the "question mark" quadrant, indicating potential for high growth but currently low market valuation. The report highlights the need for H&M's management to develop strategies for expanding operations and increasing profits, considering the 2% annual market growth rate. The report concludes by referencing the data sources used for the analysis, including corporate reports from H&M and Abercrombie & Fitch.
Document Page
Running head: MANAGEMENT PRACTICES
Management Practices
Name of the Student:
Name of the University:
Author’s Note:
tabler-icon-diamond-filled.svg

Paraphrase This Document

Need a fresh take? Get an instant paraphrase of this document with our AI Paraphraser
Document Page
1
MANAGEMENT PRACTICES
Table of Contents
BCG Matrix................................................................................................................................2
Bibliography...............................................................................................................................4
Document Page
2
MANAGEMENT PRACTICES
BCG Matrix
The main purpose of the analysis is to construct a BCG Matrix for the business of
H&M which is engaged in providing the customers with appropriate solutions in terms of
fashion clothing and accessories. In order to construct the matrix, data points are considered
in terms of divisions of the business of H&M which helps in generation of appropriate
revenue. The division which is considered for the purpose of analysis is basically the revenue
which is generated from different Geographical areas where the business operates. In addition
to this, the analysis further shows a comparison with the industry leader for which the
company of Abercrombie and Fitch which also operates in similar regions as H&M.
High 1.0
High 0.20
Low -0.20
Low 0.0
Industry Sales Growth Rate
Relative Market Share Position
Europe and Africa
North and South
America
Asia and Oceania
Question MarksStars
Cash Cows Dogs
Division
Your
Firm's
Division
Revenues
Top Firm
in Industry
Division
Revenues
Industry
Sales
Growth
Rate
Relative
Market
Share
Position
Asia and Oceania $31,902 $4,87,491 0.20 0.07
Europe and Africa $1,43,480 $7,80,918 0.20 0.18
North and South America $35,018
$23,21,70
0 0.20 0.02
0 $0 $0 0.00 NA
0 $0 $0 0.00 NA
Document Page
3
MANAGEMENT PRACTICES
The BCG Matrix which is prepared for H&M shows that the current level of
divisional revenue which the business is able to generate falls under the question mark
parameter which is clearly demonstrated in the chart above. The market growth rate is
considered to be 2% on an annual basis and the same is considered globally. The situation for
the business of H&M reveals that it has scope of development as the business can have a high
growth rate but at current scenario the market valuation of the business is low. In such a
situation, the management of H&M needs to formulate strategy for further expanding the
operations of the business and generating more profits.
tabler-icon-diamond-filled.svg

Paraphrase This Document

Need a fresh take? Get an instant paraphrase of this document with our AI Paraphraser
Document Page
4
MANAGEMENT PRACTICES
Bibliography
Corporate.abercrombie.com. (2020). [online] Available at:
http://corporate.abercrombie.com/investors/financials-sec-filings/annual-reports-proxy/
annual-reports [Accessed 3 Mar. 2020].
Hmgroup.com. (2020). H&M Group | Reports. [online] Available at:
https://hmgroup.com/investors/reports.html [Accessed 3 Mar. 2020].
chevron_up_icon
1 out of 5
circle_padding
hide_on_mobile
zoom_out_icon
[object Object]