Business Decision Making Report: Customer Reviews at Balti Palace HND

Verified

Added on  2023/03/30

|13
|326
|340
Report
AI Summary
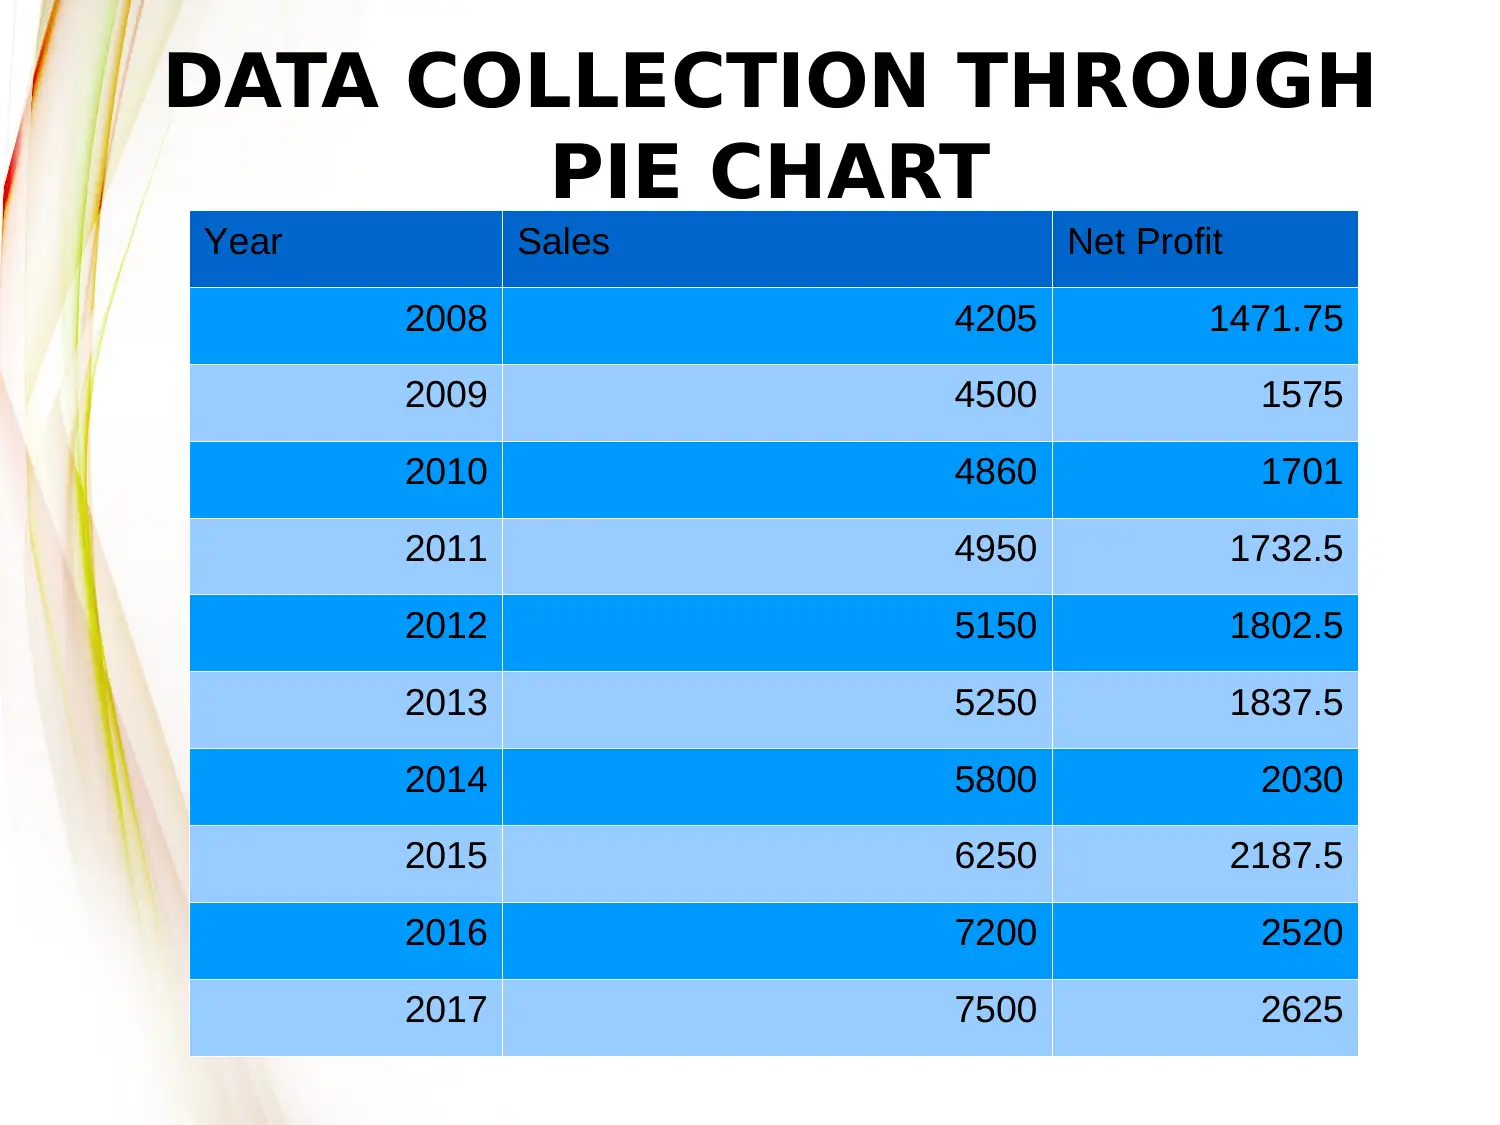
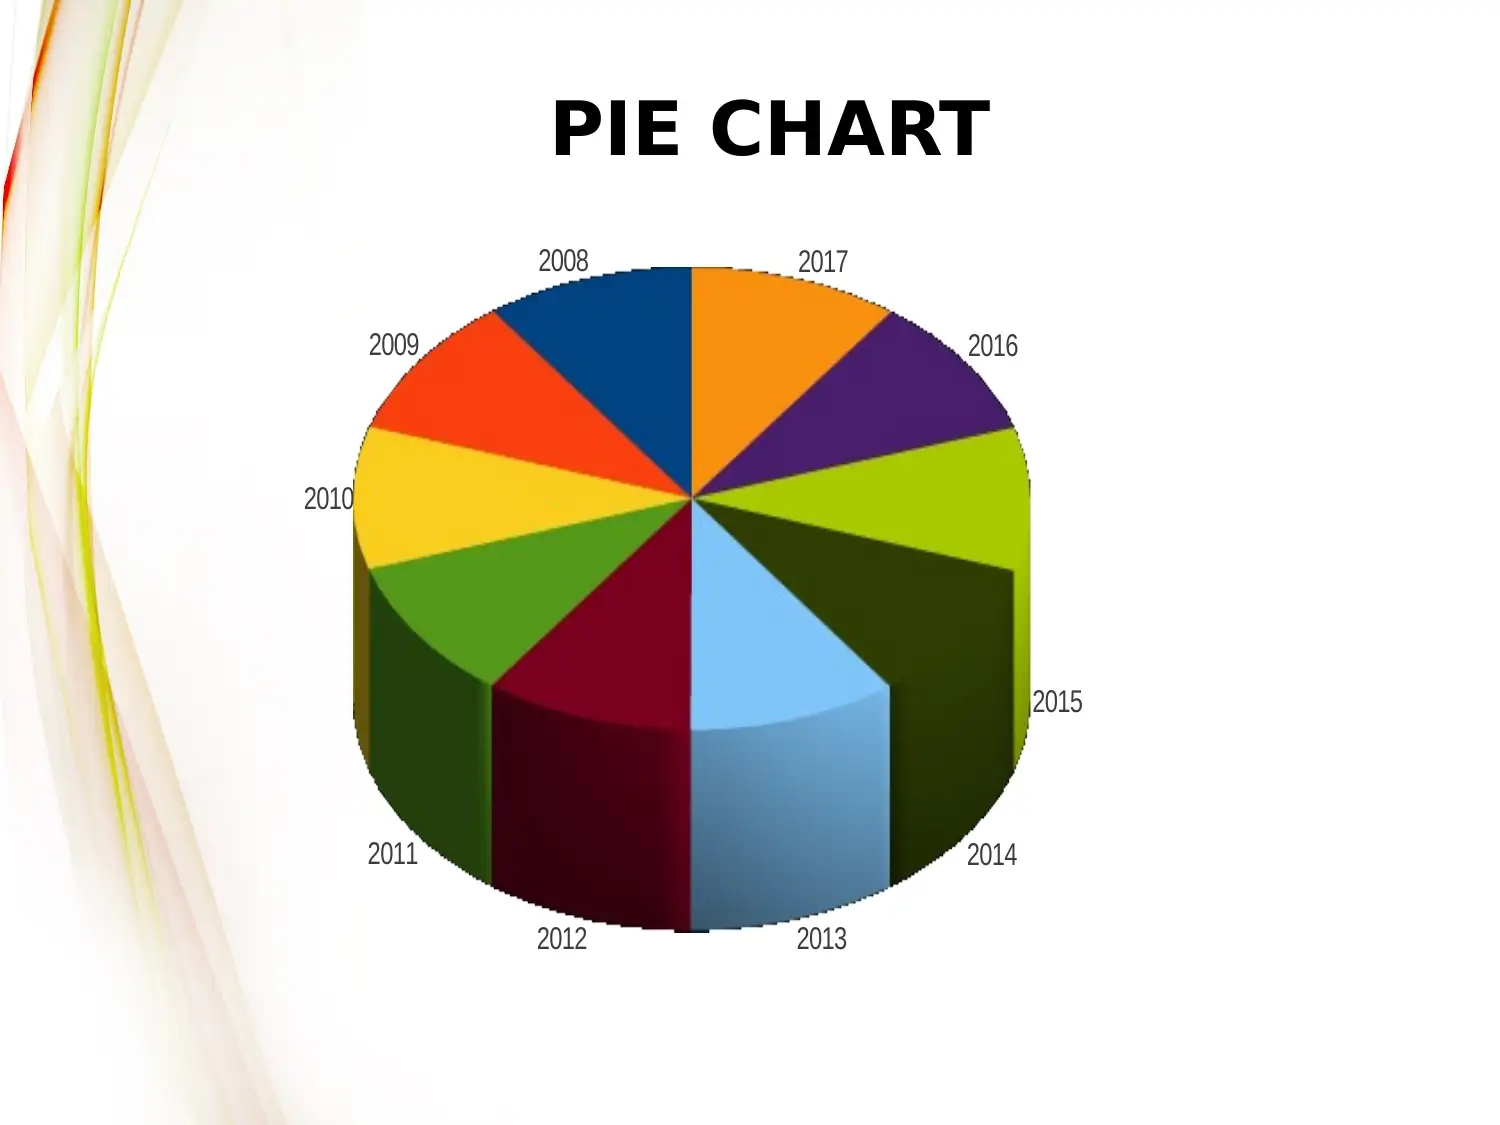
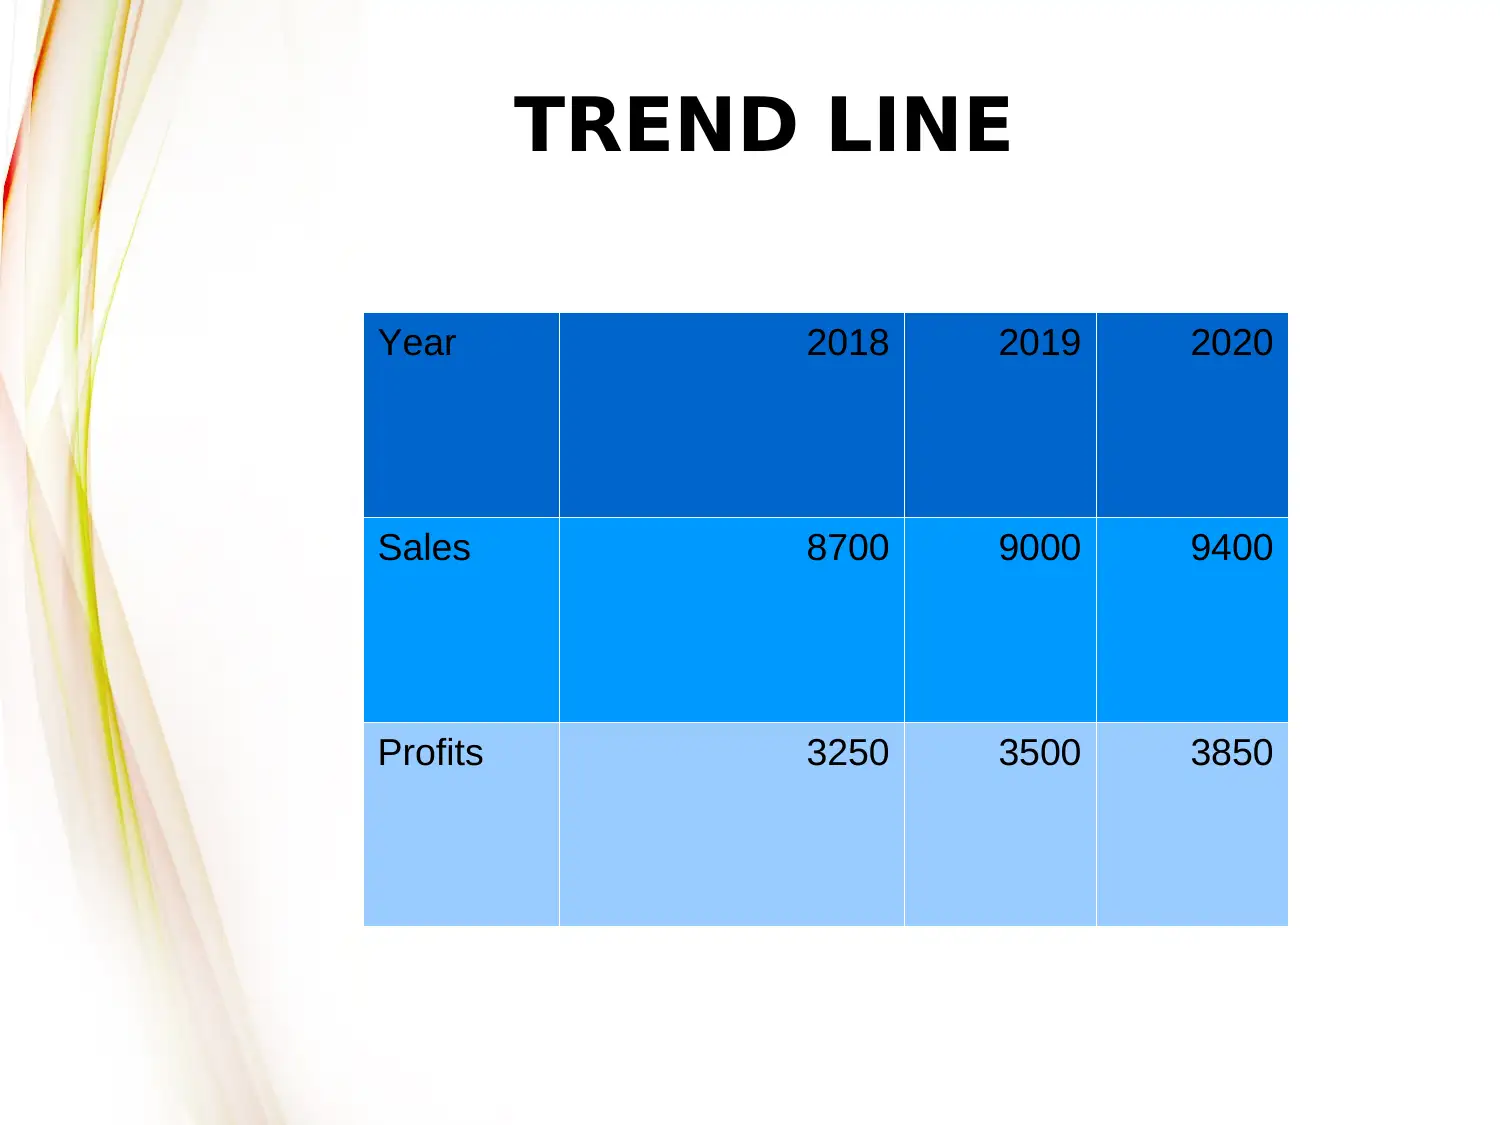
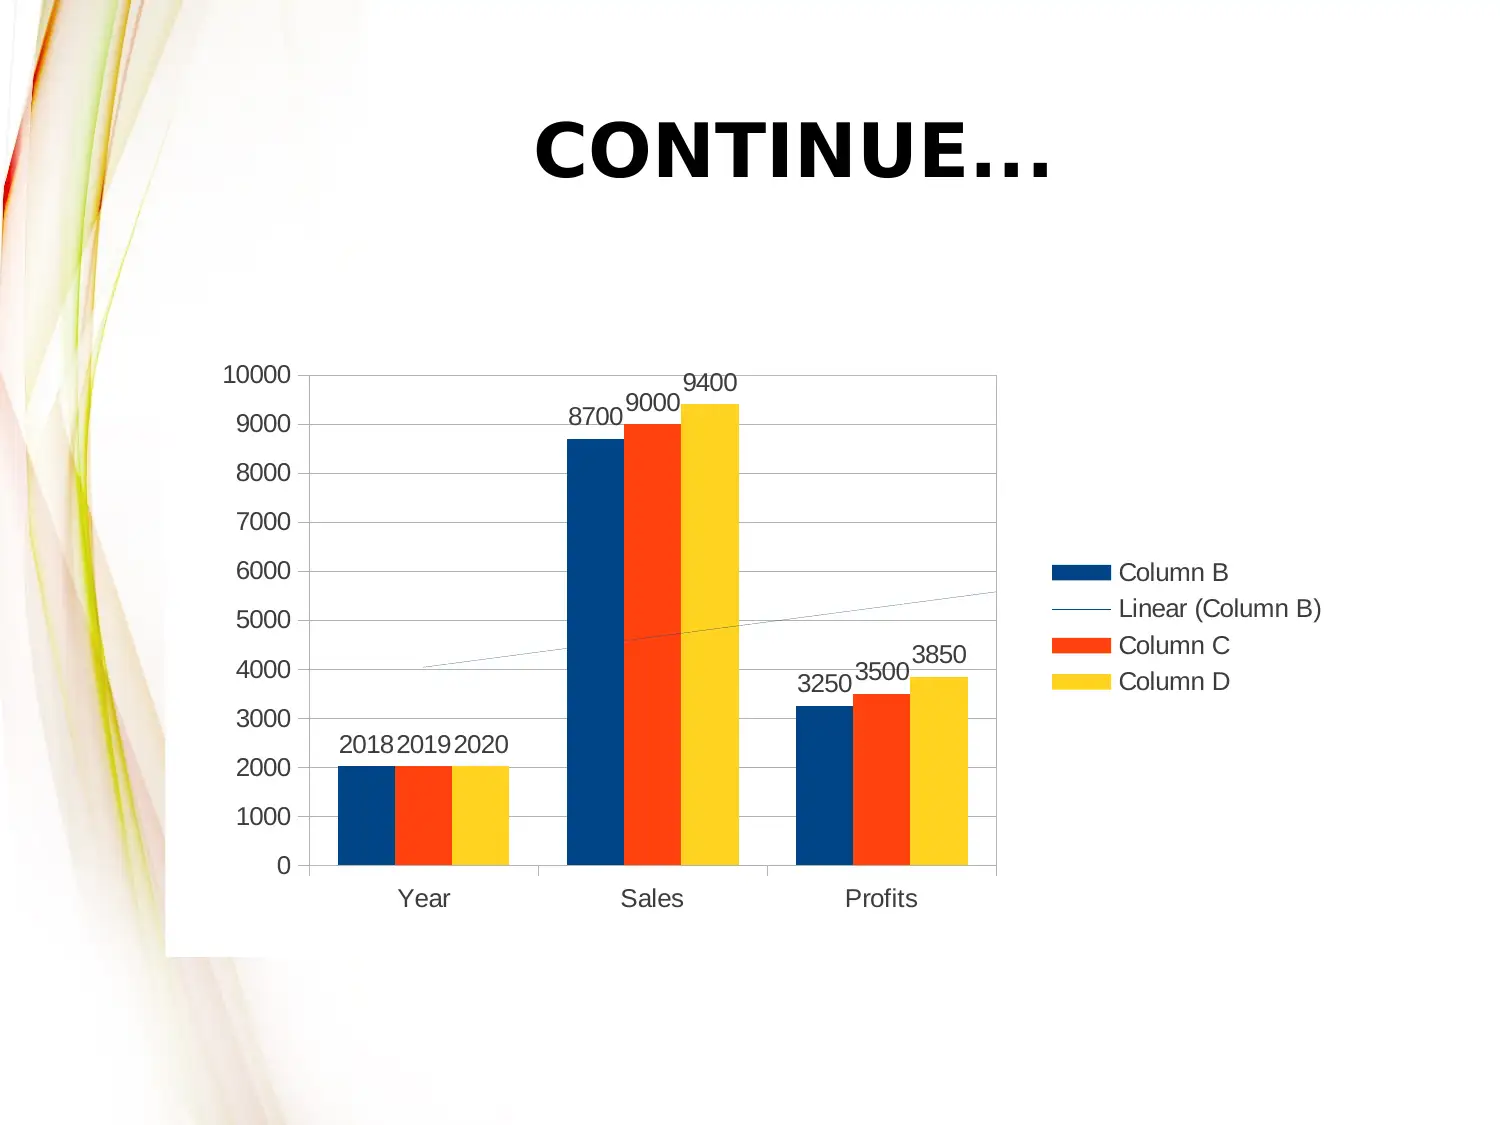
This report focuses on business decision-making using customer reviews for Balti Palace. It includes an introduction, objectives, research methodology, data collection, trend line analysis, findings, and suggestions. The research employs simple sampling to collect data, which is then interpreted and graphically represented. The data includes sales and net profit figures from 2008 to 2017, presented in a pie chart, and a trend line projects sales and profits for 2018-2020. The findings indicate variations in sales and improved profitability, along with customer satisfaction. Suggestions include improving services and adding more variety to the menu. The report references sources on social technologies and business intelligence.
Document Page
(TASK 3.3)
BUSINESS
DECISION
MAKING
tabler-icon-diamond-filled.svg

Paraphrase This Document

Need a fresh take? Get an instant paraphrase of this document with our AI Paraphraser
Document Page
COVER CONTENT
Introduction
Objectives
Research Methodology
Data Collection
Trend Line
Findings
Suggestions
References
Document Page
INTRODUCTION
Business decision making is one of the most imperative tool
which is used in the business to grow in a better manner so t
hat the firm could get the competitive advantage over the ot
her rivals.
Document Page
OBJECTIVES
The porpose of this study is to provide manageme
nt of Balti palace about the reviews of their cousto
mers so that they can make changes accordingly.
tabler-icon-diamond-filled.svg

Paraphrase This Document

Need a fresh take? Get an instant paraphrase of this document with our AI Paraphraser
Document Page
RESEARCH METHODOLOGY
Simple sampling is conducted so that
accordingly research data can be collected.
Collected data helps in making the
interpretations to the organisation.
Graphical representation of survey is done
which gives comparative results.
Document Page
DATA COLLECTION THROUGH
PIE CHART
Year Sales Net Profit
2008 4205 1471.75
2009 4500 1575
2010 4860 1701
2011 4950 1732.5
2012 5150 1802.5
2013 5250 1837.5
2014 5800 2030
2015 6250 2187.5
2016 7200 2520
2017 7500 2625
Document Page
PIE CHART
2008
2009
2010
2011
2012 2013
2014
2015
2016
2017
tabler-icon-diamond-filled.svg

Paraphrase This Document

Need a fresh take? Get an instant paraphrase of this document with our AI Paraphraser
Document Page
TREND LINE
Year 2018 2019 2020
Sales 8700 9000 9400
Profits 3250 3500 3850
Document Page
CONTINUE...
Year Sales Profits
0
1000
2000
3000
4000
5000
6000
7000
8000
9000
10000
2018
8700
3250
2019
9000
3500
2020
9400
3850
Column B
Linear (Column B)
Column C
Column D
Document Page
FINDINGS
Variations are observed in the total sales. .
Profitability has raised to a good level after 20
08.
Coustomers satisfaction is observed as conclu
ded from the survey.
tabler-icon-diamond-filled.svg

Paraphrase This Document

Need a fresh take? Get an instant paraphrase of this document with our AI Paraphraser
Document Page
SUGGESTIONS
Management need to work on its servises so t
hat more clients are made satisfied.
More variety of cousins can be added to provi
de more variety to the clients.
Document Page
REFERENCES
Li, C., 2010. Groundswell. Winning in a
world transformed by social
technologies. Strategic Direction. 26(8).
Vercellis, C., 2011. Business intelligence:
data mining and optimization for
decision making. John Wiley & Sons.
chevron_up_icon
1 out of 13
circle_padding
hide_on_mobile
zoom_out_icon
[object Object]