Analysis of Holden Commodore Prices in Queensland - Statistics Course

Verified

Added on  2020/04/13

|4
|596
|221
Homework Assignment
AI Summary
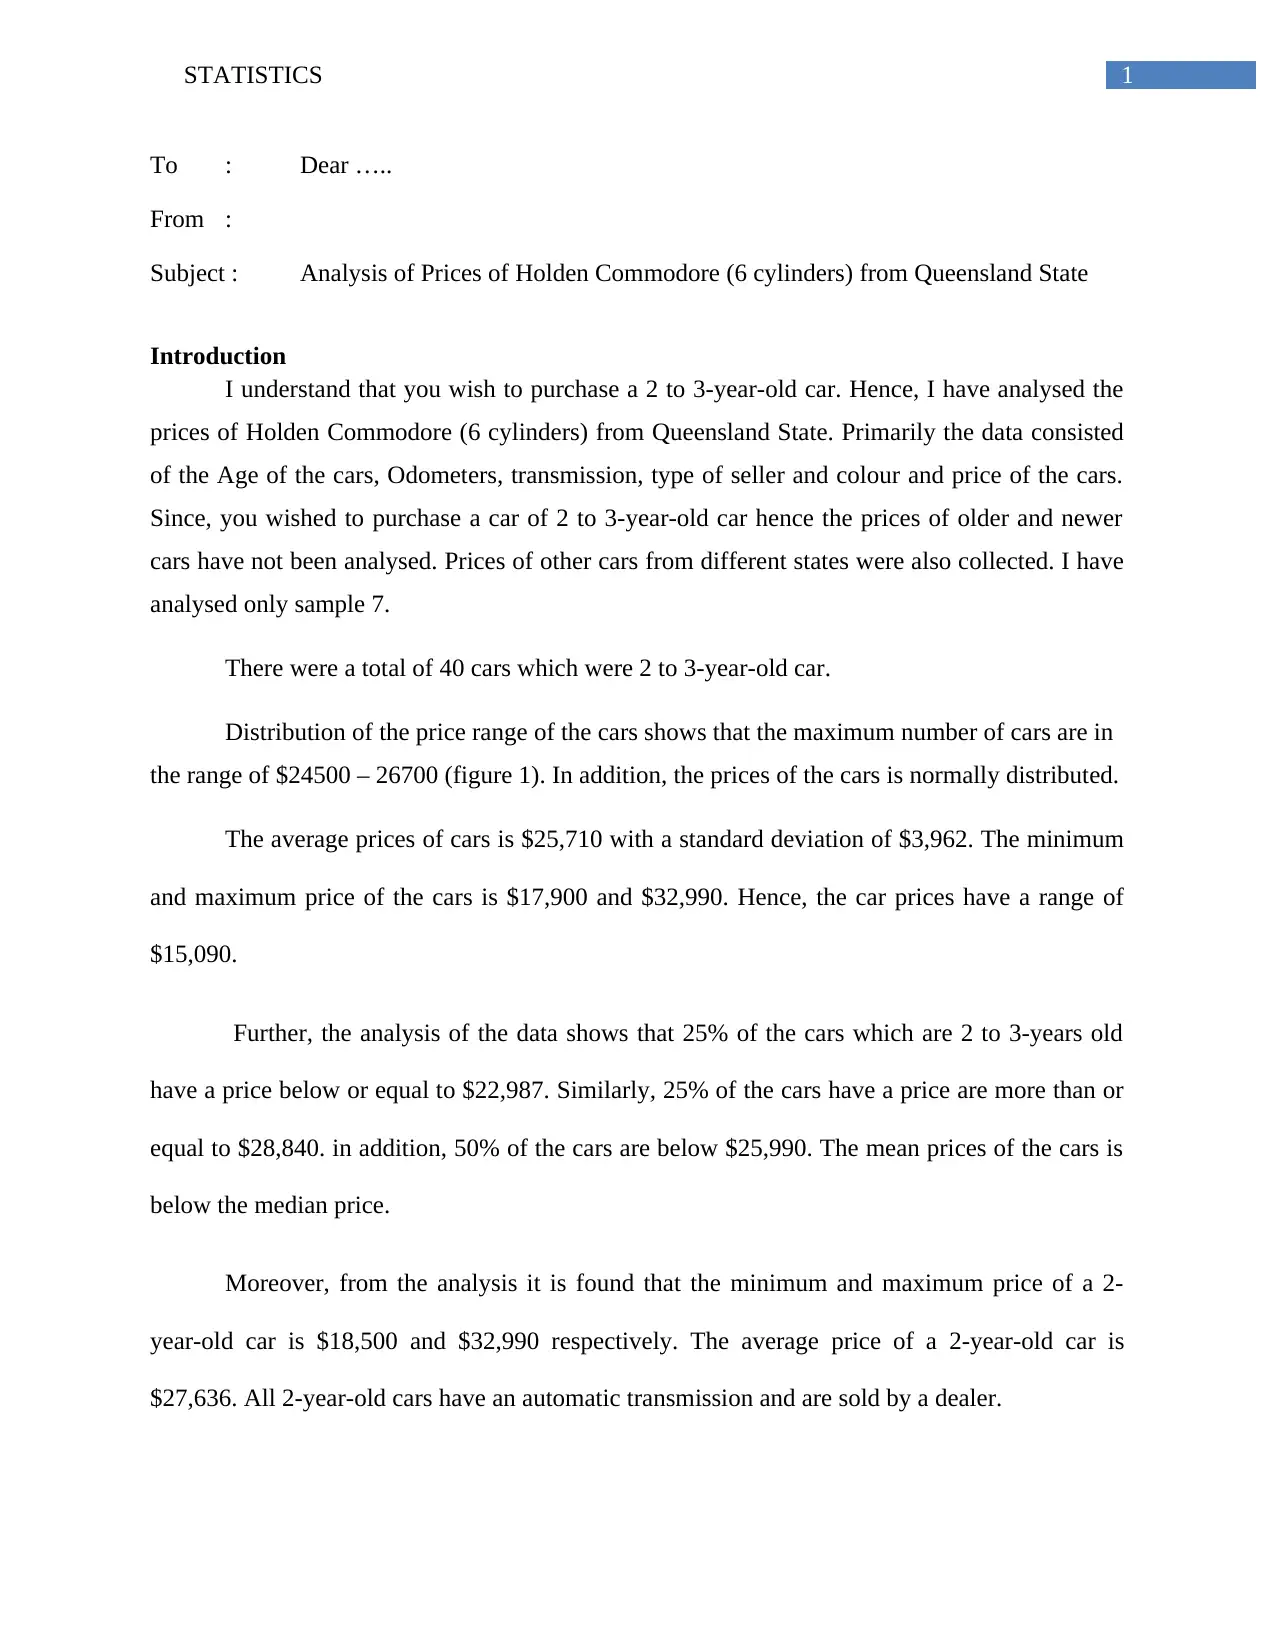
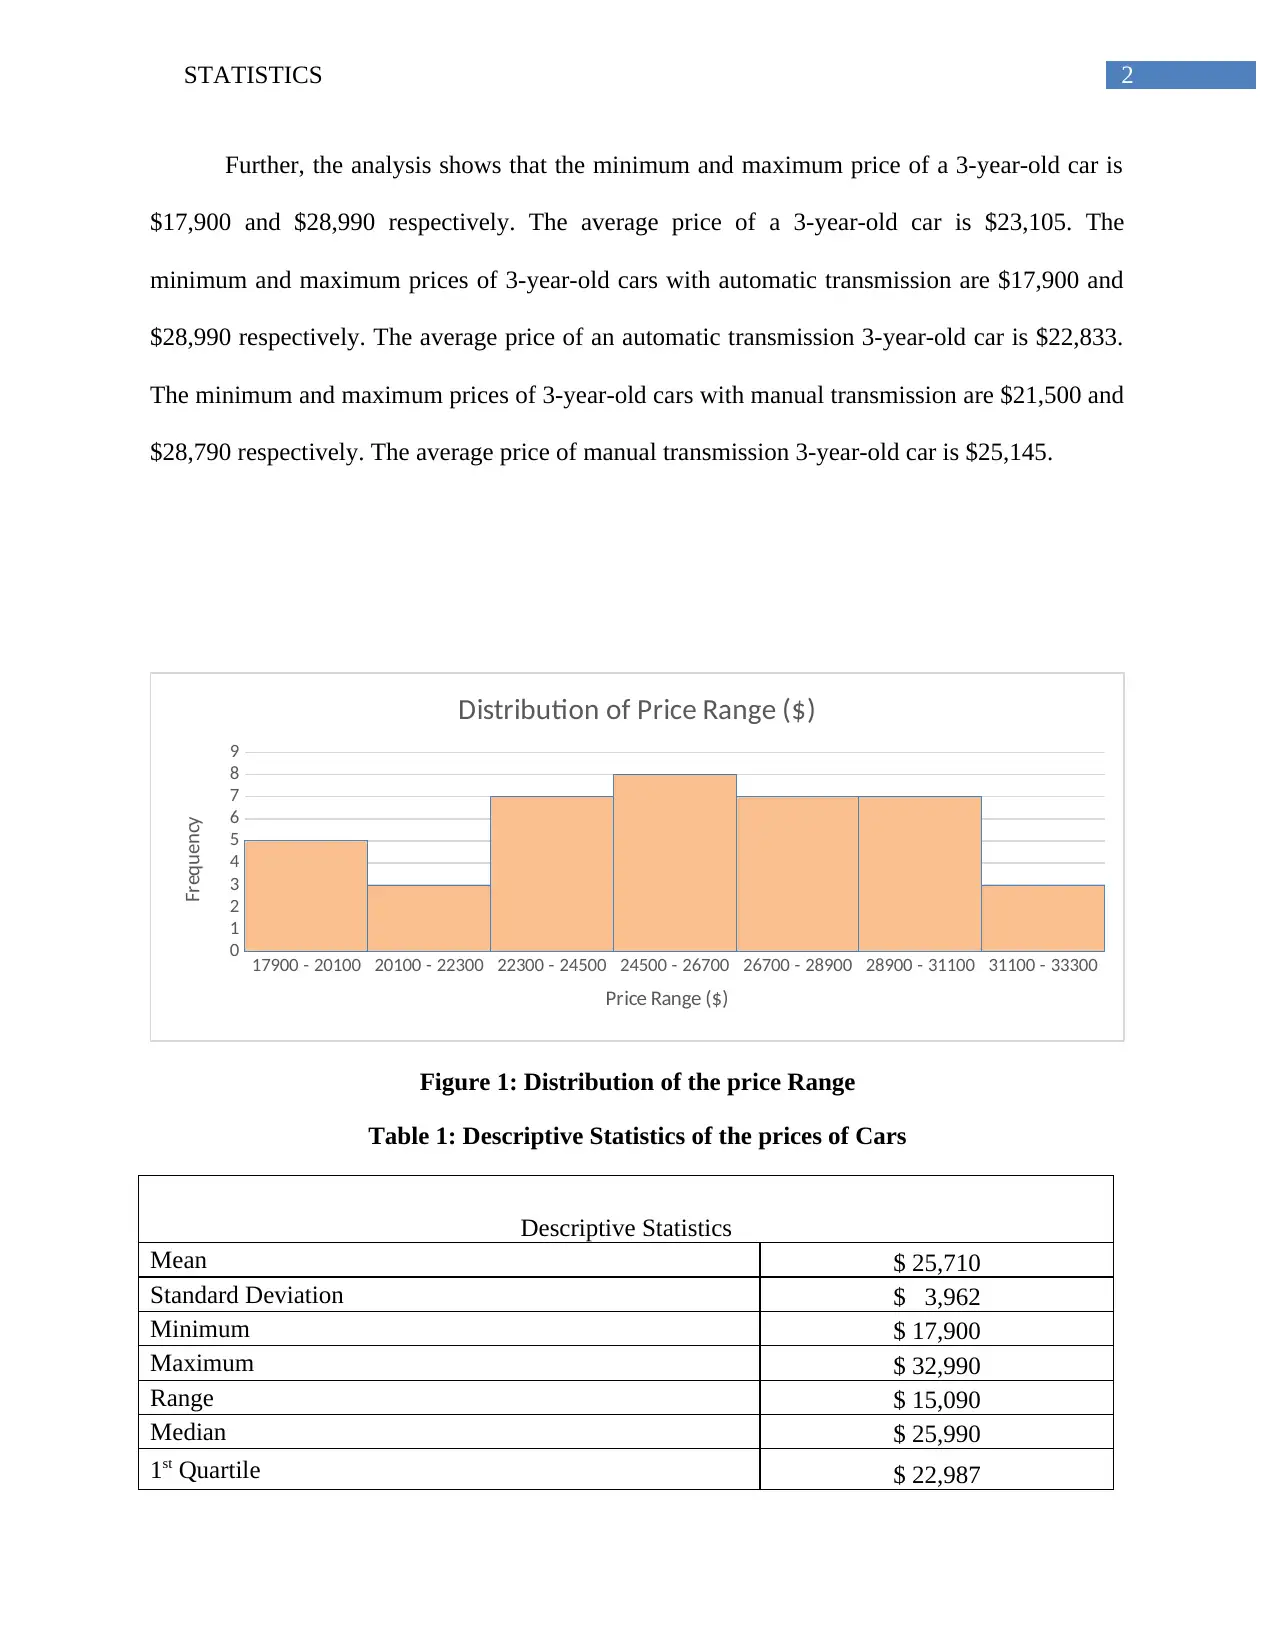
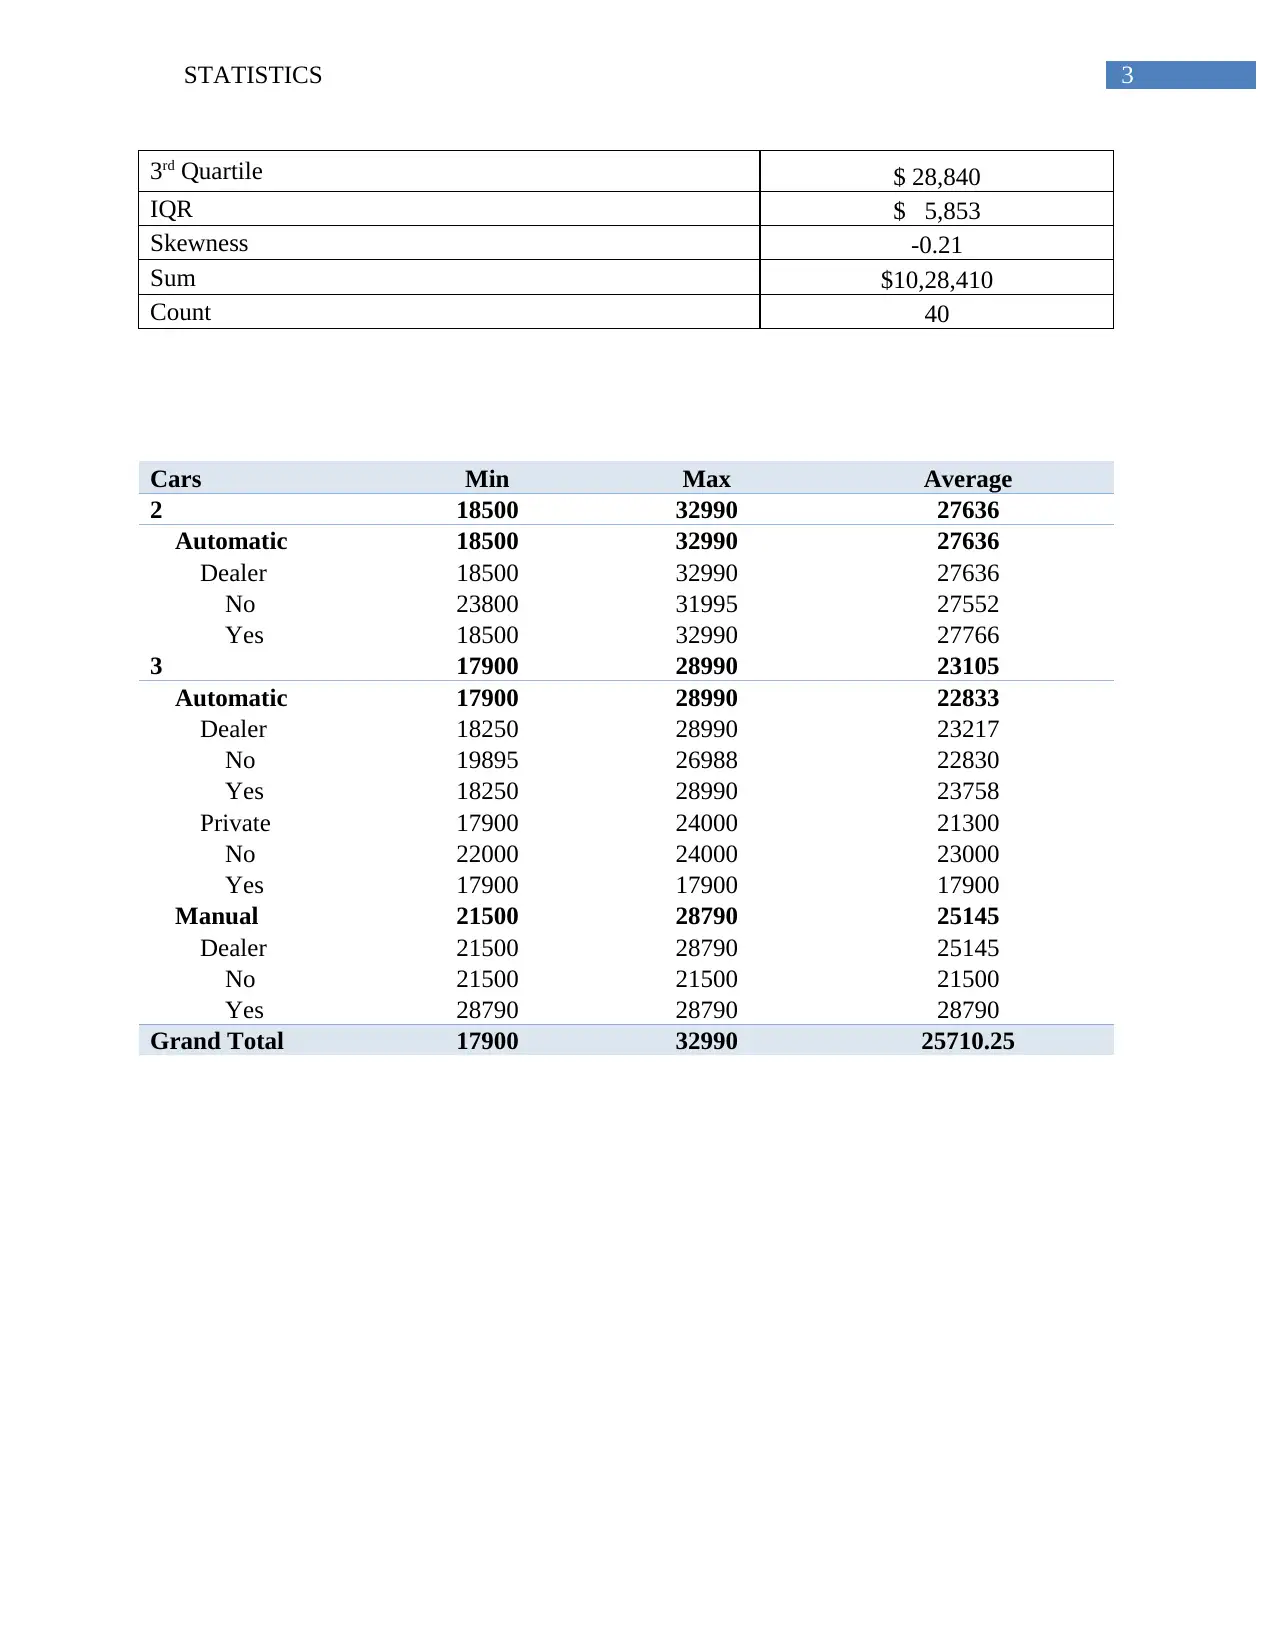
The assignment presents a statistical examination of Holden Commodore car prices within Queensland for vehicles aged between two to three years. The dataset includes various parameters such as the cars' age, state of origin, and type of transmission. A total of 40 cars were analyzed with findings that indicated the predominant price range was $24,500 - $26,700. The data was observed to have a normal distribution, where the mean price stood at $25,710, and the standard deviation was recorded as $3,962. Price ranges varied from a minimum of $17,900 to a maximum of $32,990 with a median value of $25,990. Further analysis showed that for 2-year-old cars, all had automatic transmission sold by dealers with an average price of $27,636, whereas 3-year-old cars exhibited different pricing based on transmission types: automatics averaged at $22,833 while manuals were higher at $25,145. The study also explored the skewness and interquartile range (IQR) of car prices to provide a comprehensive understanding of market trends for this segment.
Document Page
Running Head: STATISTICS
Statistics
Name of the student
Name of the university
Author’s note
tabler-icon-diamond-filled.svg

Paraphrase This Document

Need a fresh take? Get an instant paraphrase of this document with our AI Paraphraser
Document Page
1STATISTICS
To : Dear …..
From :
Subject : Analysis of Prices of Holden Commodore (6 cylinders) from Queensland State
Introduction
I understand that you wish to purchase a 2 to 3-year-old car. Hence, I have analysed the
prices of Holden Commodore (6 cylinders) from Queensland State. Primarily the data consisted
of the Age of the cars, Odometers, transmission, type of seller and colour and price of the cars.
Since, you wished to purchase a car of 2 to 3-year-old car hence the prices of older and newer
cars have not been analysed. Prices of other cars from different states were also collected. I have
analysed only sample 7.
There were a total of 40 cars which were 2 to 3-year-old car.
Distribution of the price range of the cars shows that the maximum number of cars are in
the range of $24500 – 26700 (figure 1). In addition, the prices of the cars is normally distributed.
The average prices of cars is $25,710 with a standard deviation of $3,962. The minimum
and maximum price of the cars is $17,900 and $32,990. Hence, the car prices have a range of
$15,090.
Further, the analysis of the data shows that 25% of the cars which are 2 to 3-years old
have a price below or equal to $22,987. Similarly, 25% of the cars have a price are more than or
equal to $28,840. in addition, 50% of the cars are below $25,990. The mean prices of the cars is
below the median price.
Moreover, from the analysis it is found that the minimum and maximum price of a 2-
year-old car is $18,500 and $32,990 respectively. The average price of a 2-year-old car is
$27,636. All 2-year-old cars have an automatic transmission and are sold by a dealer.
Document Page
2STATISTICS
Further, the analysis shows that the minimum and maximum price of a 3-year-old car is
$17,900 and $28,990 respectively. The average price of a 3-year-old car is $23,105. The
minimum and maximum prices of 3-year-old cars with automatic transmission are $17,900 and
$28,990 respectively. The average price of an automatic transmission 3-year-old car is $22,833.
The minimum and maximum prices of 3-year-old cars with manual transmission are $21,500 and
$28,790 respectively. The average price of manual transmission 3-year-old car is $25,145.
17900 - 20100 20100 - 22300 22300 - 24500 24500 - 26700 26700 - 28900 28900 - 31100 31100 - 33300
0
1
2
3
4
5
6
7
8
9
Distribution of Price Range ($)
Price Range ($)
Frequency
Figure 1: Distribution of the price Range
Table 1: Descriptive Statistics of the prices of Cars
Descriptive Statistics
Mean $ 25,710
Standard Deviation $ 3,962
Minimum $ 17,900
Maximum $ 32,990
Range $ 15,090
Median $ 25,990
1st Quartile $ 22,987
Document Page
3STATISTICS
3rd Quartile $ 28,840
IQR $ 5,853
Skewness -0.21
Sum $10,28,410
Count 40
Cars Min Max Average
2 18500 32990 27636
Automatic 18500 32990 27636
Dealer 18500 32990 27636
No 23800 31995 27552
Yes 18500 32990 27766
3 17900 28990 23105
Automatic 17900 28990 22833
Dealer 18250 28990 23217
No 19895 26988 22830
Yes 18250 28990 23758
Private 17900 24000 21300
No 22000 24000 23000
Yes 17900 17900 17900
Manual 21500 28790 25145
Dealer 21500 28790 25145
No 21500 21500 21500
Yes 28790 28790 28790
Grand Total 17900 32990 25710.25
chevron_up_icon
1 out of 4
circle_padding
hide_on_mobile
zoom_out_icon
[object Object]