Finance Report: Holiday Inn - New Business Finance and Budgets
VerifiedAdded on 2021/02/21
|14
|3011
|25
Report
AI Summary
This report, prepared for the Finance Manager at Holiday Inn, comprehensively addresses the financial aspects of establishing and running a new business. It begins by outlining various sources of initial and ongoing finance, including personal investment, love money, venture capital, bank loans, and equity share capital. The report then explores sources of financial advice and guidance, such as the National Business Support Helpline and Tech City UK programs. A key component is a detailed 12-month cash flow forecast, projecting revenue, cost of goods sold, and expenses. Additionally, the report discusses the purpose of budgets and the creation of affordable budget plans. Finally, it presents a set of final accounts, including a profit and loss account and balance sheet, providing a complete financial overview for the new business.

Finance For a New
Business
Business
Paraphrase This Document
Need a fresh take? Get an instant paraphrase of this document with our AI Paraphraser
Table of Contents
INTRODUCTION...........................................................................................................................1
TASK 1............................................................................................................................................1
A) Sources of Initial Finance Needed to Setup New Business...................................................1
B) Sources of Finance Needed to Run Business.........................................................................1
TASK 2............................................................................................................................................2
A) Sources of financial advice and guidance.............................................................................2
TASK 3............................................................................................................................................3
a) 12 month cash flow forecast...................................................................................................3
TASK 4............................................................................................................................................3
a) Purpose of budgets.................................................................................................................3
b) Affordable budgets plan.........................................................................................................3
TASK 5............................................................................................................................................3
A) Set of final accounts..............................................................................................................3
CONCLUSION ...............................................................................................................................3
REFERENCES ...............................................................................................................................5
INTRODUCTION
Sources of Finance refers to those sources with the help of which funds are collected
from different sources in order to accomplish different functions of the business (Grammenos,
2013). The following report is prepared to present in front of Finance Manager in Holiday Inn.
The following report will make its focus on sources of initial finance needed in setting up and
running a new business. Additionally, it will focus on sources of financial advise and guidance
available to companies, 12 month cash flow, purposes of budgets for new business along with
preparing affordable plans for business as well. Lastly, financial accounts will be prepared with
the help of accounting systems.
TASK 1
A) Sources of Initial Finance Needed to Setup New Business
There are different ways with the help of which finance could be acquired by an
individual or group of individuals at the time of starting new business. The description of these
sources is provided as under:
Personal Investment
The first option which is available to an individual in order to start new business is with
the help of personal investment or the money which an individual have. Another option is also
collateral of assets is also available with people so tart new business (Galí, 2015).
Love Money
In the following option, the amount in order to start new business is acquired from
family, spouse, friends or relatives. So by taking money from these people, new business could
be started and carried over.
Venture Capital
It refers to that capital which an individual receives in exchange of equity of their
business. However, this capital is very risky in comparison to other modes of capital because the
use of this form of finance will impact upon the ownership and decision making process of the
organisation.
B) Sources of Finance Needed to Run Business
Bank Loan
1
⊘ This is a preview!⊘
Do you want full access?
Subscribe today to unlock all pages.
Trusted by 1+ million students worldwide
In the following source of funding, the capital in order to run the business is raised with
the help of getting financed from banks. Loans are taken from banks for both long term and short
terms and companies may take on the basis of their needs.
Equity Share Capital
The second option in order to run a business is with the help of equity share capital in
which an organisation issues shares to people and receives amount from them. However,
shareholders have the right to participate and influence the decision making process of the
company which will make it complex for the owner to make effective running of the business
(Hamilton and Raj, 2013).
TASK 2
A) Sources of financial advice and guidance.
In business world, starting and building a new business is not an easy task, thus it is
important for entrepreneur to have sufficient information and guidance that are available from
different sources. Some of these are discussed below:
National business support helpline: It one of the key element developed by the
government of UK that directly support business to gain enough knowledge regarding,
signposting, diagnostic support and business improvement guidance. The interested parties can
call to get in depth advices about the latest trends, market risk, government rules and regulation
which help them to manage their business activities in appropriate manner.
Tech City UK programmes: This particular program have a range of online services
that are designed for sustainable growth of small businesses. New start-up can gain knowledge
and advices from online courses and events in order to develop business by reducing the risk
factors. In recent time most of the successful small starts ups are taking advantage from Tech
city.
Count the cost: In present time companies are focused to reduce cost and expenses to
increase profit. Small business can gain obtain the advice and support from large enterprise how
to reduce cost that enables to maintain sufficient profit (Mazzucato and Penna, 2015.). It is
important for new business to look into the cost that can lead to major expenses such as rents,
utility, supplies and marketing.
2
Paraphrase This Document
Need a fresh take? Get an instant paraphrase of this document with our AI Paraphraser
TASK 3
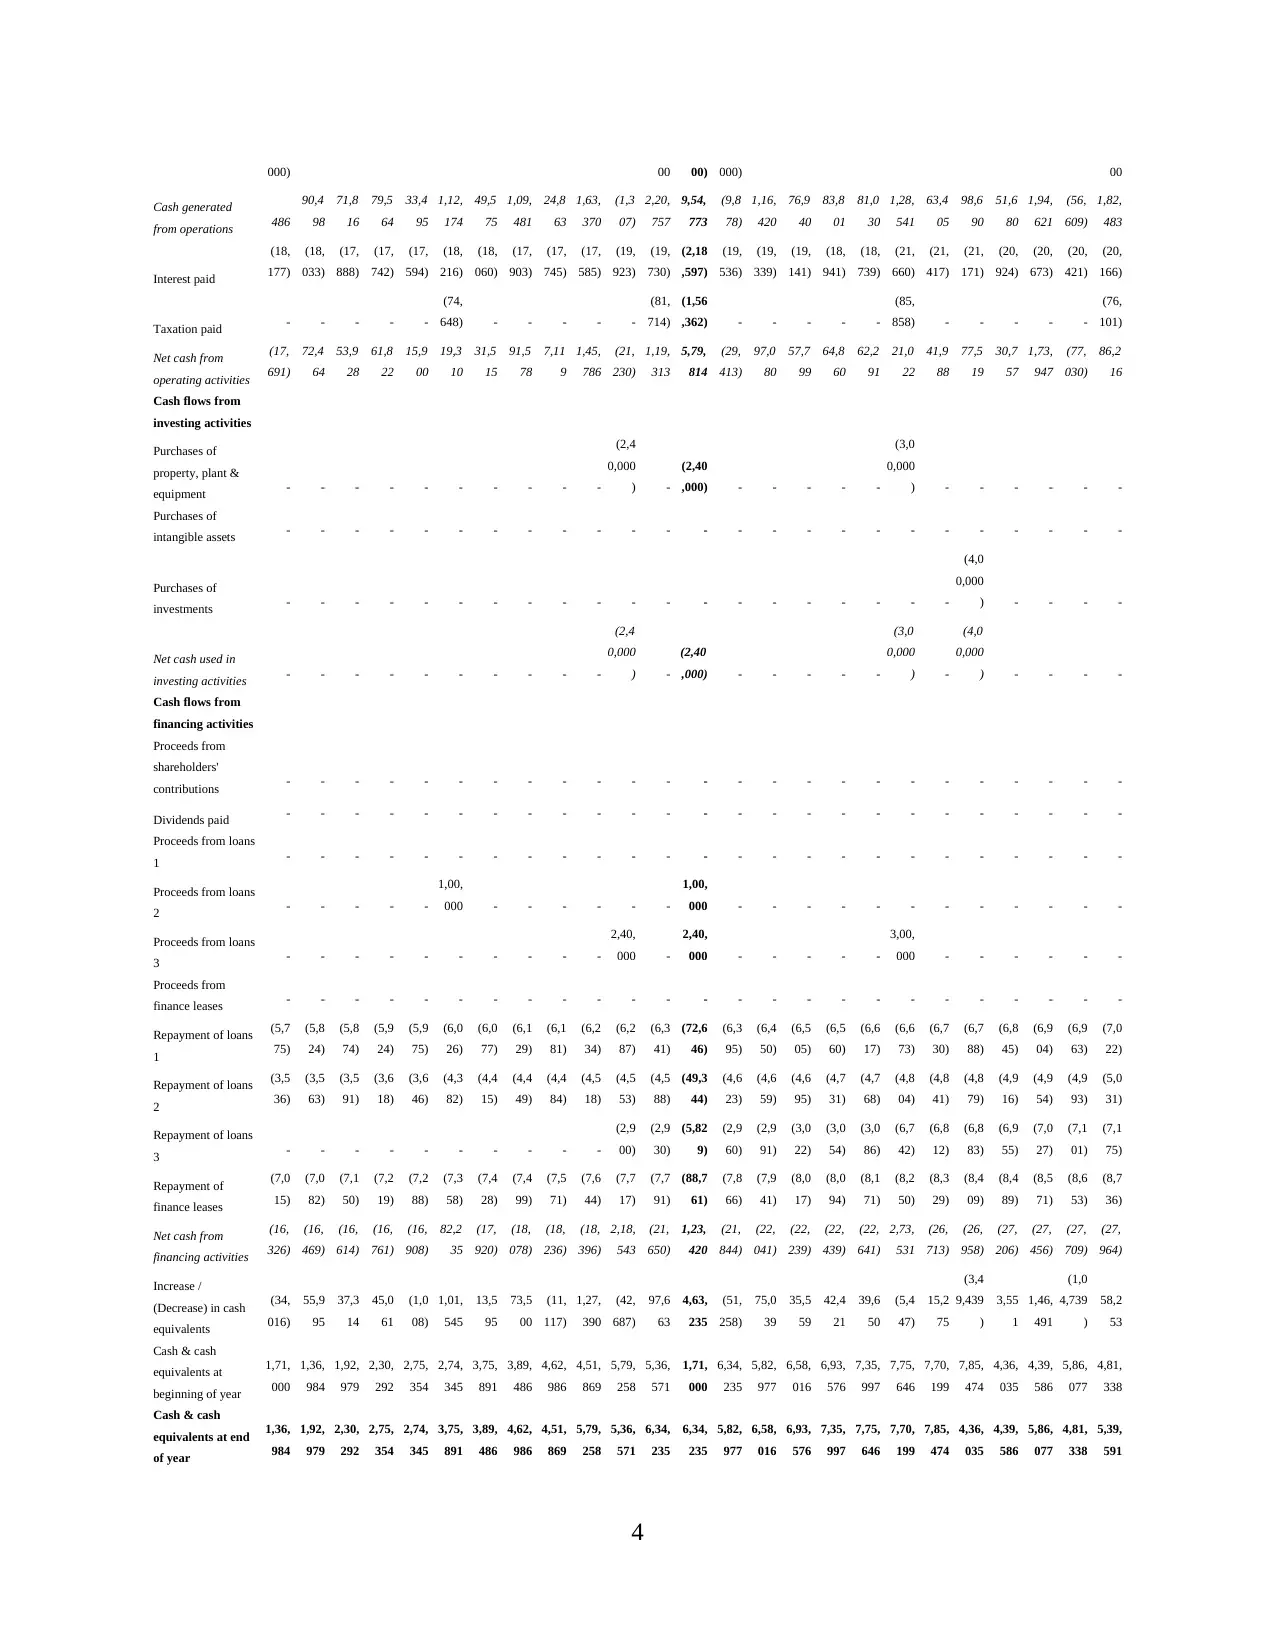
a) 12 month cash flow forecast.
Cash flow statement, is consider to be important for business that help them to forecast
about future finance requirements. It Show if the requirements of business are met or not in that
period. By attributing real revenue and expenditures with prediction, manager are able to see
which regions are lacking behind or those performing well and appropriately. This statement aids
to predicts the total amount of cash that will be required by company to run its future activities or
total inflows and outflows during an accounting year (Sassen, 2017).
Mar-
2019
Apr-
2019
May
-
2019
Jun-
2019
Jul-
2019
Aug-
2019
Sep-
2019
Oct-
2019
Nov-
2019
Dec-
2019
Jan-
2020
Feb-
2020
Year
-2020
Mar-
2020
Apr-
2020
May
-
2020
Jun-
2020
Jul-
2020
Aug-
2020
Sep-
2020
Oct-
2020
Nov-
2020
Dec-
2020
Jan-
2021
Feb-
2021
Cash flows from
operating activities
Profit / (Loss) for
the year
40,3
55
39,0
97
44,8
75
(3,1
73)
35,8
93
34,9
05
47,3
65
12,7
38
26,0
37
24,2
29
55,9
78
43,7
74
4,02,
072
45,9
47
28,7
66
43,4
54
36,8
80
49,2
39
16,4
92
46,6
42
31,6
30
50,9
63
(18,
647)
36,0
20
49,0
80
Interest
18,1
77
18,0
33
17,8
88
17,7
42
17,5
94
18,2
16
18,0
60
17,9
03
17,7
45
17,5
85
19,9
23
19,7
30
2,18,
597
19,5
36
19,3
39
19,1
41
18,9
41
18,7
39
21,6
60
21,4
17
21,1
71
20,9
24
20,6
73
20,4
21
20,1
66
Taxation
15,6
93
15,2
04
17,4
52
(1,2
34)
13,9
58
13,5
74
18,4
20
4,95
4
10,1
25
9,42
2
21,7
69
17,0
23
1,56,
362
17,8
68
11,1
87
16,8
99
14,3
42
19,1
49
6,41
4
18,1
39
12,3
01
19,8
19
(7,2
52)
14,0
08
19,0
87
Adjustment for non-
cash expenses:
Depreciation
15,0
00
15,0
00
15,0
00
15,0
00
15,0
00
15,0
00
15,0
00
15,0
00
15,0
00
15,0
00
19,0
00
19,0
00
1,88,
000
19,0
00
19,0
00
19,0
00
19,0
00
19,0
00
24,0
00
24,0
00
24,0
00
24,0
00
24,0
00
24,0
00
24,0
00
Amortization
1,00
0
1,00
0
1,00
0
1,00
0
1,00
0
1,00
0
1,00
0
1,00
0
1,00
0
1,00
0
1,00
0
1,00
0
12,0
00
1,00
0
1,00
0
1,00
0
1,00
0
1,00
0
1,00
0
1,00
0
1,00
0
1,00
0
1,00
0
1,00
0
1,00
0
Reserves - - - - - - - - - - - - - - - - - - - - - - - - -
Changes in
operating assets &
liabilities
Inventory
(9,6
52)
(18,
728)
4,63
8
(8,5
38)
3,63
2
3,64
8
1,72
0
(1,1
97)
(9,1
71)
44,7
83
(45,
894)
2,60
5
(32,1
53) 739
(2,1
06)
11,3
96
(19,
460)
(2,2
17)
12,4
49
12,1
28
(5,2
36)
(19,
812)
57,9
12
(53,
880)
(12,
096)
Trade Receivables
(10,
798)
(21,
893)
(1,6
63)
(20,
378)
14,0
72
(185
)
(3,1
53)
3,24
6
(20,
688)
84,1
23
(84,
488)
(831
)
(62,6
38)
4,91
2
(9,7
53)
22,7
37
(32,
033)
2,81
9
11,6
67 560
(3,1
38)
(34,
812)
1,08,
449
(1,0
1,089
)
(25,
507)
Loans & Advances - - - - - -
(10,
000) -
10,0
00 - - - - - - - - - - -
(20,
000) - - - -
Other Receivables - - - - - - - - - - - - - - - - - -
(7,0
00) - - - - - -
Trade Payables
15,2
52
14,6
09 (97)
59,8
20
(46,
413)
(1,3
13)
(13,
967)
31,3
73
3,77
0
(57,
783)
29,2
50
(1,5
48)
32,9
53
(213
)
20,6
83
(27,
805)
15,1
97
2,09
0
15,0
14
(34,
247)
3,73
7
21,9
99
(10,
892)
25,4
75
(13,
656)
Sales Tax
12,4
59
28,1
75
(27,
277)
19,3
25
(21,
241)
27,3
29
(24,
869)
24,4
64
(28,
955)
25,0
10
(17,
846)
30,0
04
46,5
80
(30,
667)
28,3
04
(28,
882)
29,9
34
(28,
790)
26,8
45
(26,
234)
33,2
25
(32,
399)
19,3
76
(22,
565)
33,4
10
Payroll Accruals - - - - - - - - - - - - -
2,00
0 - - - - - - - - - - -
Other Accruals
(55,
000) - - - - - - - - - -
60,0
00
5,00
0
(60,
000) - - - - - - - - - -
66,0
00
Other Provisions (42, - - - - - - - - - - 30,0 (12,0 (30, - - - - - - - - - - 21,0
3
000) 00 00) 000) 00
Cash generated
from operations 486
90,4
98
71,8
16
79,5
64
33,4
95
1,12,
174
49,5
75
1,09,
481
24,8
63
1,63,
370
(1,3
07)
2,20,
757
9,54,
773
(9,8
78)
1,16,
420
76,9
40
83,8
01
81,0
30
1,28,
541
63,4
05
98,6
90
51,6
80
1,94,
621
(56,
609)
1,82,
483
Interest paid
(18,
177)
(18,
033)
(17,
888)
(17,
742)
(17,
594)
(18,
216)
(18,
060)
(17,
903)
(17,
745)
(17,
585)
(19,
923)
(19,
730)
(2,18
,597)
(19,
536)
(19,
339)
(19,
141)
(18,
941)
(18,
739)
(21,
660)
(21,
417)
(21,
171)
(20,
924)
(20,
673)
(20,
421)
(20,
166)
Taxation paid - - - - -
(74,
648) - - - - -
(81,
714)
(1,56
,362) - - - - -
(85,
858) - - - - -
(76,
101)
Net cash from
operating activities
(17,
691)
72,4
64
53,9
28
61,8
22
15,9
00
19,3
10
31,5
15
91,5
78
7,11
9
1,45,
786
(21,
230)
1,19,
313
5,79,
814
(29,
413)
97,0
80
57,7
99
64,8
60
62,2
91
21,0
22
41,9
88
77,5
19
30,7
57
1,73,
947
(77,
030)
86,2
16
Cash flows from
investing activities
Purchases of
property, plant &
equipment - - - - - - - - - -
(2,4
0,000
) -
(2,40
,000) - - - - -
(3,0
0,000
) - - - - - -
Purchases of
intangible assets - - - - - - - - - - - - - - - - - - - - - - - - -
Purchases of
investments - - - - - - - - - - - - - - - - - - - -
(4,0
0,000
) - - - -
Net cash used in
investing activities - - - - - - - - - -
(2,4
0,000
) -
(2,40
,000) - - - - -
(3,0
0,000
) -
(4,0
0,000
) - - - -
Cash flows from
financing activities
Proceeds from
shareholders'
contributions - - - - - - - - - - - - - - - - - - - - - - - - -
Dividends paid - - - - - - - - - - - - - - - - - - - - - - - - -
Proceeds from loans
1 - - - - - - - - - - - - - - - - - - - - - - - - -
Proceeds from loans
2 - - - - -
1,00,
000 - - - - - -
1,00,
000 - - - - - - - - - - - -
Proceeds from loans
3 - - - - - - - - - -
2,40,
000 -
2,40,
000 - - - - -
3,00,
000 - - - - - -
Proceeds from
finance leases - - - - - - - - - - - - - - - - - - - - - - - - -
Repayment of loans
1
(5,7
75)
(5,8
24)
(5,8
74)
(5,9
24)
(5,9
75)
(6,0
26)
(6,0
77)
(6,1
29)
(6,1
81)
(6,2
34)
(6,2
87)
(6,3
41)
(72,6
46)
(6,3
95)
(6,4
50)
(6,5
05)
(6,5
60)
(6,6
17)
(6,6
73)
(6,7
30)
(6,7
88)
(6,8
45)
(6,9
04)
(6,9
63)
(7,0
22)
Repayment of loans
2
(3,5
36)
(3,5
63)
(3,5
91)
(3,6
18)
(3,6
46)
(4,3
82)
(4,4
15)
(4,4
49)
(4,4
84)
(4,5
18)
(4,5
53)
(4,5
88)
(49,3
44)
(4,6
23)
(4,6
59)
(4,6
95)
(4,7
31)
(4,7
68)
(4,8
04)
(4,8
41)
(4,8
79)
(4,9
16)
(4,9
54)
(4,9
93)
(5,0
31)
Repayment of loans
3 - - - - - - - - - -
(2,9
00)
(2,9
30)
(5,82
9)
(2,9
60)
(2,9
91)
(3,0
22)
(3,0
54)
(3,0
86)
(6,7
42)
(6,8
12)
(6,8
83)
(6,9
55)
(7,0
27)
(7,1
01)
(7,1
75)
Repayment of
finance leases
(7,0
15)
(7,0
82)
(7,1
50)
(7,2
19)
(7,2
88)
(7,3
58)
(7,4
28)
(7,4
99)
(7,5
71)
(7,6
44)
(7,7
17)
(7,7
91)
(88,7
61)
(7,8
66)
(7,9
41)
(8,0
17)
(8,0
94)
(8,1
71)
(8,2
50)
(8,3
29)
(8,4
09)
(8,4
89)
(8,5
71)
(8,6
53)
(8,7
36)
Net cash from
financing activities
(16,
326)
(16,
469)
(16,
614)
(16,
761)
(16,
908)
82,2
35
(17,
920)
(18,
078)
(18,
236)
(18,
396)
2,18,
543
(21,
650)
1,23,
420
(21,
844)
(22,
041)
(22,
239)
(22,
439)
(22,
641)
2,73,
531
(26,
713)
(26,
958)
(27,
206)
(27,
456)
(27,
709)
(27,
964)
Increase /
(Decrease) in cash
equivalents
(34,
016)
55,9
95
37,3
14
45,0
61
(1,0
08)
1,01,
545
13,5
95
73,5
00
(11,
117)
1,27,
390
(42,
687)
97,6
63
4,63,
235
(51,
258)
75,0
39
35,5
59
42,4
21
39,6
50
(5,4
47)
15,2
75
(3,4
9,439
)
3,55
1
1,46,
491
(1,0
4,739
)
58,2
53
Cash & cash
equivalents at
beginning of year
1,71,
000
1,36,
984
1,92,
979
2,30,
292
2,75,
354
2,74,
345
3,75,
891
3,89,
486
4,62,
986
4,51,
869
5,79,
258
5,36,
571
1,71,
000
6,34,
235
5,82,
977
6,58,
016
6,93,
576
7,35,
997
7,75,
646
7,70,
199
7,85,
474
4,36,
035
4,39,
586
5,86,
077
4,81,
338
Cash & cash
equivalents at end
of year
1,36,
984
1,92,
979
2,30,
292
2,75,
354
2,74,
345
3,75,
891
3,89,
486
4,62,
986
4,51,
869
5,79,
258
5,36,
571
6,34,
235
6,34,
235
5,82,
977
6,58,
016
6,93,
576
7,35,
997
7,75,
646
7,70,
199
7,85,
474
4,36,
035
4,39,
586
5,86,
077
4,81,
338
5,39,
591
4
⊘ This is a preview!⊘
Do you want full access?
Subscribe today to unlock all pages.
Trusted by 1+ million students worldwide
TASK 4
a) Purpose of budgets
Budgets is consider one of the most important for small businesses as it support to plan
for the desired targets that company wants to attain in nearby future. In general, budget is a
predefined administrators policy document that is prepared for a given time period that gives a
level for comparison with the actual results achieved in that accounting year. There are number
of benefits of budgets which gives stability for new business such as:
Budgeting estimates income, schedules spending and limits any expense not included in
the financial planning scheme (Importance of budgets, 2019).
Budgeting guarantee that cash is assigned to stuff that promote the business goals and
objectives.
Through a well-informed budget manager are able to describe everyone about the
business priorities.
b) Affordable budgets plan:
5-YEAR BUDGET PLAN
FORECASTED REVENUE
Units sold
annually
Average
price per
unit
Annual revenue
per product
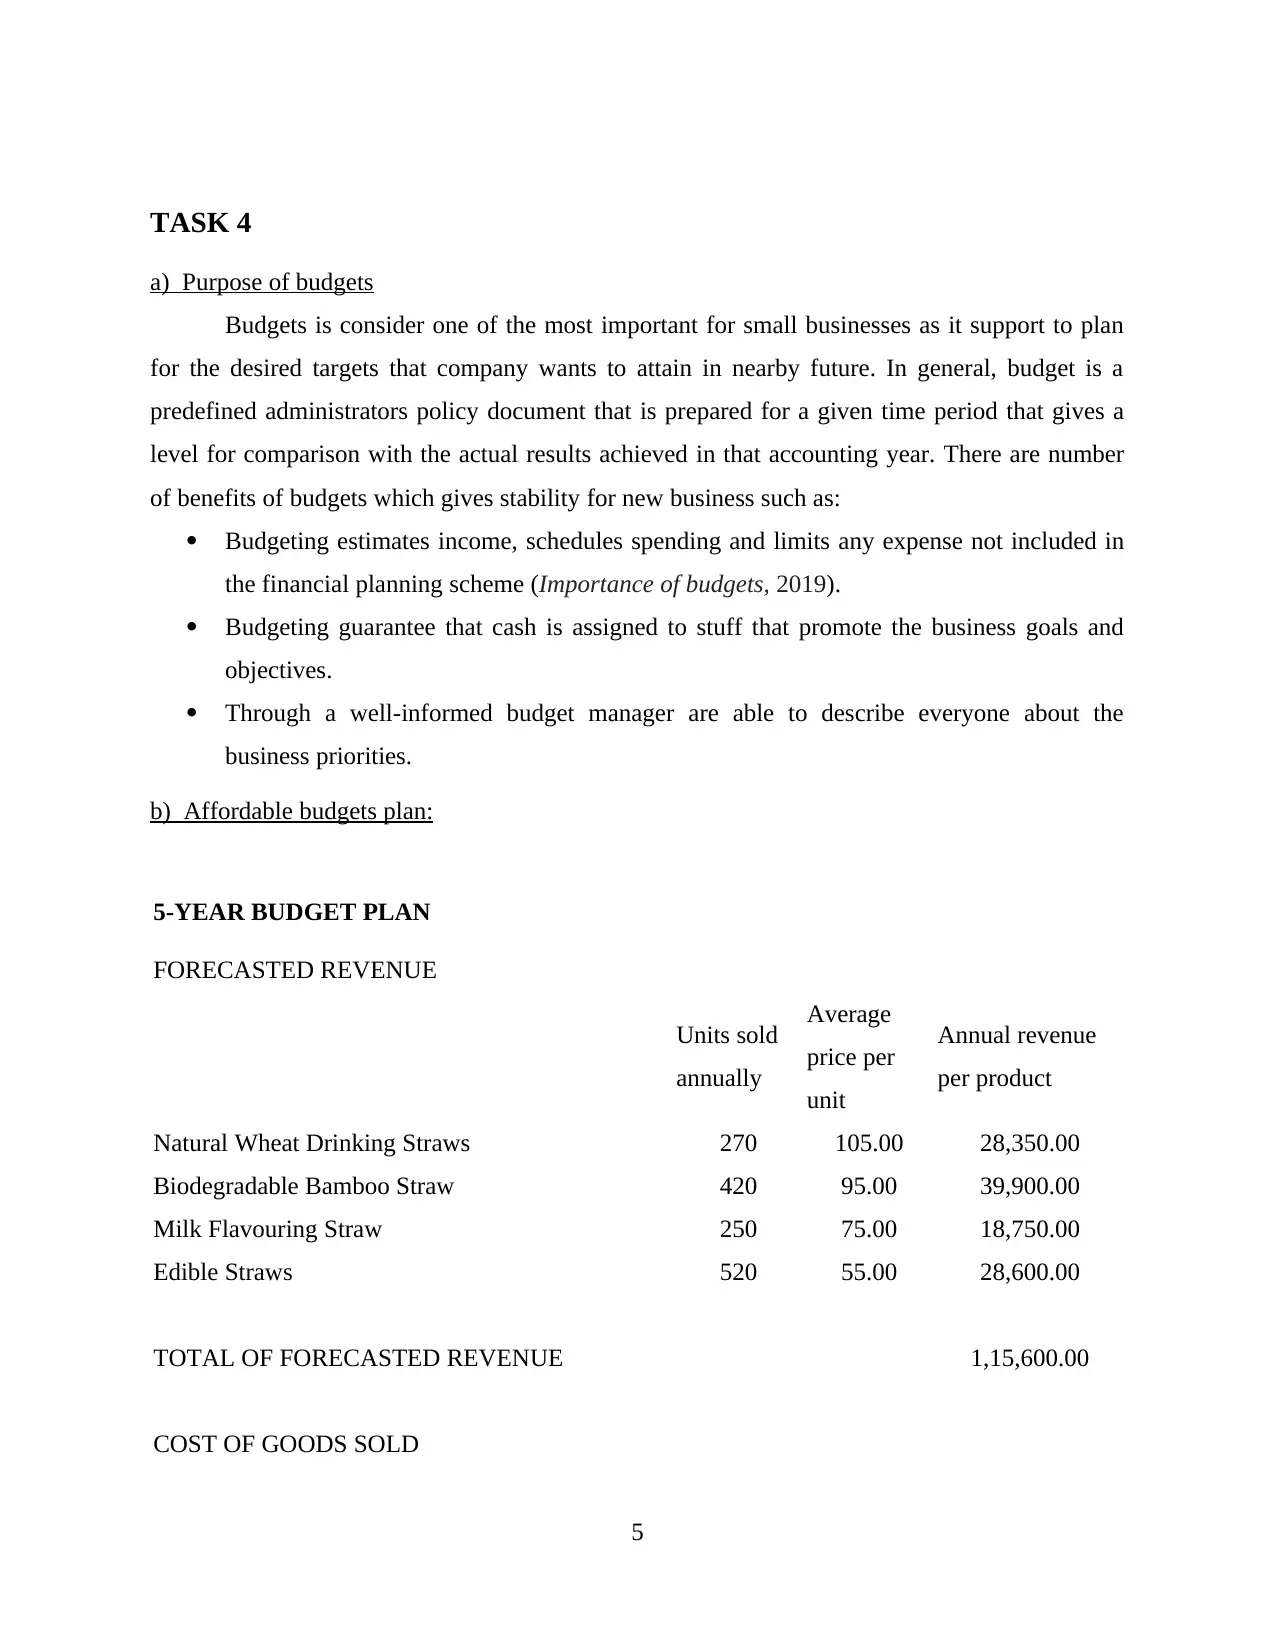
Natural Wheat Drinking Straws 270 105.00 28,350.00
Biodegradable Bamboo Straw 420 95.00 39,900.00
Milk Flavouring Straw 250 75.00 18,750.00
Edible Straws 520 55.00 28,600.00
TOTAL OF FORECASTED REVENUE 1,15,600.00
COST OF GOODS SOLD
5
a) Purpose of budgets
Budgets is consider one of the most important for small businesses as it support to plan
for the desired targets that company wants to attain in nearby future. In general, budget is a
predefined administrators policy document that is prepared for a given time period that gives a
level for comparison with the actual results achieved in that accounting year. There are number
of benefits of budgets which gives stability for new business such as:
Budgeting estimates income, schedules spending and limits any expense not included in
the financial planning scheme (Importance of budgets, 2019).
Budgeting guarantee that cash is assigned to stuff that promote the business goals and
objectives.
Through a well-informed budget manager are able to describe everyone about the
business priorities.
b) Affordable budgets plan:
5-YEAR BUDGET PLAN
FORECASTED REVENUE
Units sold
annually
Average
price per
unit
Annual revenue
per product
Natural Wheat Drinking Straws 270 105.00 28,350.00
Biodegradable Bamboo Straw 420 95.00 39,900.00
Milk Flavouring Straw 250 75.00 18,750.00
Edible Straws 520 55.00 28,600.00
TOTAL OF FORECASTED REVENUE 1,15,600.00
COST OF GOODS SOLD
5
Paraphrase This Document
Need a fresh take? Get an instant paraphrase of this document with our AI Paraphraser
Expected
gross
margin
Annual cost of
goods sold
Natural Wheat Drinking Straws 32% 9,072.00
Biodegradable Bamboo Straw 27% 10,773.00
Milk Flavouring Straw 22% 4,125.00
Edible Straws 30% 8,580.00
TOATL COST OF GOODS SOLD 32,550.00
ANNUAL MAINTENANCE, REPAIR AND
OVERHAUL
Factor (%) on capital equipment 15%
ASSET DEPRECIATION
Number of Years 5
TAX
Annual Tax Rate 30%
INFLATION
Annual Inflation Rate 2%
6
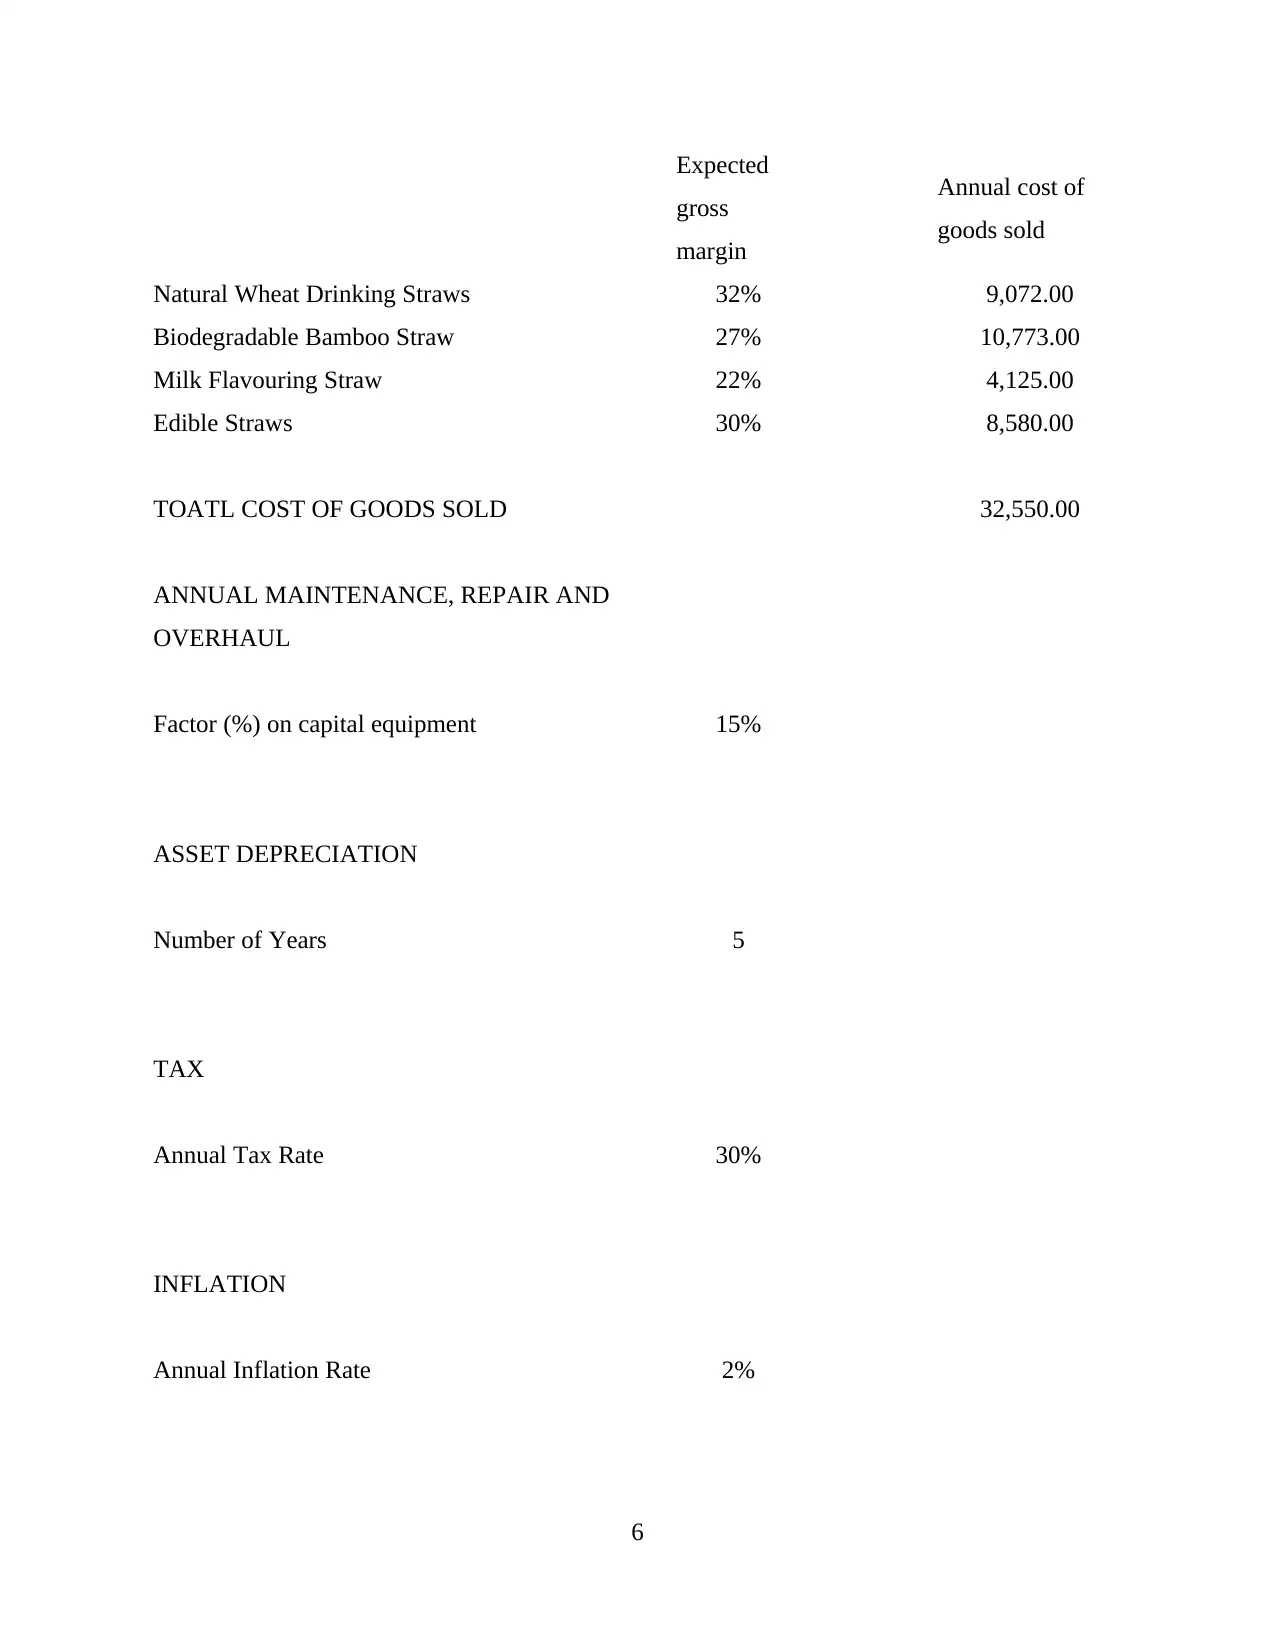
PRODUCT PRICE INCREASE
Annual Price Increase 2%
FUNDING
Loan Amount 55,000.00
Annual interest rate 5.00%
Term of loan (months) 60
Monthly rate 0.41%
Payment 1,035.12
Total Amount Payable 62,107.31
TASK 5
A) Set of final accounts:
Profit & Loss Account
INCOME
Year 1 Year 2 Year 3 Year 4 Year 5
Revenue
Natural Wheat Drinking Straws 28,350.00 28,917.00 30,073.68 31,878.10 34,428.35
Biodegradable Bamboo Straw 39,900.00 40,698.00 42,325.92 44,865.48 48,454.71
Milk Flavouring Straw 18,750.00 19,125.00 19,890.00 21,083.40 22,770.07
Edible Straws 28,600.00 29,172.00 30,338.88 32,159.21 34,731.95
Total revenue 1,15,600.00 1,17,912.00 1,22,628.48 1,29,986.19 1,40,385.08
Variable Expenses
7
⊘ This is a preview!⊘
Do you want full access?
Subscribe today to unlock all pages.
Trusted by 1+ million students worldwide
Natural Wheat Drinking Straws 9,072.00 9,253.44 9,623.58 10,200.99 11,017.07
Biodegradable Bamboo Straw 10,773.00 10,988.46 11,428.00 12,113.68 13,082.77
Milk Flavouring Straw 4,125.00 4,207.50 4,375.80 4,638.35 5,009.42
Edible Straws 8,580.00 8,751.60 9,101.66 9,647.76 10,419.58
Cost of goods sold 32,550.00 33,201.00 34,529.04 36,600.78 39,528.84
Gross Profit 83,050.00 84,711.00 88,099.44 93,385.41 1,00,856.24
Non-Operation Income
Rental - - - - -
Interest income - - - - -
Loss (gain) on sale of assets - - 1,000.00 - -
Other income (specify) - - - - -
Toatal Non-Operation Income - - 1,000.00 - -
TOTAL INCOME 83,050.00 84,711.00 89,099.44 93,385.41 1,00,856.24
EXPENSES
Operating expenses
Sales and marketing 15,000.00 15,300.00 15,912.00 16,866.72 18,216.06
Depreciation 6,000.00 6,120.00 6,240.00 6,360.00 6,480.00
Insurance 7,500.00 7,650.00 7,956.00 8,433.36 9,108.03
Payroll and Payroll Tax 21,000.00 21,420.00 22,276.80 23,613.41 25,502.48
Property taxes 2,500.00 2,550.00 2,652.00 2,811.12 3,036.01
Maintenance, repair, and overhaul 1,500.00 1,530.00 1,560.00 1,590.00 1,620.00
8
Paraphrase This Document
Need a fresh take? Get an instant paraphrase of this document with our AI Paraphraser
Utilities 5,000.00 5,100.00 5,304.00 5,622.24 6,072.02
Administrative fees 300.00 306.00 318.24 337.33 364.32
Interest expense on long-term
debt 2,467.85 1,970.17 1,447.60 898.91 322.78
Other 1,000.00 1,020.00 1,060.80 1,124.45 1,214.40
Total operating expenses 62,267.85 62,966.17 64,727.44 67,657.54 71,936.10
Fixed Expenses
Go-down Rent 2,200.00 2,200.00 2,200.00 2,200.00 2,200.00
Other fixed expenses 1,200.00 1,200.00 1,200.00 1,200.00 1,200.00
Total Non-Recurring Expenses 3,400.00 3,400.00 3,400.00 3,400.00 3,400.00
TOTAL EXPENSES 65,667.85 66,366.17 68,127.44 71,057.54 75,336.10
TAXES
Income Tax 5,214.65 5,503.45 6,291.60 6,698.36 7,656.04
Other Tax (specify) - - - - -
TOTAL TAXES 5,214.65 5,503.45 6,291.60 6,698.36 7,656.04
NET PROFIT 12,167.51 12,841.38 14,680.40 15,629.51 17,864.09
Balance Sheet
ASSETS
Current Assets Initial
balance Year 1 Year 2 Year 3 Year 4 Year 5
9
Cash and short-term investments 50,000.0
0
23,360.0
0
13,870.0
9
79,816.6
3
1,72,283.
58
1,41,528.
99
Accounts receivable 3,000.00 3,000.00 3,000.00 3,000.00 3,000.00 3,000.00
Total inventory 25,000.0
0
25,000.0
0
25,000.0
0
25,000.0
0
25,000.0
0
25,000.0
0
Prepaid expenses - - - - - -
Deferred income tax - - - - - -
Other current assets 5,000.00 5,000.00 5,000.00 5,000.00 5,000.00 5,000.00
Total current assets 83,000.0
0
56,360.0
0
46,870.0
9
1,12,816.
63
2,05,283.
58
1,74,528.
99
Property and Equipment Initial
balance Year 1 Year 2 Year 3 Year 4 Year 5
Buildings 20,000.0
0
20,000.0
0
20,000.0
0
20,000.0
0
20,000.0
0
20,000.0
0
Land 10,000.0
0
10,000.0
0
10,000.0
0
10,000.0
0
10,000.0
0
10,000.0
0
Capital improvements - - - - - -
Machinery and equipment 10,000.0
0
10,000.0
0
10,000.0
0
10,000.0
0
10,000.0
0
10,000.0
0
Less Accumulated depreciation
expense 6,000.00 12,120.0
0
18,360.0
0
24,720.0
0
31,200.0
0
Total Property and Equipment 40,000.0
0
34,000.0
0
27,880.0
0
21,640.0
0
15,280.0
0 8,800.00
Other Assets Initial
balance Year 1 Year 2 Year 3 Year 4 Year 5
10
0
23,360.0
0
13,870.0
9
79,816.6
3
1,72,283.
58
1,41,528.
99
Accounts receivable 3,000.00 3,000.00 3,000.00 3,000.00 3,000.00 3,000.00
Total inventory 25,000.0
0
25,000.0
0
25,000.0
0
25,000.0
0
25,000.0
0
25,000.0
0
Prepaid expenses - - - - - -
Deferred income tax - - - - - -
Other current assets 5,000.00 5,000.00 5,000.00 5,000.00 5,000.00 5,000.00
Total current assets 83,000.0
0
56,360.0
0
46,870.0
9
1,12,816.
63
2,05,283.
58
1,74,528.
99
Property and Equipment Initial
balance Year 1 Year 2 Year 3 Year 4 Year 5
Buildings 20,000.0
0
20,000.0
0
20,000.0
0
20,000.0
0
20,000.0
0
20,000.0
0
Land 10,000.0
0
10,000.0
0
10,000.0
0
10,000.0
0
10,000.0
0
10,000.0
0
Capital improvements - - - - - -
Machinery and equipment 10,000.0
0
10,000.0
0
10,000.0
0
10,000.0
0
10,000.0
0
10,000.0
0
Less Accumulated depreciation
expense 6,000.00 12,120.0
0
18,360.0
0
24,720.0
0
31,200.0
0
Total Property and Equipment 40,000.0
0
34,000.0
0
27,880.0
0
21,640.0
0
15,280.0
0 8,800.00
Other Assets Initial
balance Year 1 Year 2 Year 3 Year 4 Year 5
10
⊘ This is a preview!⊘
Do you want full access?
Subscribe today to unlock all pages.
Trusted by 1+ million students worldwide
1 out of 14
Related Documents


Your All-in-One AI-Powered Toolkit for Academic Success.
+13062052269
info@desklib.com
Available 24*7 on WhatsApp / Email
![[object Object]](/_next/static/media/star-bottom.7253800d.svg)
Unlock your academic potential
Copyright © 2020–2026 A2Z Services. All Rights Reserved. Developed and managed by ZUCOL.