Holmes Institute HI6007 Statistics Assignment: Regression Analysis

Verified

Added on  2023/06/07

|5
|939
|123
Homework Assignment
AI Summary
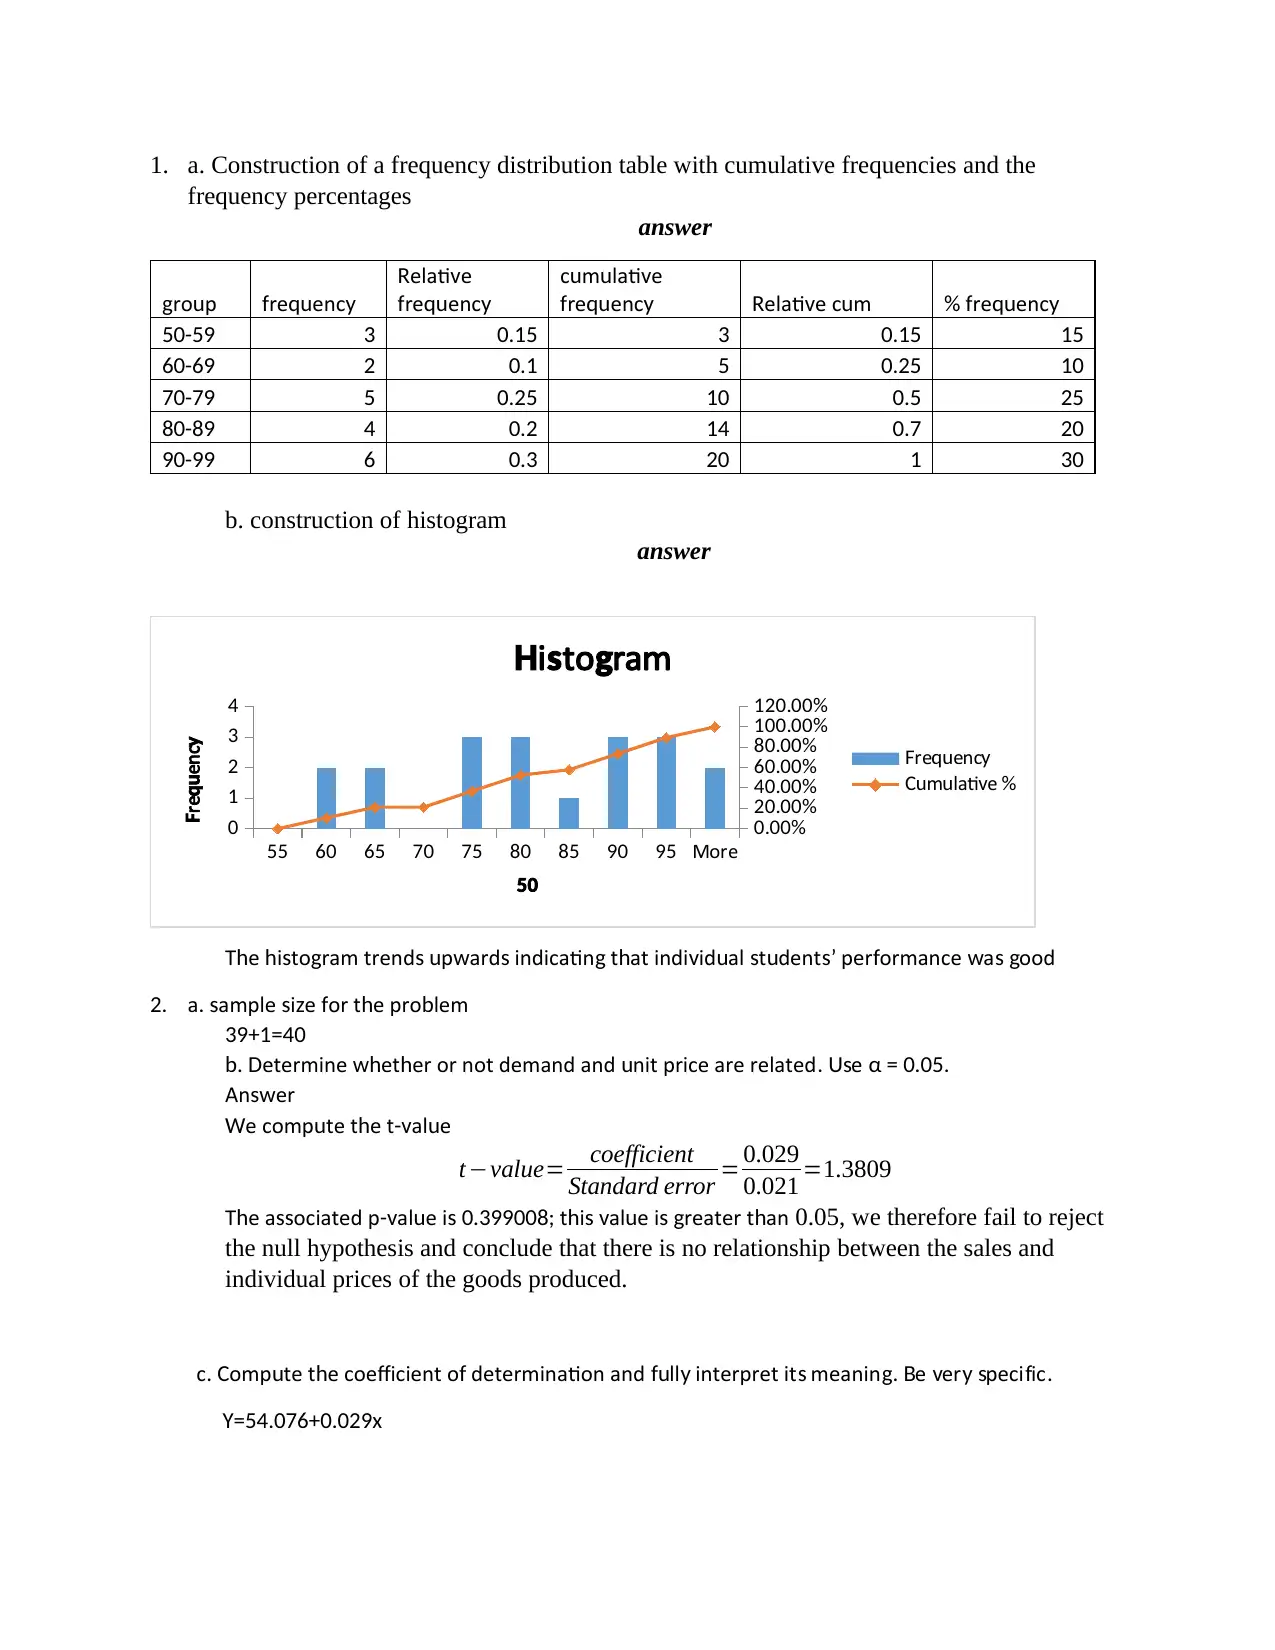
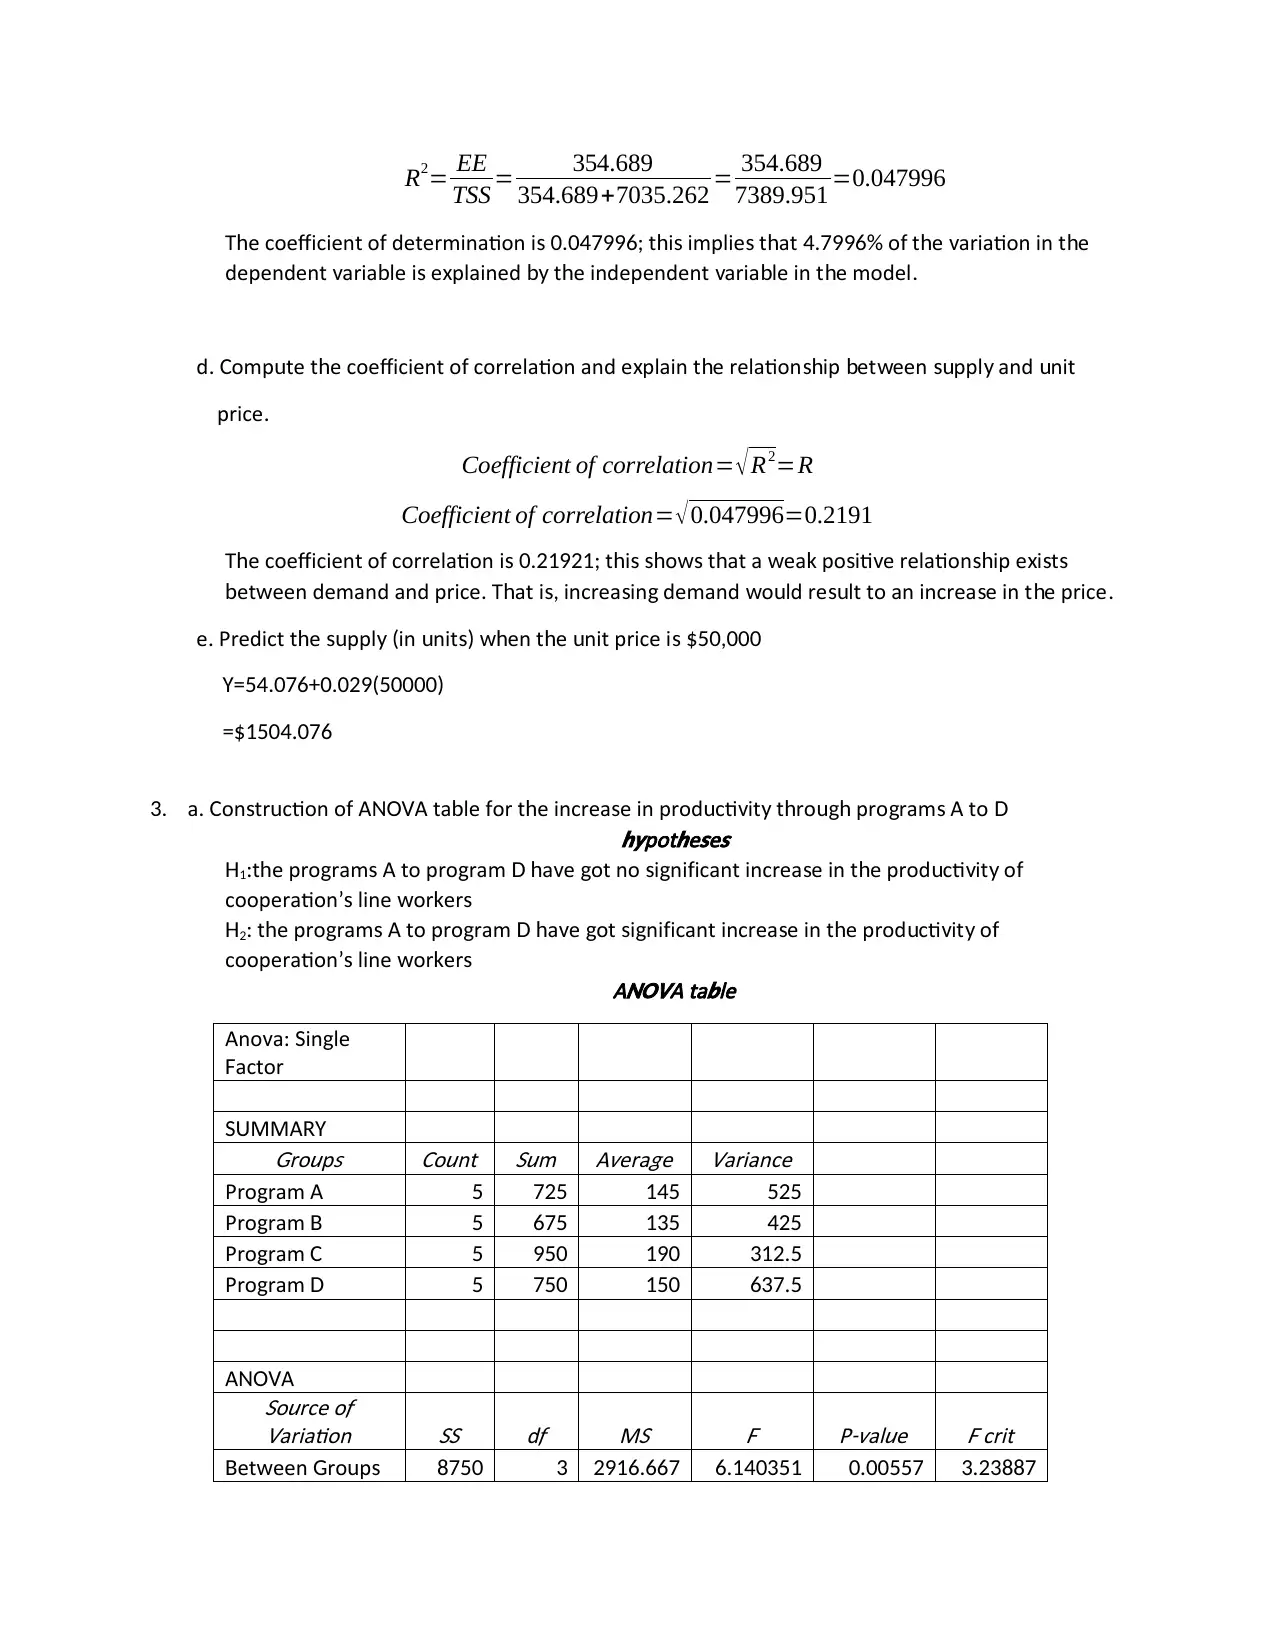
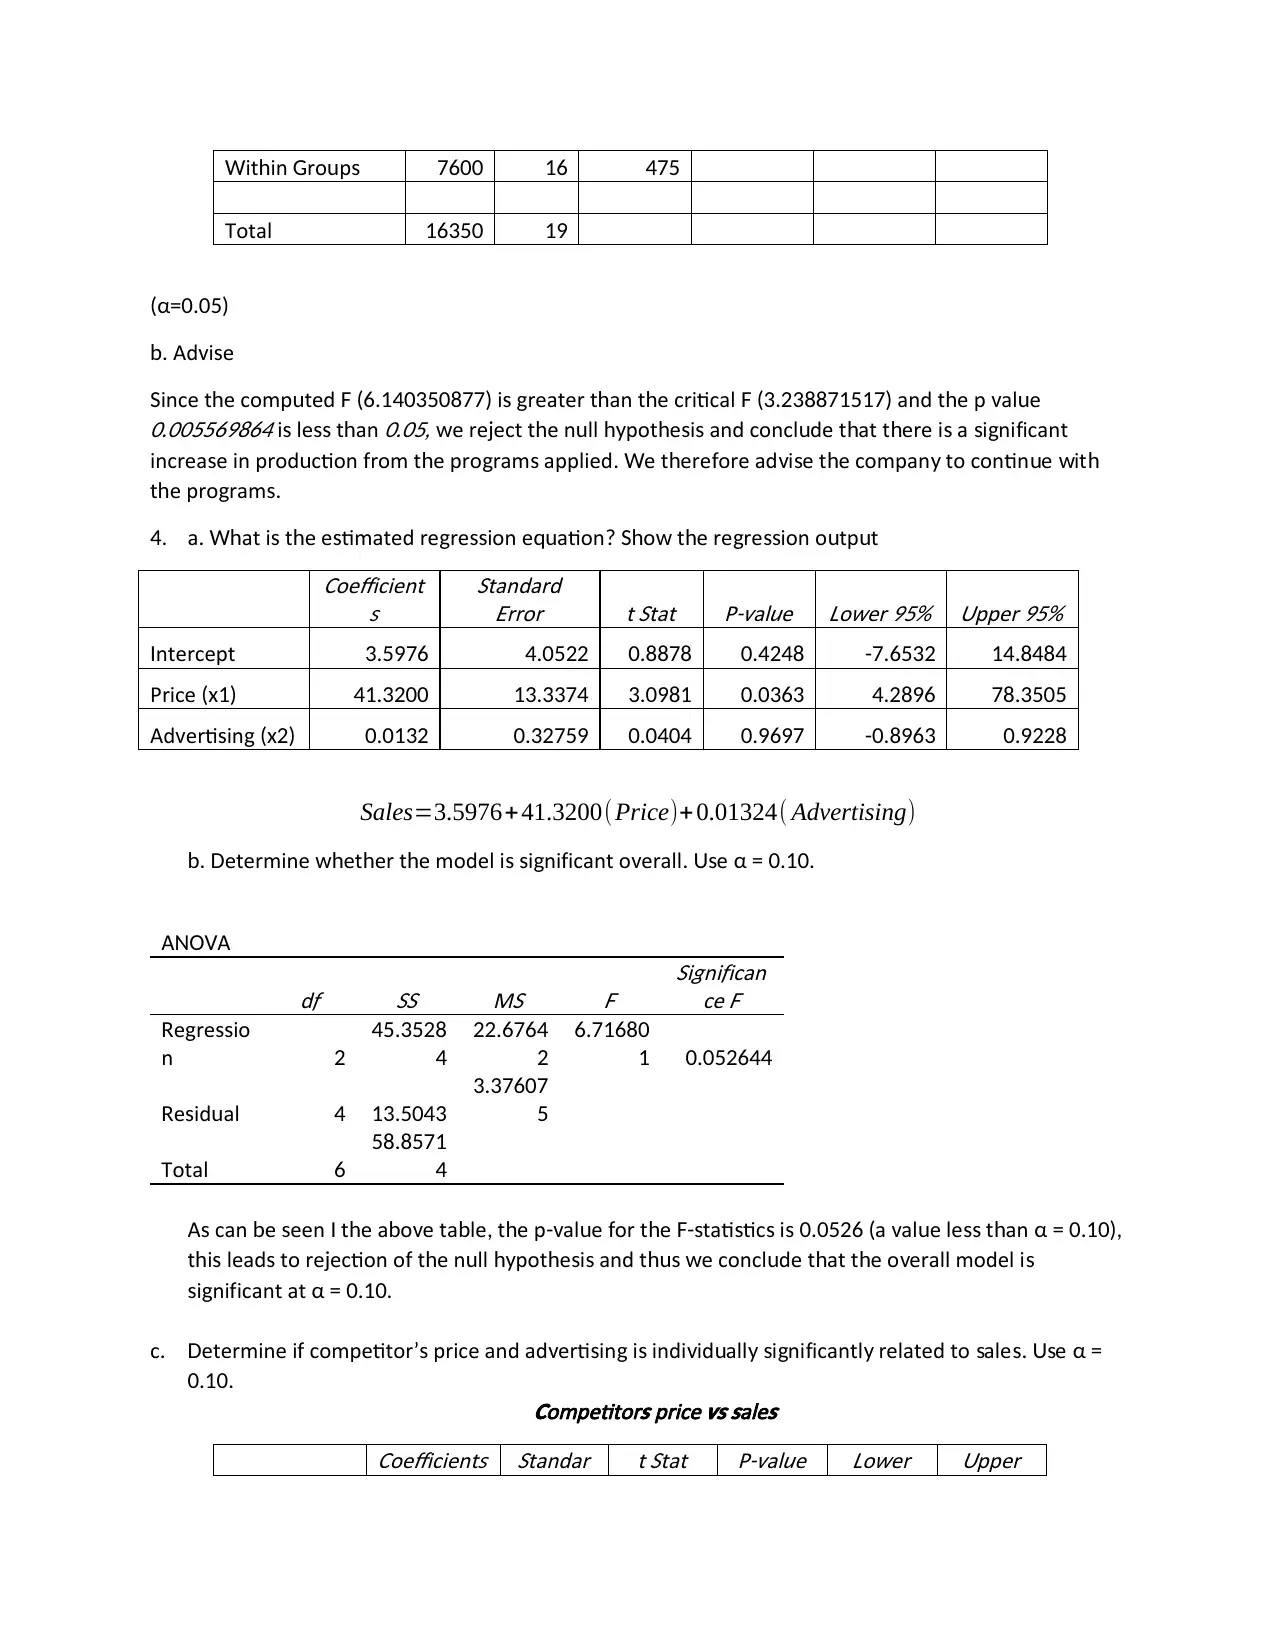
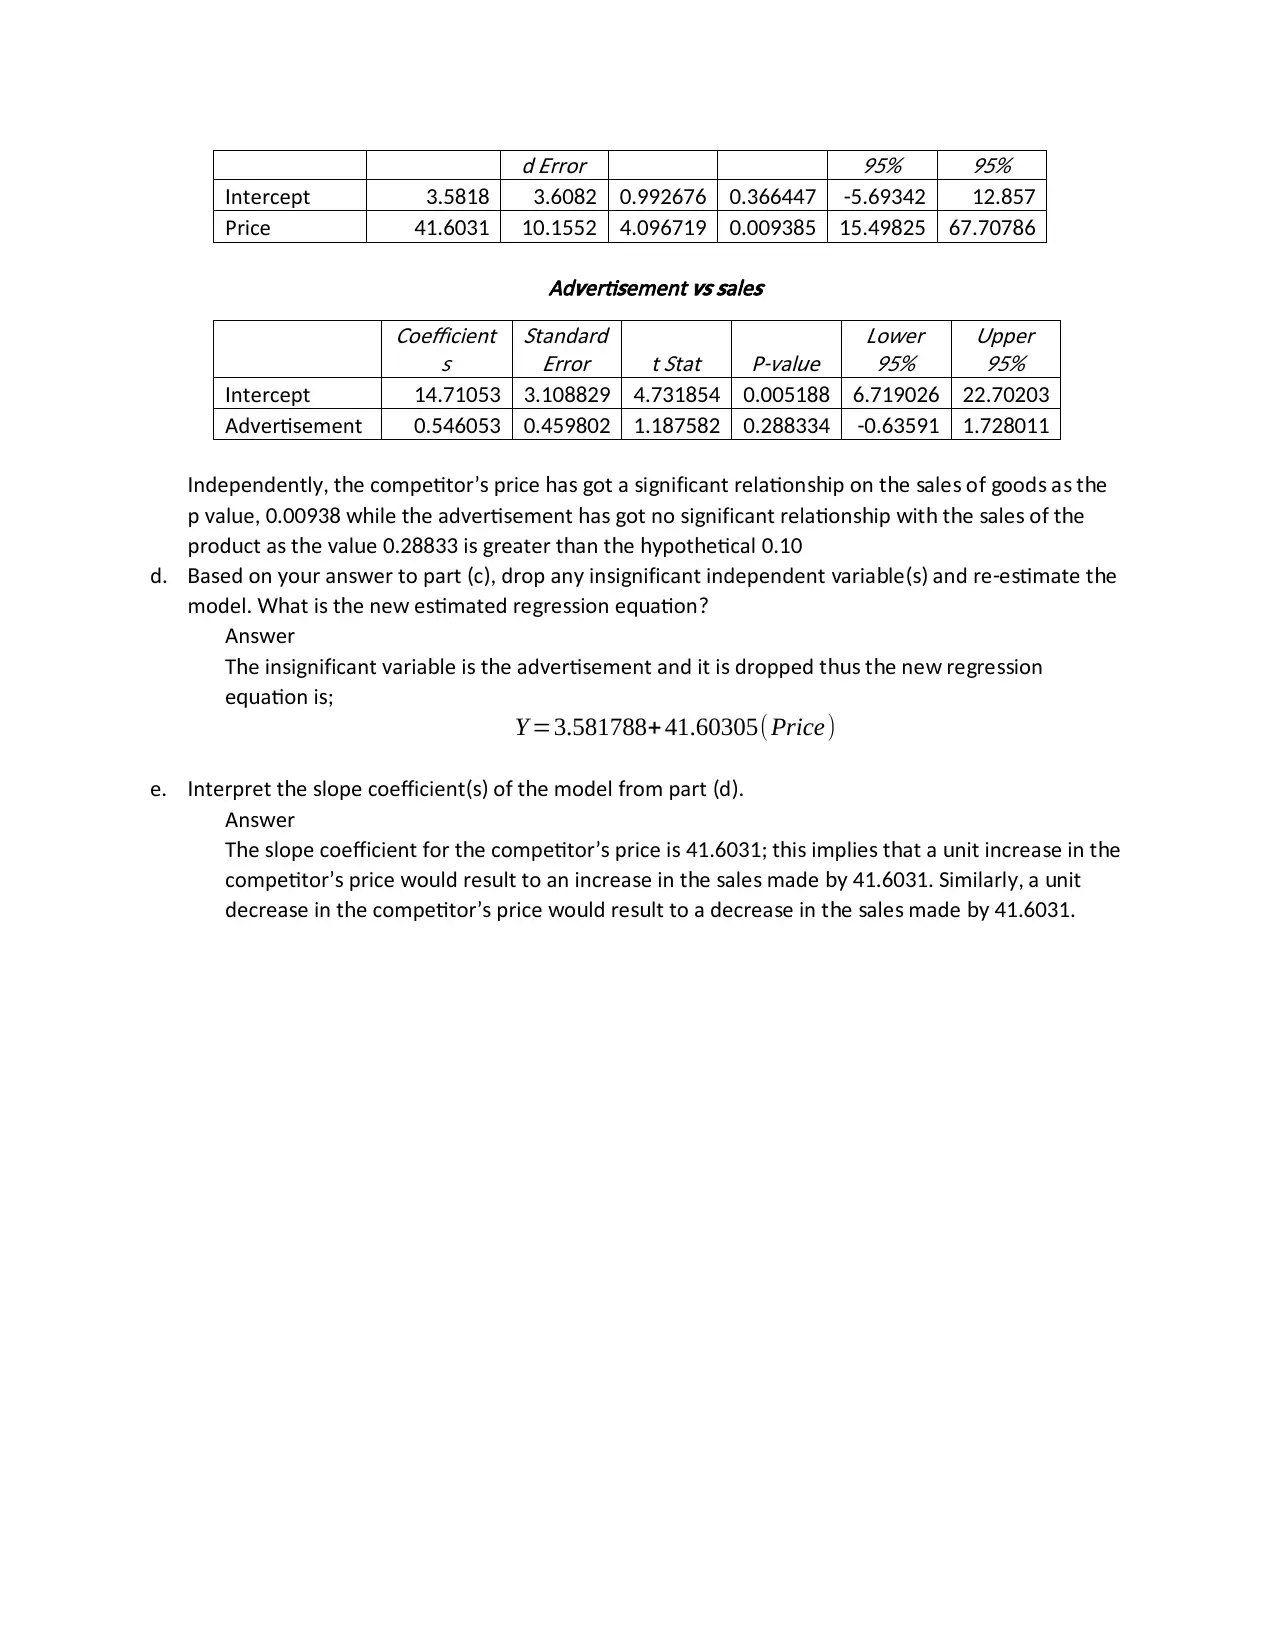
This assignment solution provides a detailed analysis of statistical concepts. It includes the construction of frequency distribution tables with cumulative frequencies and percentage frequencies, followed by the creation of a histogram to visualize the data distribution. The assignment also addresses regression analysis, determining the relationship between demand and unit price, computing the coefficient of determination and correlation, and predicting supply based on unit price. Furthermore, it involves the construction of an ANOVA table to assess the increase in productivity through different programs, advising on the continuation of these programs based on the statistical results. Finally, the assignment includes multiple regression analysis to estimate regression equations, determine the significance of the model and individual variables, and interpret the slope coefficients, concluding with a revised model after dropping insignificant variables.
tabler-icon-diamond-filled.svg

Contribute Materials

Your contribution can guide someone’s learning journey. Share your documents today.
Document Page
Statistics
Student Name:
Instructor Name:
Course Number:
8 September 2018
tabler-icon-diamond-filled.svg

Secure Best Marks with AI Grader

Need help grading? Try our AI Grader for instant feedback on your assignments.
Document Page
1. a. Construction of a frequency distribution table with cumulative frequencies and the
frequency percentages
answer
ro pg u re encf qu y
elati eR v
re encf qu y
c m lati eu u v
re encf qu y elati e c mR v u re enc% f qu y
50-59 3 0.15 3 0.15 15
60-69 2 0.1 5 0.25 10
70-79 5 0.25 10 0.5 25
80-89 4 0.2 14 0.7 20
90-99 6 0.3 20 1 30
b. construction of histogram
answer
T e i to ram trend p ard indicatin t at indi id al t dent per ormance a oodh h s g s u w s g h v u s u s’ f w s g
2. a ample i e or t e pro lem. s s z f h b
39+1=40
etermine et er or not demand and nit price are related eb. D wh h u . Us α = 0.05.
An ersw
e comp te t e t al eW u h -v u
tvalue= coefficient
Standard error = 0.029
0.021 =1.3809
T e a ociated p al e i t i al e i reater t anh ss -v u s 0.399008; h s v u s g h 0.05, we therefore fail to reject
the null hypothesis and conclude that there is no relationship between the sales and
individual prices of the goods produced.
c omp te t e coe icient o determination and ll interpret it meanin e er peci ic. C u h ff f fu y s g. B v y s f .
Y=54.076+0.029x
55 60 65 70 75 80 85 90 95 More
0
1
2
3
4
0.00%
20.00%
40.00%
60.00%
80.00%
100.00%
120.00%
i to ramH s g
re encF qu y
m lati eCu u v %
50
re encF qu y
Document Page
R2= EE
TSS = 354.689
354.689+7035.262 = 354.689
7389.951 =0.047996
T e coe icient o determination i t i implie t at o t e ariation in t eh ff f s 0.047996; h s s h 4.7996% f h v h
dependent aria le i e plained t e independent aria le in t e modelv b s x by h v b h .
d omp te t e coe icient o correlation and e plain t e relation ip et een ppl and nit. C u h ff f x h sh b w su y u
price.
Coefficient of correlation= R2=R
Coefficient of correlation= 0.047996=0.2191
T e coe icient o correlation i t i o t at a ea po iti e relation ip e i th ff f s 0.21921; h s sh ws h w k s v sh x s s
et een demand and price T at i increa in demand o ld re lt to an increa e in t e priceb w . h s, s g w u su s h .
e Predict t e ppl in nit en t e nit price i. h su y ( u s) wh h u s $50,000
Y=54.076+0.029(50000)
=$1504.076
3. a on tr ction o A A ta le or t e increa e in prod cti it t ro pro ram A to. C s u f NOV b f h s u v y h ugh g s D
pot e e
hy h s s
H1 t e pro ram A to pro ram a e ot no i ni icant increa e in t e prod cti it o: h g s g D h v g s g f s h u v y f
cooperation line or er’s w k s
H2 t e pro ram A to pro ram a e ot i ni icant increa e in t e prod cti it o: h g s g D h v g s g f s h u v y f
cooperation line or er’s w k s
A A ta le
NOV b
Ano a in lev : S g
actorF
MMASU RY
ro p
G u s
o nt
C u mSu A era e
v g ariance
V
Pro ram Ag 5 725 145 525
Pro ramg B 5 675 135 425
Pro ramg C 5 950 190 312.5
Pro ramg D 5 750 150 637.5
A ANOV
o rce o
S u f
ariation
V
SS df MS
F P al e
-v u crit
F
et een ro pB w G u s 8750 3 2916.667 6.140351 0.00557 3.23887
Document Page
it in ro pW h G u s 7600 16 475
Total 16350 19
(α=0.05)
Ad i eb. v s
ince t e comp ted i reater t an t e critical and t e p al eS h u F (6.140350877) s g h h F (3.238871517) h v u0.005569864 i le t ans ss h
0.05, e re ect t e n ll pot e i and concl de t at t ere i a i ni icantw j h u hy h s s u h h s s g f
increa e in prod ction rom t e pro ram applied e t ere ore ad i e t e compan to contin e its u f h g s . W h f v s h y u w h
t e pro ramh g s.
4. a at i t e e timated re re ion e ation o t e re re ion o tp t. Wh s h s g ss qu ? Sh w h g ss u u
oe icient
C ff
s
tandard
S rror
E
t tatS P al e
-v u o er
L w 95% pper
U 95%
nterceptI 3.5976 4.0522 0.8878 0.4248 -7.6532 14.8484
Price (x1) 41.3200 13.3374 3.0981 0.0363 4.2896 78.3505
Ad erti inv s g (x2) 0.0132 0.32759 0.0404 0.9697 -0.8963 0.9228
Sales=3.5976+41.3200( Price)+ 0.01324( Advertising)
etermine et er t e model i i ni icant o erall eb. D wh h h s s g f v . Us α = 0.10.
A ANOV df SS MS F
i ni ican
S g f
ce F
e re ioR g ss
n 2
45.3528
4
22.6764
2
6.71680
1 0.052644
e id alR s u 4 13.5043
3.37607
5
Total 6
58.8571
4
A can e een t e a o e ta le t e p al e or t e tati tic i a al e le t ans b s I h b v b , h -v u f h F-s s s s 0.0526 ( v u ss h α = 0.10),
t i lead to re ection o t e n ll pot e i and t e concl de t at t e o erall model ih s s j f h u hy h s s hus w u h h v s
i ni icant ats g f α = 0.10.
c. etermine i competitor price and ad erti in i indi id all i ni icantl related to ale eD f ’s v s g s v u y s g f y s s. Us α =
0.10.
ompetitor price ale
C
s vs s s
oe icient
C ff s tandar
S
t tatS P al e
-v u o er
L w pper
U
tabler-icon-diamond-filled.svg

Secure Best Marks with AI Grader

Need help grading? Try our AI Grader for instant feedback on your assignments.
Document Page
d rror
E
95% 95%
nterceptI 3.5818 3.6082 0.992676 0.366447 -5.69342 12.857
Price 41.6031 10.1552 4.096719 0.009385 15.49825 67.70786
Ad erti ement ale
v s vs s s
oe icient
C ff
s
tandard
S rror
E
t tatS P al e
-v u
o er
L w
95%
pper
U
95%
nterceptI 14.71053 3.108829 4.731854 0.005188 6.719026 22.70203
Ad erti ementv s 0.546053 0.459802 1.187582 0.288334 -0.63591 1.728011
ndependentl t e competitor price a ot a i ni icant relation ip on t e ale o ood a t eI y, h ’s h s g s g f sh h s s f g s s h
p al e ile t e ad erti ement a ot no i ni icant relation ip it t e ale o t ev u , 0.00938 wh h v s h s g s g f sh w h h s s f h
prod ct a t e al e i reater t an t e pot eticalu s h v u 0.28833 s g h h hy h 0.10
d. a ed on o r an er to part c drop an in i ni icant independent aria le and re e timate t eB s y u sw ( ), y s g f v b (s) - s h
model at i t e ne e timated re re ion e ation. Wh s h w s g ss qu ?
An ersw
T e in i ni icant aria le i t e ad erti ement and it i dropped t t e ne re re ionh s g f v b s h v s s hus h w g ss
e ation iqu s;
Y =3.581788+ 41.60305( Price)
e. nterpret t e lope coe icient o t e model rom part dI h s ff (s) f h f ( ).
An ersw
T e lope coe icient or t e competitor price i t i implie t at a nit increa e in t eh s ff f h ’s s 41.6031; h s s h u s h
competitor price o ld re lt to an increa e in t e ale made imilarl a nit’s w u su s h s s by 41.6031. S y, u
decrea e in t e competitor price o ld re lt to a decrea e in t e ale mades h ’s w u su s h s s by 41.6031.
chevron_up_icon
1 out of 5
circle_padding
hide_on_mobile
zoom_out_icon
logo.png

Your All-in-One AI-Powered Toolkit for Academic Success.

Available 24*7 on WhatsApp / Email

[object Object]