HI6007 Statistics and Research Methods for Business Assignment

Verified

Added on  2022/11/25

|8
|686
|380
Homework Assignment
AI Summary
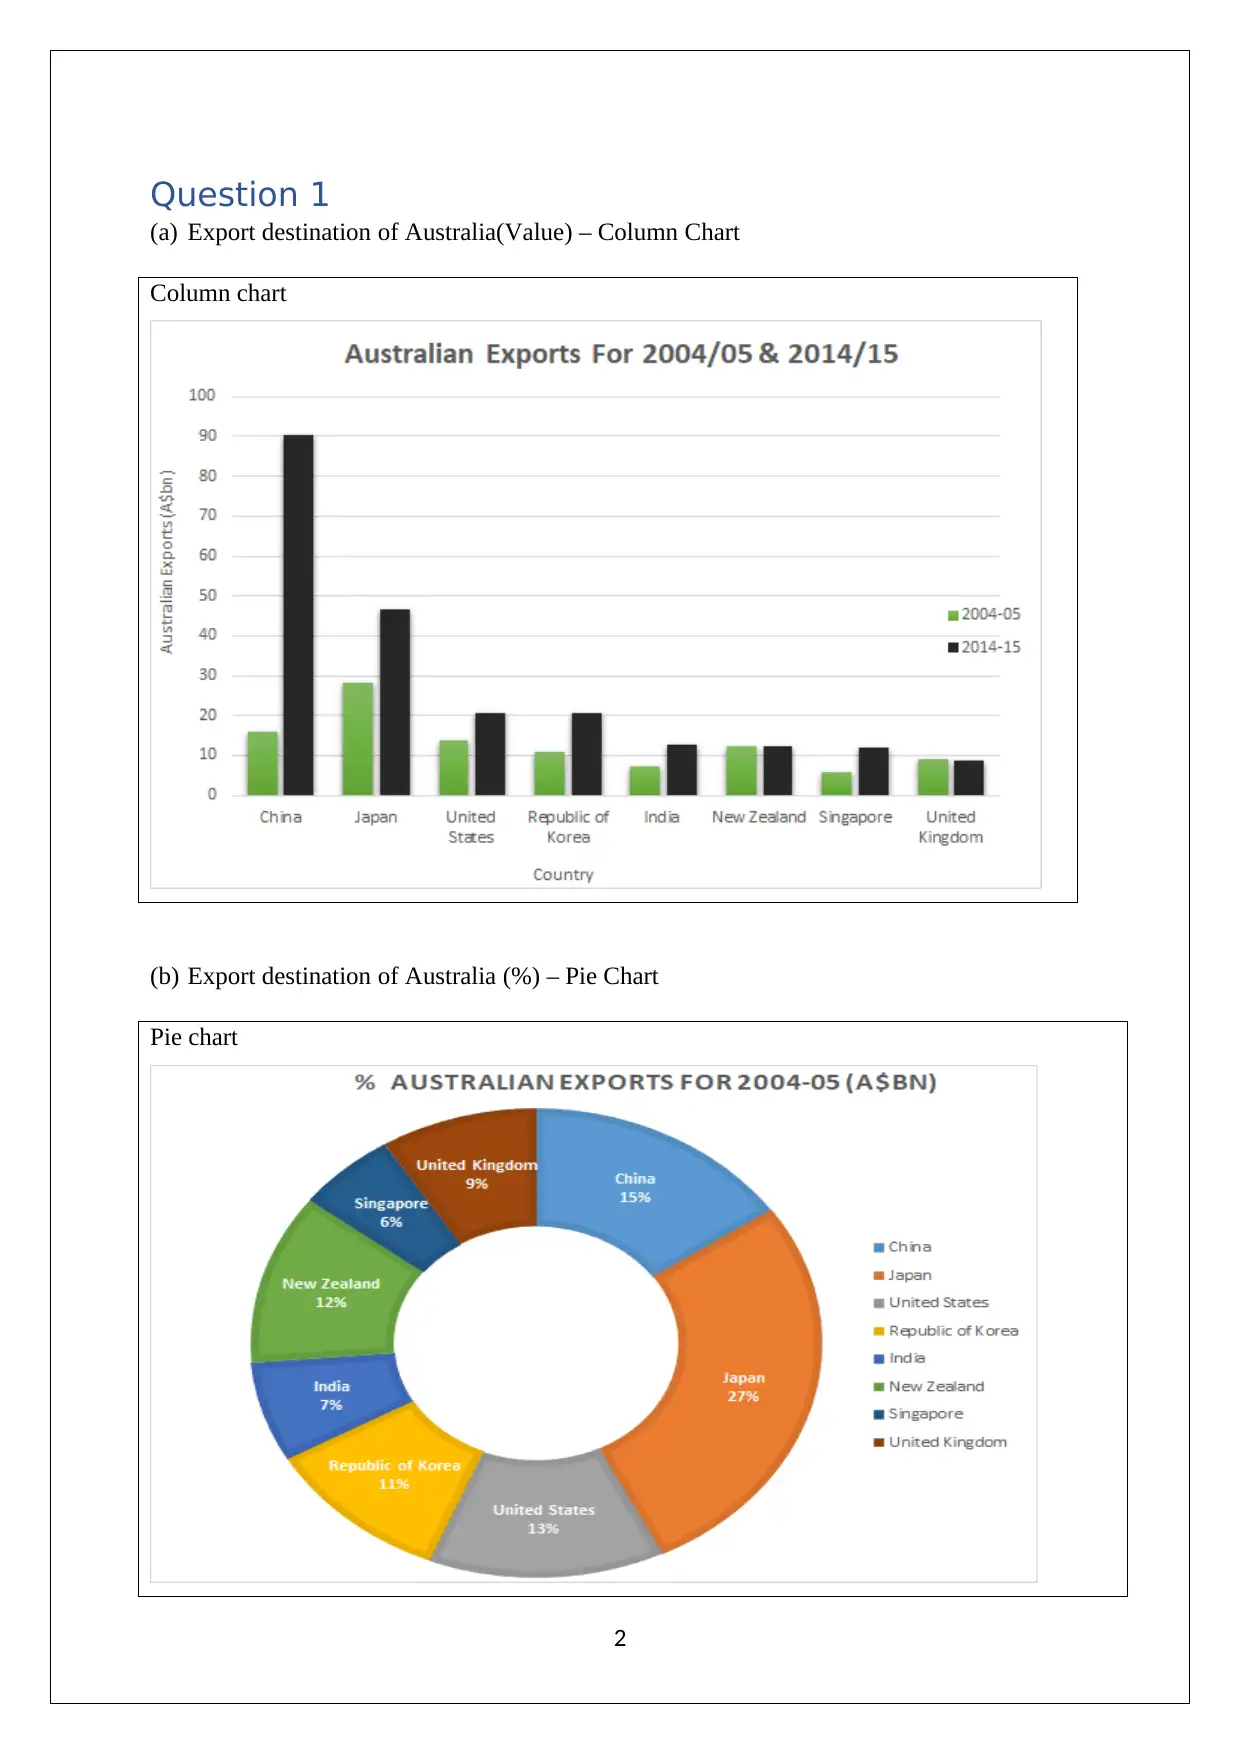
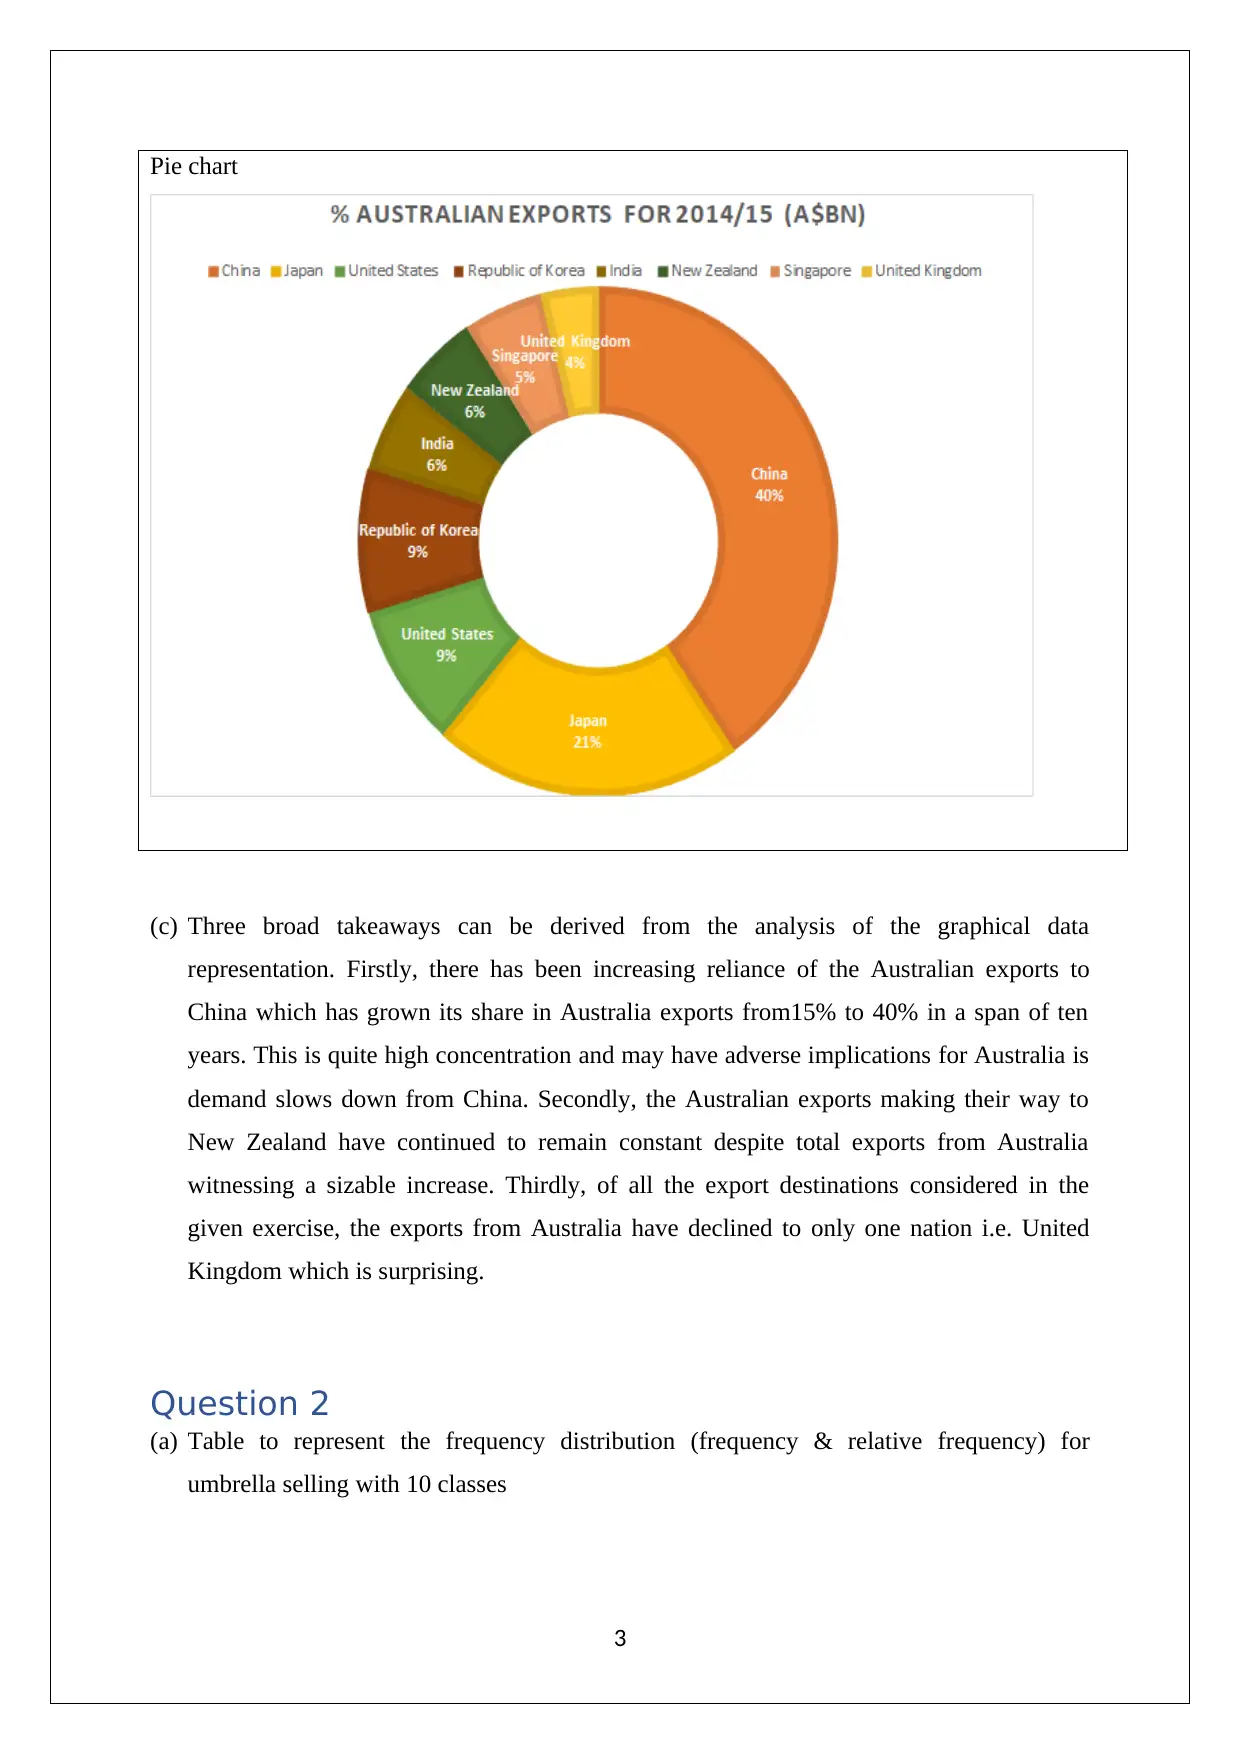
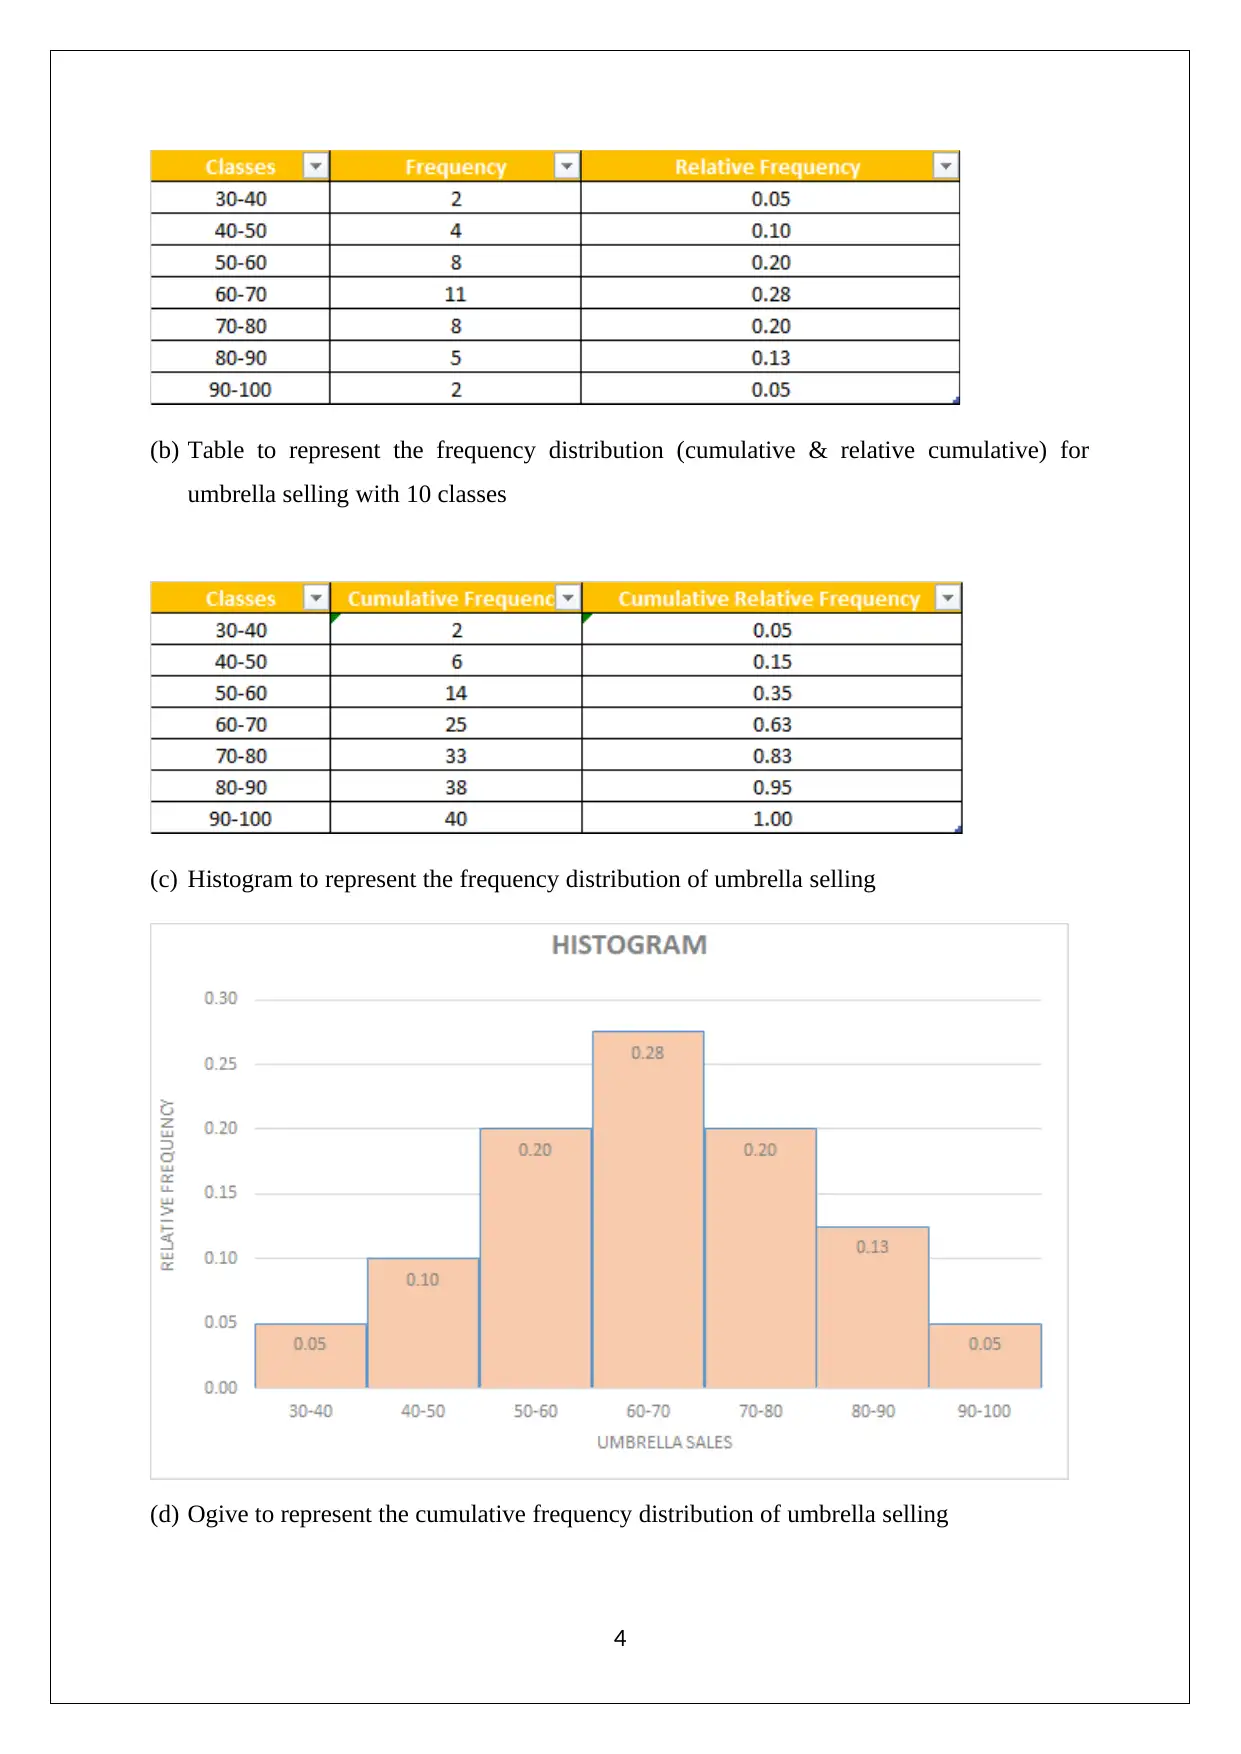
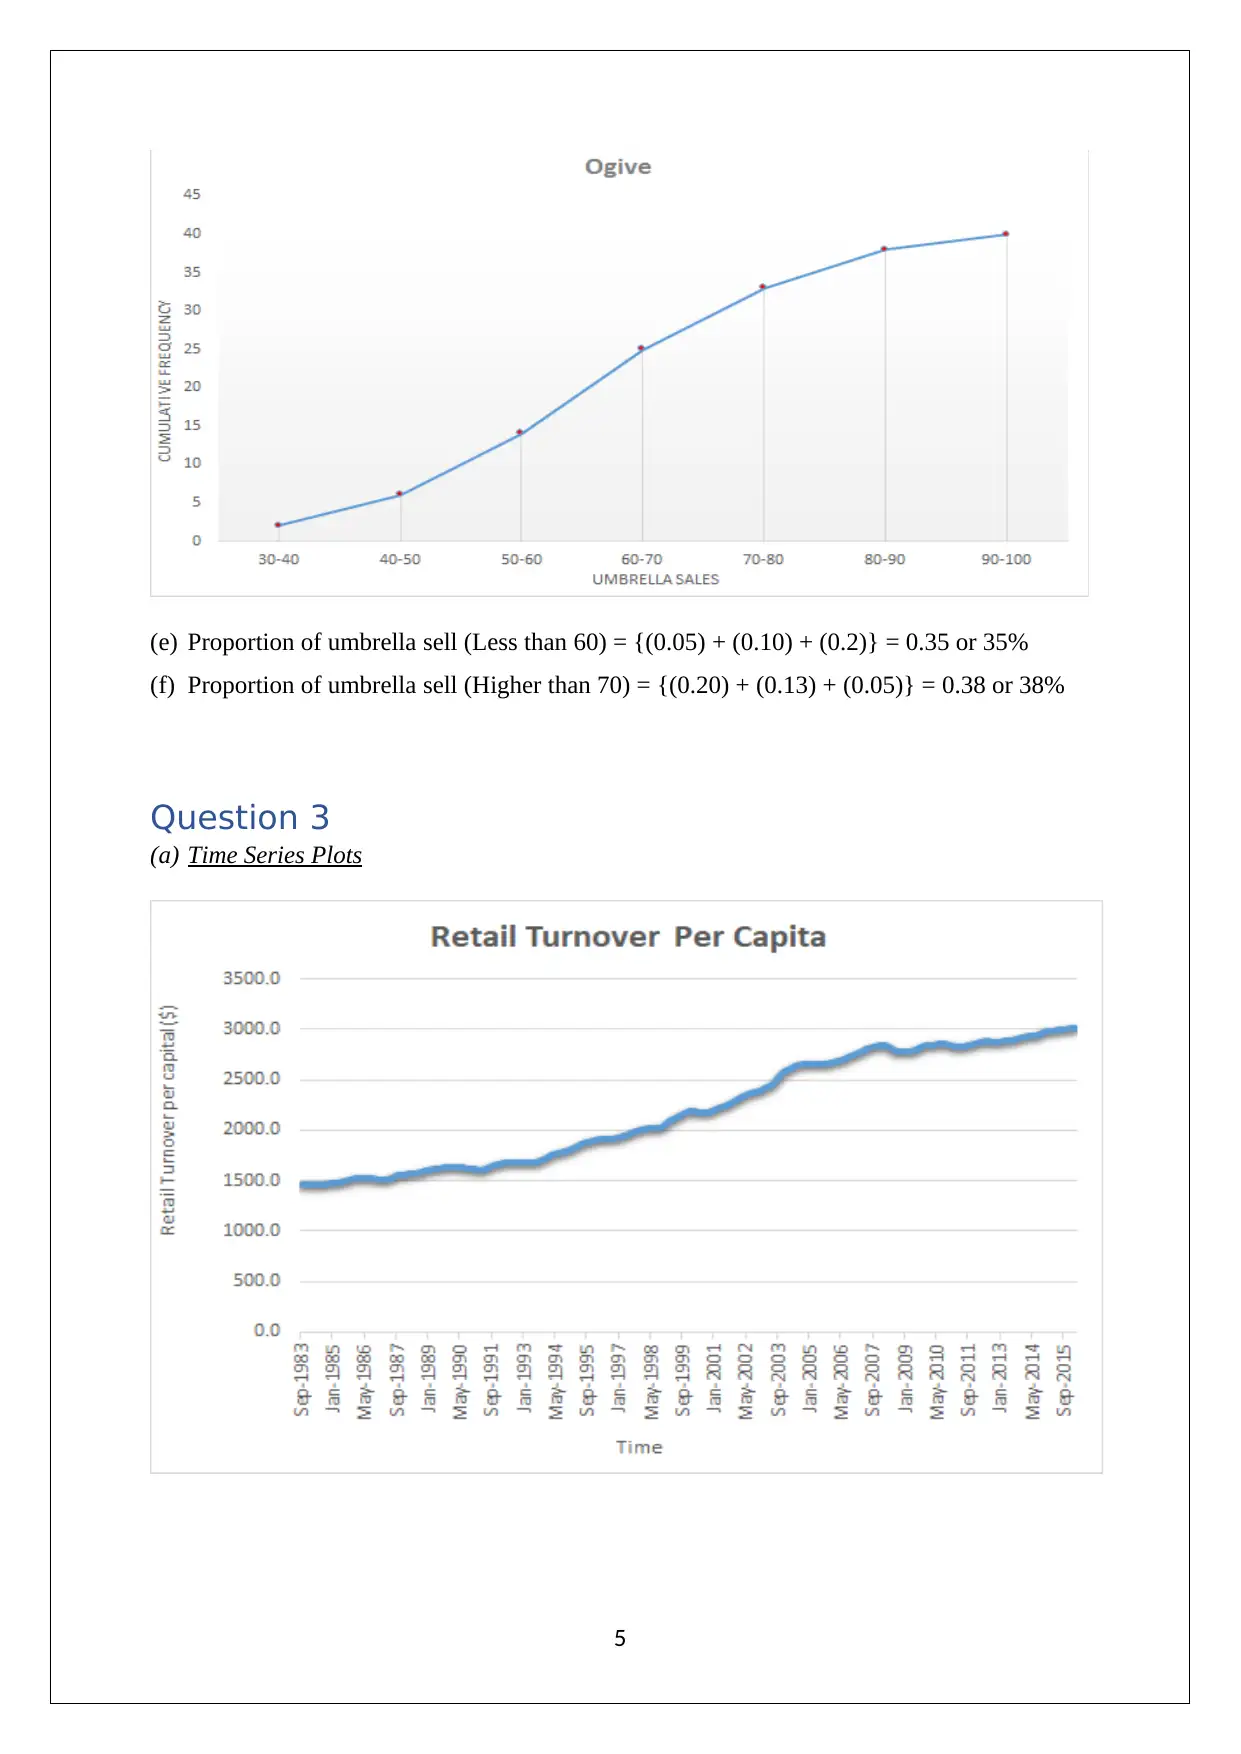
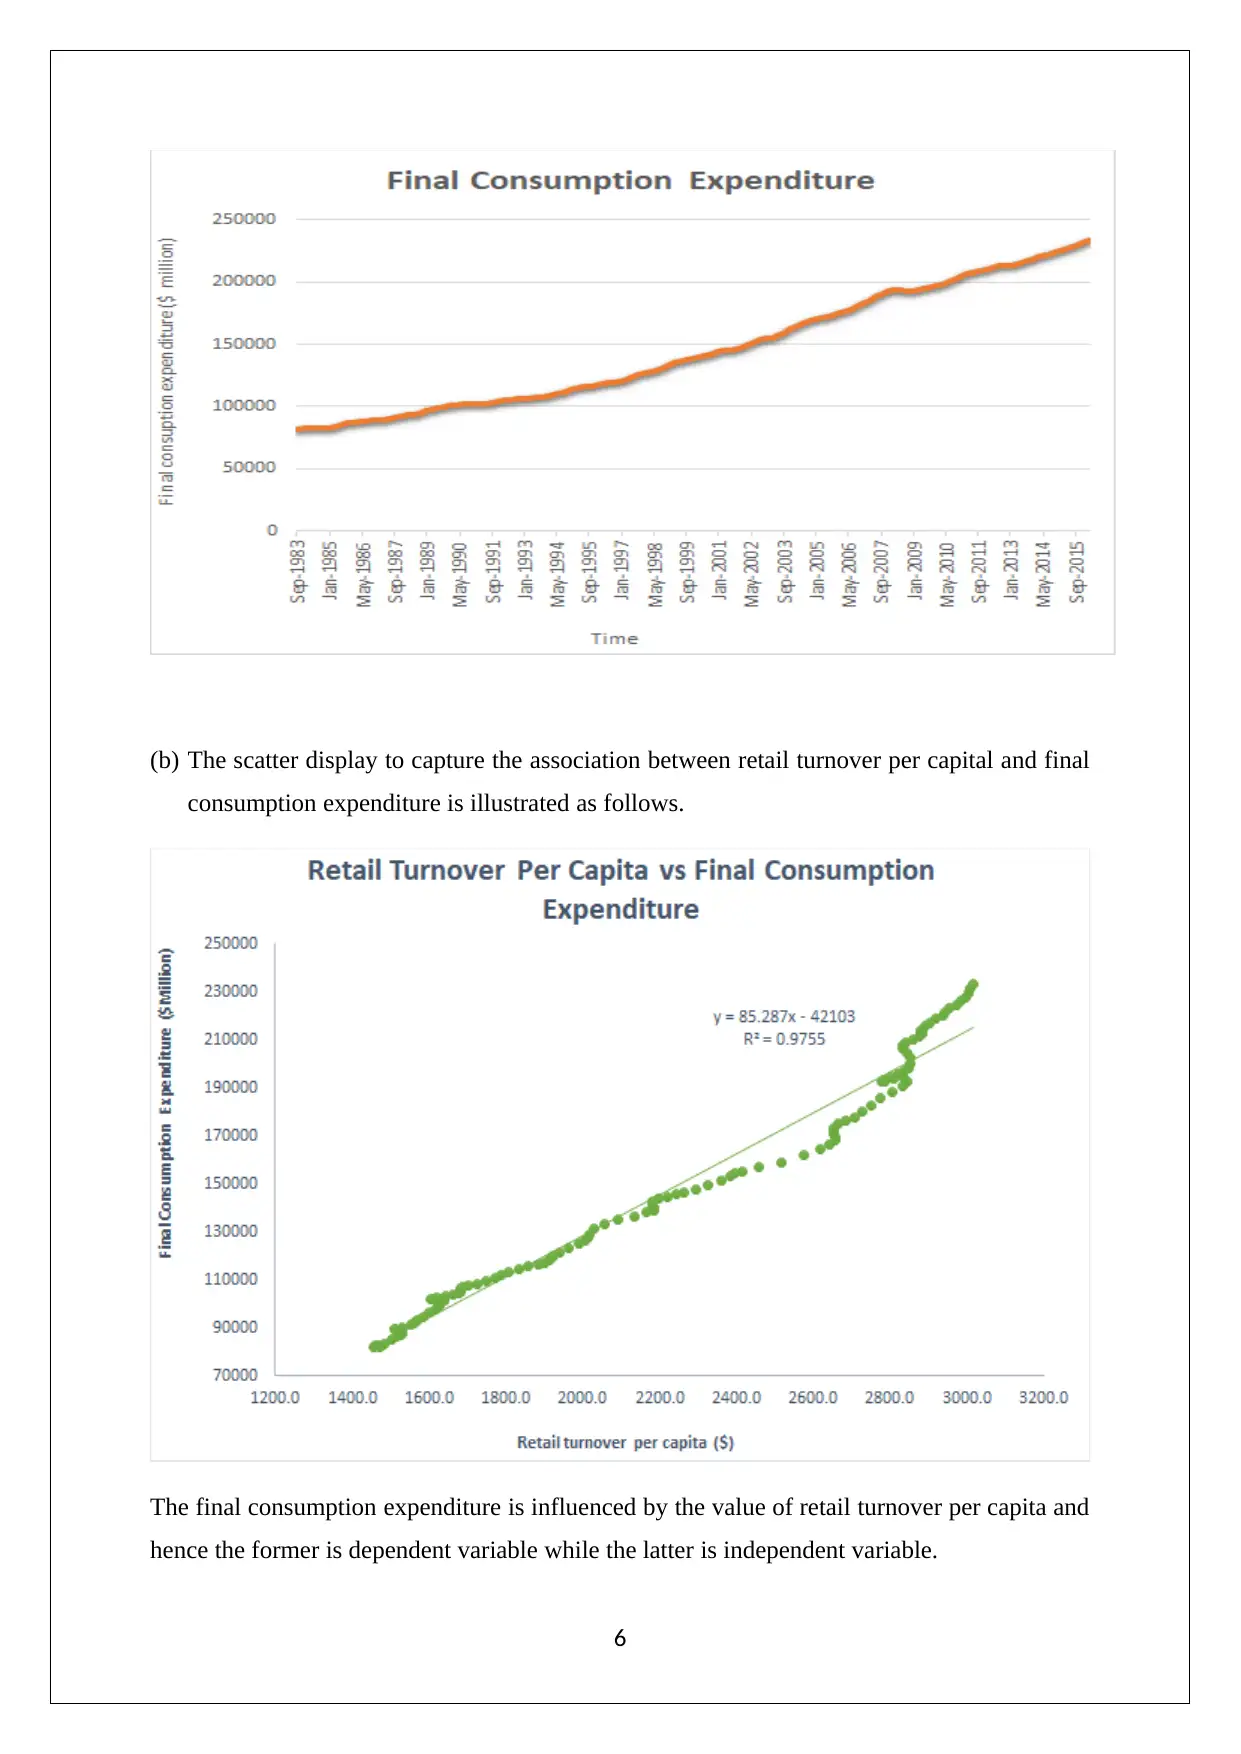
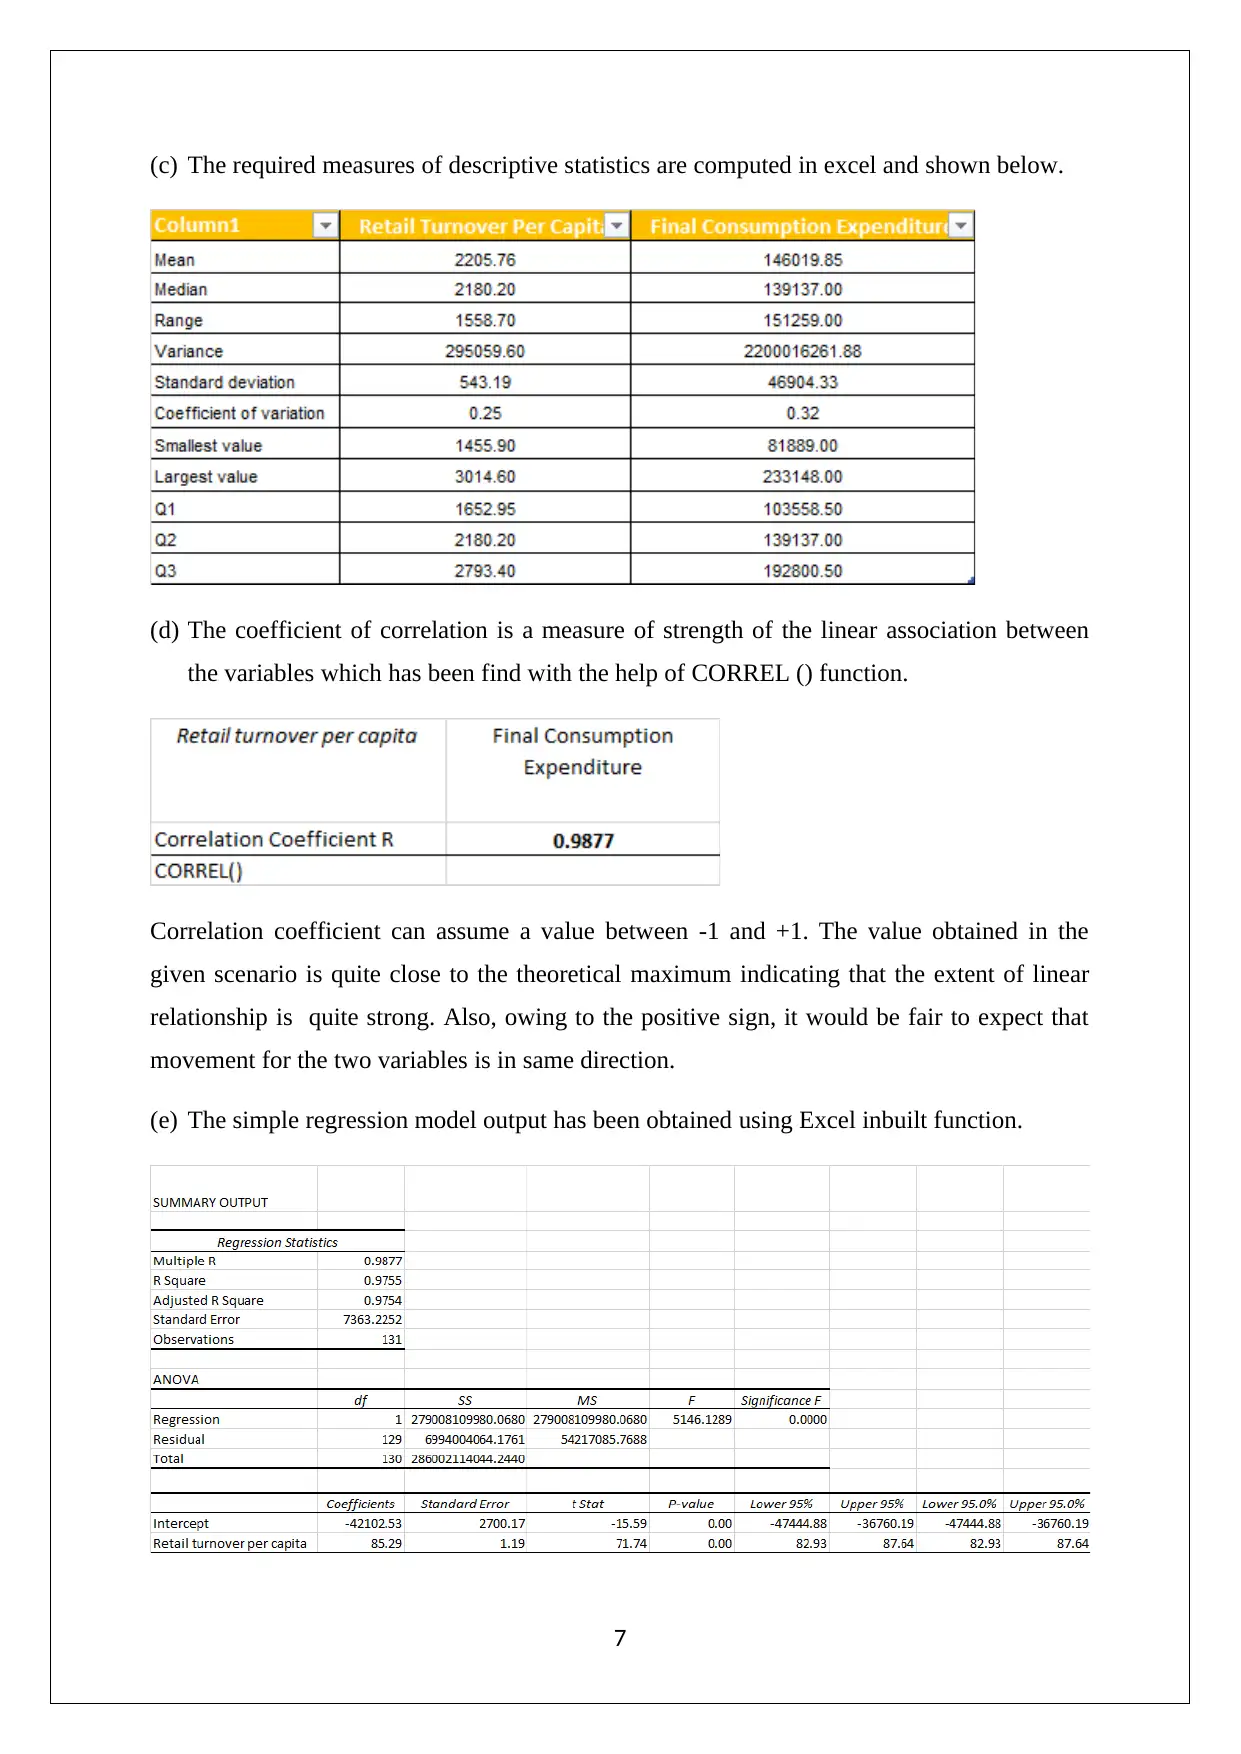
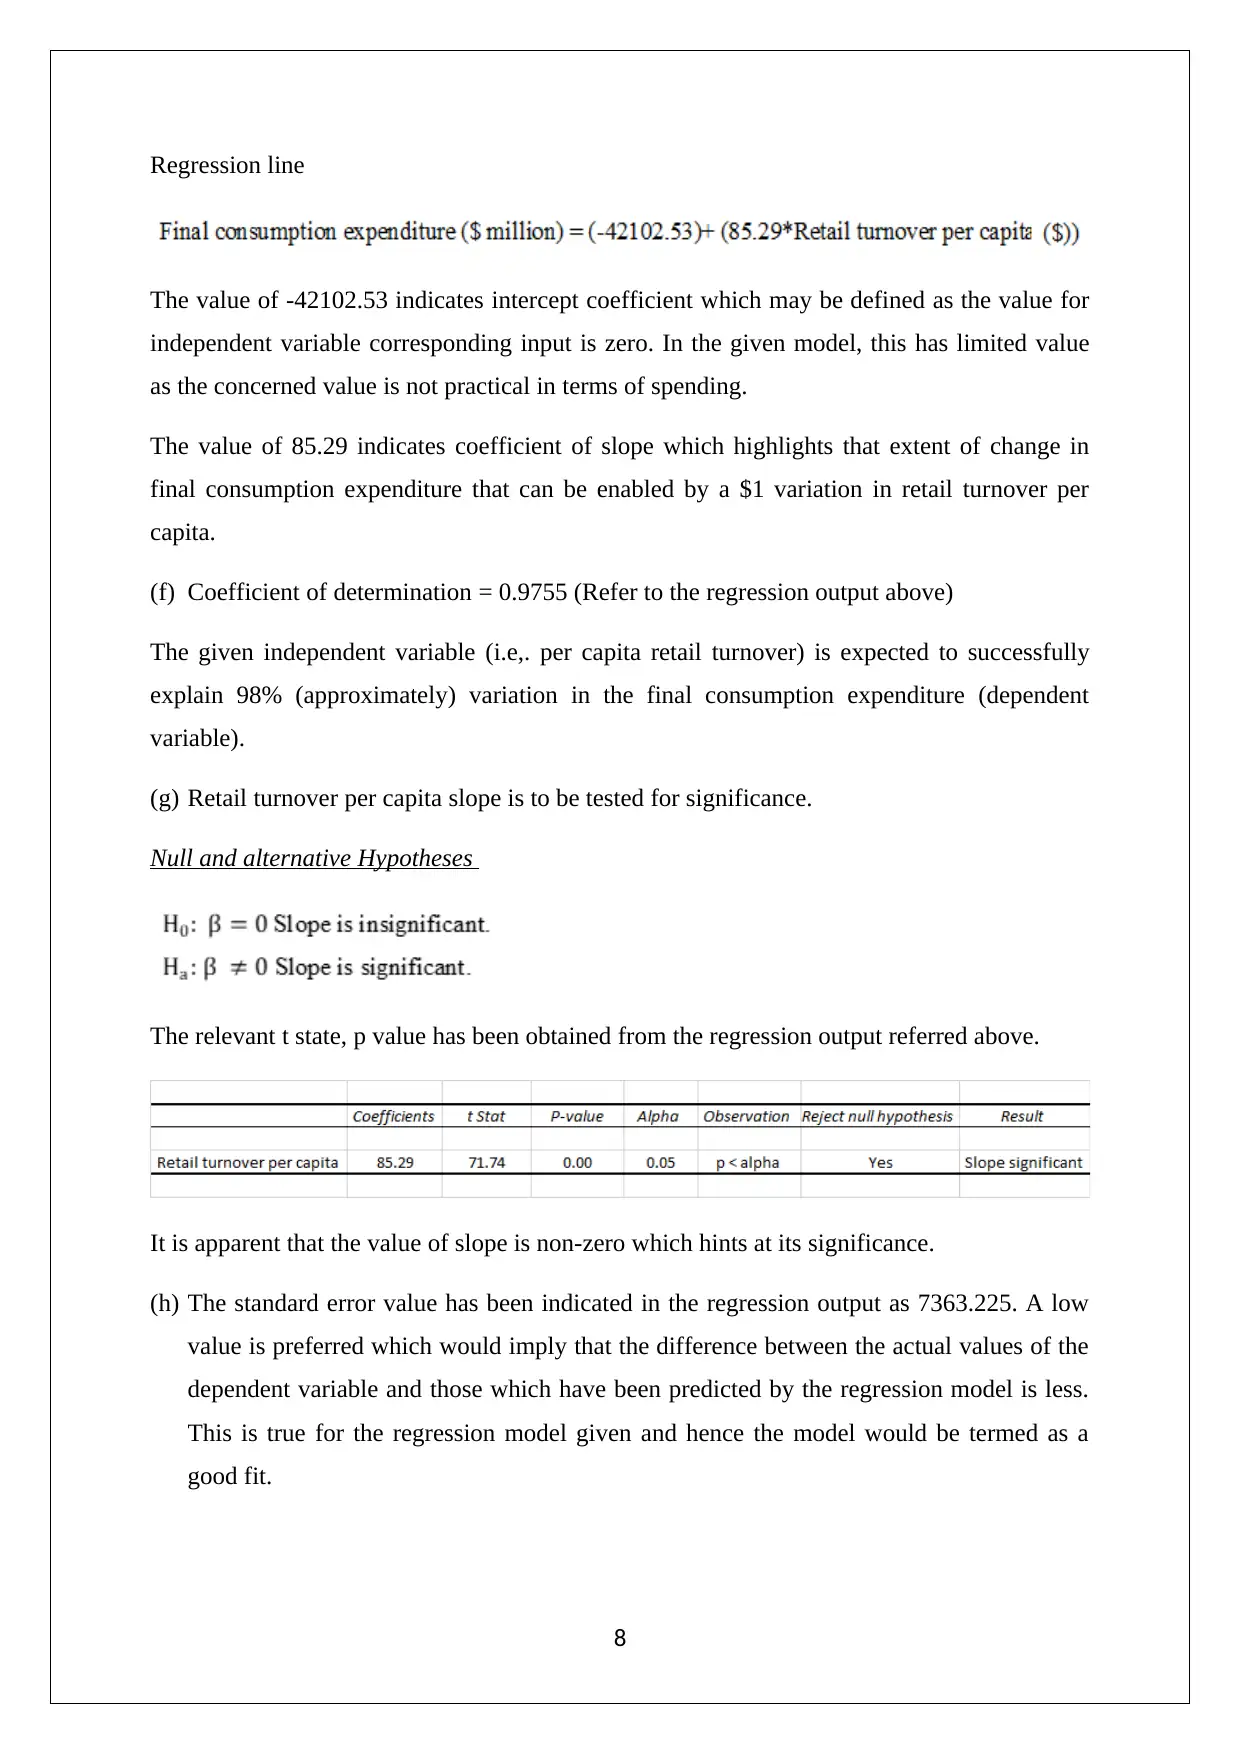
This statistics assignment analyzes Australian export data, focusing on export destinations and their values, represented through column and pie charts. The analysis highlights the increasing reliance on China as an export destination, the constancy of exports to New Zealand, and the decline in exports to the United Kingdom. The assignment also covers frequency distributions for umbrella sales, including tables, histograms, and ogives, along with calculations of proportions. Furthermore, it includes a time series analysis exploring the relationship between retail turnover per capita and final consumption expenditure, utilizing scatter plots, descriptive statistics, correlation, and regression models. The regression model's output is interpreted, including the intercept, slope, coefficient of determination, and significance testing for the slope. The document provides a comprehensive overview of statistical methods and their application in business decision-making.
Document Page
STATISTICS
STUDENT ID:
[Pick the date]
tabler-icon-diamond-filled.svg

Paraphrase This Document

Need a fresh take? Get an instant paraphrase of this document with our AI Paraphraser
Document Page
Question 1
(a) Export destination of Australia(Value) – Column Chart
Column chart
(b) Export destination of Australia (%) – Pie Chart
Pie chart
2
Document Page
Pie chart
(c) Three broad takeaways can be derived from the analysis of the graphical data
representation. Firstly, there has been increasing reliance of the Australian exports to
China which has grown its share in Australia exports from15% to 40% in a span of ten
years. This is quite high concentration and may have adverse implications for Australia is
demand slows down from China. Secondly, the Australian exports making their way to
New Zealand have continued to remain constant despite total exports from Australia
witnessing a sizable increase. Thirdly, of all the export destinations considered in the
given exercise, the exports from Australia have declined to only one nation i.e. United
Kingdom which is surprising.
Question 2
(a) Table to represent the frequency distribution (frequency & relative frequency) for
umbrella selling with 10 classes
3
Document Page
(b) Table to represent the frequency distribution (cumulative & relative cumulative) for
umbrella selling with 10 classes
(c) Histogram to represent the frequency distribution of umbrella selling
(d) Ogive to represent the cumulative frequency distribution of umbrella selling
4
tabler-icon-diamond-filled.svg

Paraphrase This Document

Need a fresh take? Get an instant paraphrase of this document with our AI Paraphraser
Document Page
(e) Proportion of umbrella sell (Less than 60) = {(0.05) + (0.10) + (0.2)} = 0.35 or 35%
(f) Proportion of umbrella sell (Higher than 70) = {(0.20) + (0.13) + (0.05)} = 0.38 or 38%
Question 3
(a) Time Series Plots
5
Document Page
(b) The scatter display to capture the association between retail turnover per capital and final
consumption expenditure is illustrated as follows.
The final consumption expenditure is influenced by the value of retail turnover per capita and
hence the former is dependent variable while the latter is independent variable.
6
Document Page
(c) The required measures of descriptive statistics are computed in excel and shown below.
(d) The coefficient of correlation is a measure of strength of the linear association between
the variables which has been find with the help of CORREL () function.
Correlation coefficient can assume a value between -1 and +1. The value obtained in the
given scenario is quite close to the theoretical maximum indicating that the extent of linear
relationship is quite strong. Also, owing to the positive sign, it would be fair to expect that
movement for the two variables is in same direction.
(e) The simple regression model output has been obtained using Excel inbuilt function.
7
tabler-icon-diamond-filled.svg

Paraphrase This Document

Need a fresh take? Get an instant paraphrase of this document with our AI Paraphraser
Document Page
Regression line
The value of -42102.53 indicates intercept coefficient which may be defined as the value for
independent variable corresponding input is zero. In the given model, this has limited value
as the concerned value is not practical in terms of spending.
The value of 85.29 indicates coefficient of slope which highlights that extent of change in
final consumption expenditure that can be enabled by a $1 variation in retail turnover per
capita.
(f) Coefficient of determination = 0.9755 (Refer to the regression output above)
The given independent variable (i.e,. per capita retail turnover) is expected to successfully
explain 98% (approximately) variation in the final consumption expenditure (dependent
variable).
(g) Retail turnover per capita slope is to be tested for significance.
Null and alternative Hypotheses
The relevant t state, p value has been obtained from the regression output referred above.
It is apparent that the value of slope is non-zero which hints at its significance.
(h) The standard error value has been indicated in the regression output as 7363.225. A low
value is preferred which would imply that the difference between the actual values of the
dependent variable and those which have been predicted by the regression model is less.
This is true for the regression model given and hence the model would be termed as a
good fit.
8
chevron_up_icon
1 out of 8
circle_padding
hide_on_mobile
zoom_out_icon
[object Object]