Holmes Institute HC2022: Market Research Individual Report Analysis
VerifiedAdded on 2023/01/05
|10
|2117
|91
Report
AI Summary
This report presents a market research analysis focusing on the Australian real estate market, addressing challenges related to fluctuating consumer needs and housing demands. The study utilizes secondary data collection to understand family and household structures. The research process includes defining the problem for SKY HIGH Real Estate, planning the research design with a quantitative approach, and planning the sample using data from 2012-2013. Data collection involves analyzing sources like the Australian Bureau of Statistics (ABS) to gather information on language, religious affiliation, employment, and dwelling structures. The report analyzes the data to formulate conclusions and recommendations for the real estate company, suggesting strategies such as effective communication, business alliances, and utilization of modern technology to enhance competitiveness and customer relationships.
Running head: MARKET RESEARCH
Market Research
Market Research
Paraphrase This Document
Need a fresh take? Get an instant paraphrase of this document with our AI Paraphraser
MARKET RESEARCH 2
Table of Contents
1. Introduction....................................................................................................................3
2. The research Process....................................................................................................3
2.1. Define the Problem.....................................................................................................3
2.2. Planning the research design.....................................................................................3
2.3. Planning the sample...................................................................................................3
2.4 Collecting the data.......................................................................................................3
2.5 Analysing the Data.......................................................................................................8
3. Formulating conclusions................................................................................................8
References.......................................................................................................................10
MARKET RESEARCH 3
1. Introduction
The property dealer deals with challenges caused of fluctuation in needs and
requirements of families and households. It is addressed that a large number of person
are immigrating as well as, there are fewer houses, which might create an issue for
dealers to manage demand and supply in the market. In this study, secondary data
collection tool is practiced to get the conceptual information related to family as well as
households structure of Australia.
2. The research Process
2.1. Define the Problem
For sustaining the business of SKY HIGH Real Estate, developer could use marketing
research tool to know the expectation of consumers as well as, their demand for house.
It would lead to the organization to enhance its profitability in minimum resources
(Turnerand Guilding, 2014). Therefore, developers of this organization needs to
comprehend different approaches for transforming the system in next 20 years. It would
permit the organization to make effective plan for managing demand and supply of
houses in Australian market for upcoming 20 years.
2.2. Planning the research design
With the purpose of this study, the quantitative method would be preferred in evaluating
the research problems that are associated with real estate business (Gopalanand
Venkataraman, 2015). The qualitative method could practice to deeply understand the
ways due to which, particular concern could be solved. Further, it is evaluated the
secondary data collection method can be obtained by entailing certain sources named
as family characteristics and Australian bureau of statistics. These sites have been
permitted to get factual information towards the study issue.
2.3. Planning the sample
The data was associated with families as well as households structure of Australian.
Furthermore, data related to 2012-2013 years has been considered to make a plan for
20 years in retail sectors. It can be imperative to collect the depth data towards
employment, religious, language, employment types, and employment hours. It can be
also vital in making effective plan for the organization.
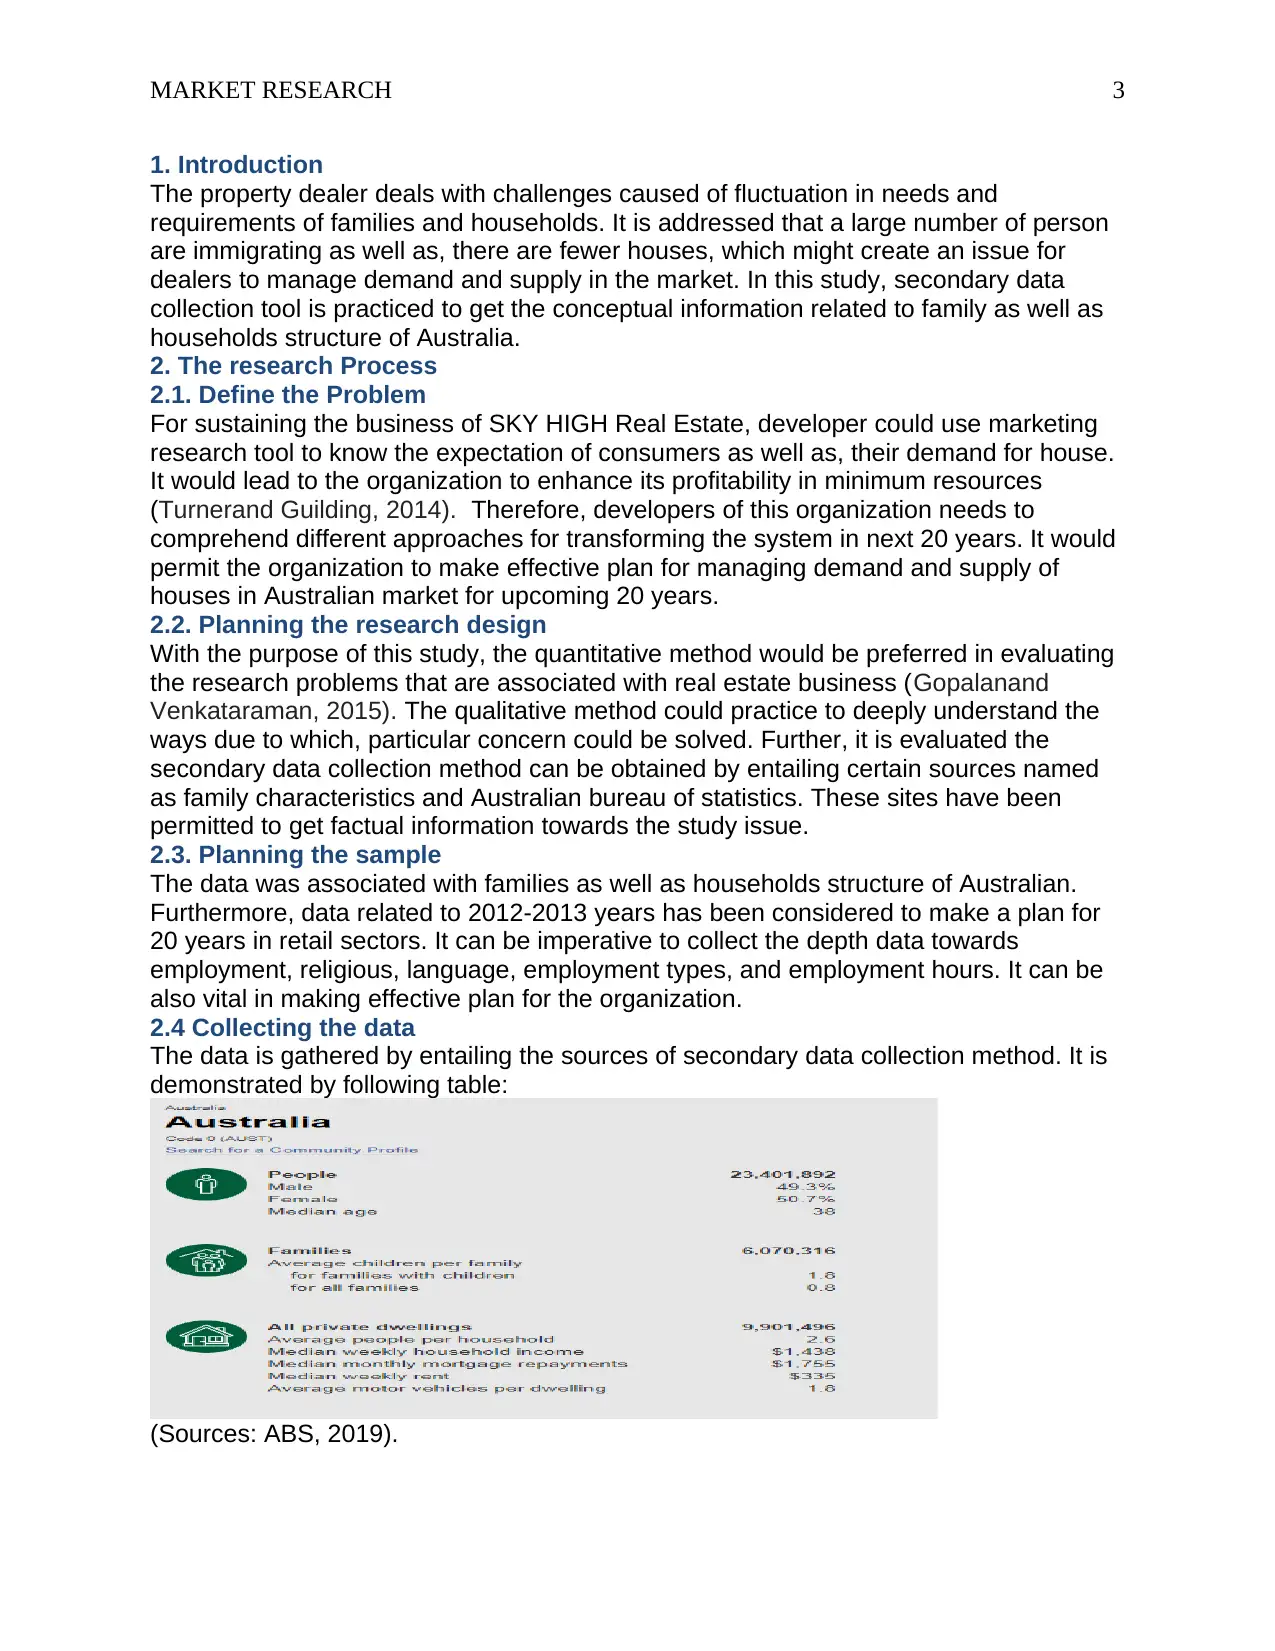
2.4 Collecting the data
The data is gathered by entailing the sources of secondary data collection method. It is
demonstrated by following table:
(Sources: ABS, 2019).
1. Introduction
The property dealer deals with challenges caused of fluctuation in needs and
requirements of families and households. It is addressed that a large number of person
are immigrating as well as, there are fewer houses, which might create an issue for
dealers to manage demand and supply in the market. In this study, secondary data
collection tool is practiced to get the conceptual information related to family as well as
households structure of Australia.
2. The research Process
2.1. Define the Problem
For sustaining the business of SKY HIGH Real Estate, developer could use marketing
research tool to know the expectation of consumers as well as, their demand for house.
It would lead to the organization to enhance its profitability in minimum resources
(Turnerand Guilding, 2014). Therefore, developers of this organization needs to
comprehend different approaches for transforming the system in next 20 years. It would
permit the organization to make effective plan for managing demand and supply of
houses in Australian market for upcoming 20 years.
2.2. Planning the research design
With the purpose of this study, the quantitative method would be preferred in evaluating
the research problems that are associated with real estate business (Gopalanand
Venkataraman, 2015). The qualitative method could practice to deeply understand the
ways due to which, particular concern could be solved. Further, it is evaluated the
secondary data collection method can be obtained by entailing certain sources named
as family characteristics and Australian bureau of statistics. These sites have been
permitted to get factual information towards the study issue.
2.3. Planning the sample
The data was associated with families as well as households structure of Australian.
Furthermore, data related to 2012-2013 years has been considered to make a plan for
20 years in retail sectors. It can be imperative to collect the depth data towards
employment, religious, language, employment types, and employment hours. It can be
also vital in making effective plan for the organization.
2.4 Collecting the data
The data is gathered by entailing the sources of secondary data collection method. It is
demonstrated by following table:
(Sources: ABS, 2019).
⊘ This is a preview!⊘
Do you want full access?
Subscribe today to unlock all pages.
Trusted by 1+ million students worldwide
MARKET RESEARCH 4
(Sources: ABS, 2019).
Language, top responses
(other than English)
Australia % 2011 %
Mandarin 596,711 2.5 336,410 1.6
Arabic 321,728 1.4 287,174 1.3
Cantonese 280,943 1.2 263,673 1.2
Vietnamese 277,400 1.2 233,390 1.1
Italian 271,597 1.2 299,833 1.4
English only spoken at home 17,020,417 72.7 16,509,291 76.8
Households where a non
English language is spoken
1,971,011 22.2 1,591,908 20.5
(Sources: ABS, 2019).
Religious affiliation, top
responses
Australia % 2011 %
No Religion, so described 6,933,708 29.6 4,693,162 21.8
Catholic 5,291,834 22.6 5,439,267 25.3
Anglican 3,101,185 13.3 3,679,907 17.1
Not stated 2,238,735 9.6 1,972,252 9.2
Uniting Church 870,183 3.7 1,065,794 5.0
(Sources: ABS, 2019).
Employment Australia % 2011 %
Worked full-
time
6,623,065 57.7 6,367,555 59.7
Worked part-
time
3,491,503 30.4 3,062,977 28.7
Away from
work
569,276 5.0 627,798 5.9
(Sources: ABS, 2019).
Language, top responses
(other than English)
Australia % 2011 %
Mandarin 596,711 2.5 336,410 1.6
Arabic 321,728 1.4 287,174 1.3
Cantonese 280,943 1.2 263,673 1.2
Vietnamese 277,400 1.2 233,390 1.1
Italian 271,597 1.2 299,833 1.4
English only spoken at home 17,020,417 72.7 16,509,291 76.8
Households where a non
English language is spoken
1,971,011 22.2 1,591,908 20.5
(Sources: ABS, 2019).
Religious affiliation, top
responses
Australia % 2011 %
No Religion, so described 6,933,708 29.6 4,693,162 21.8
Catholic 5,291,834 22.6 5,439,267 25.3
Anglican 3,101,185 13.3 3,679,907 17.1
Not stated 2,238,735 9.6 1,972,252 9.2
Uniting Church 870,183 3.7 1,065,794 5.0
(Sources: ABS, 2019).
Employment Australia % 2011 %
Worked full-
time
6,623,065 57.7 6,367,555 59.7
Worked part-
time
3,491,503 30.4 3,062,977 28.7
Away from
work
569,276 5.0 627,798 5.9
Paraphrase This Document
Need a fresh take? Get an instant paraphrase of this document with our AI Paraphraser
MARKET RESEARCH 5
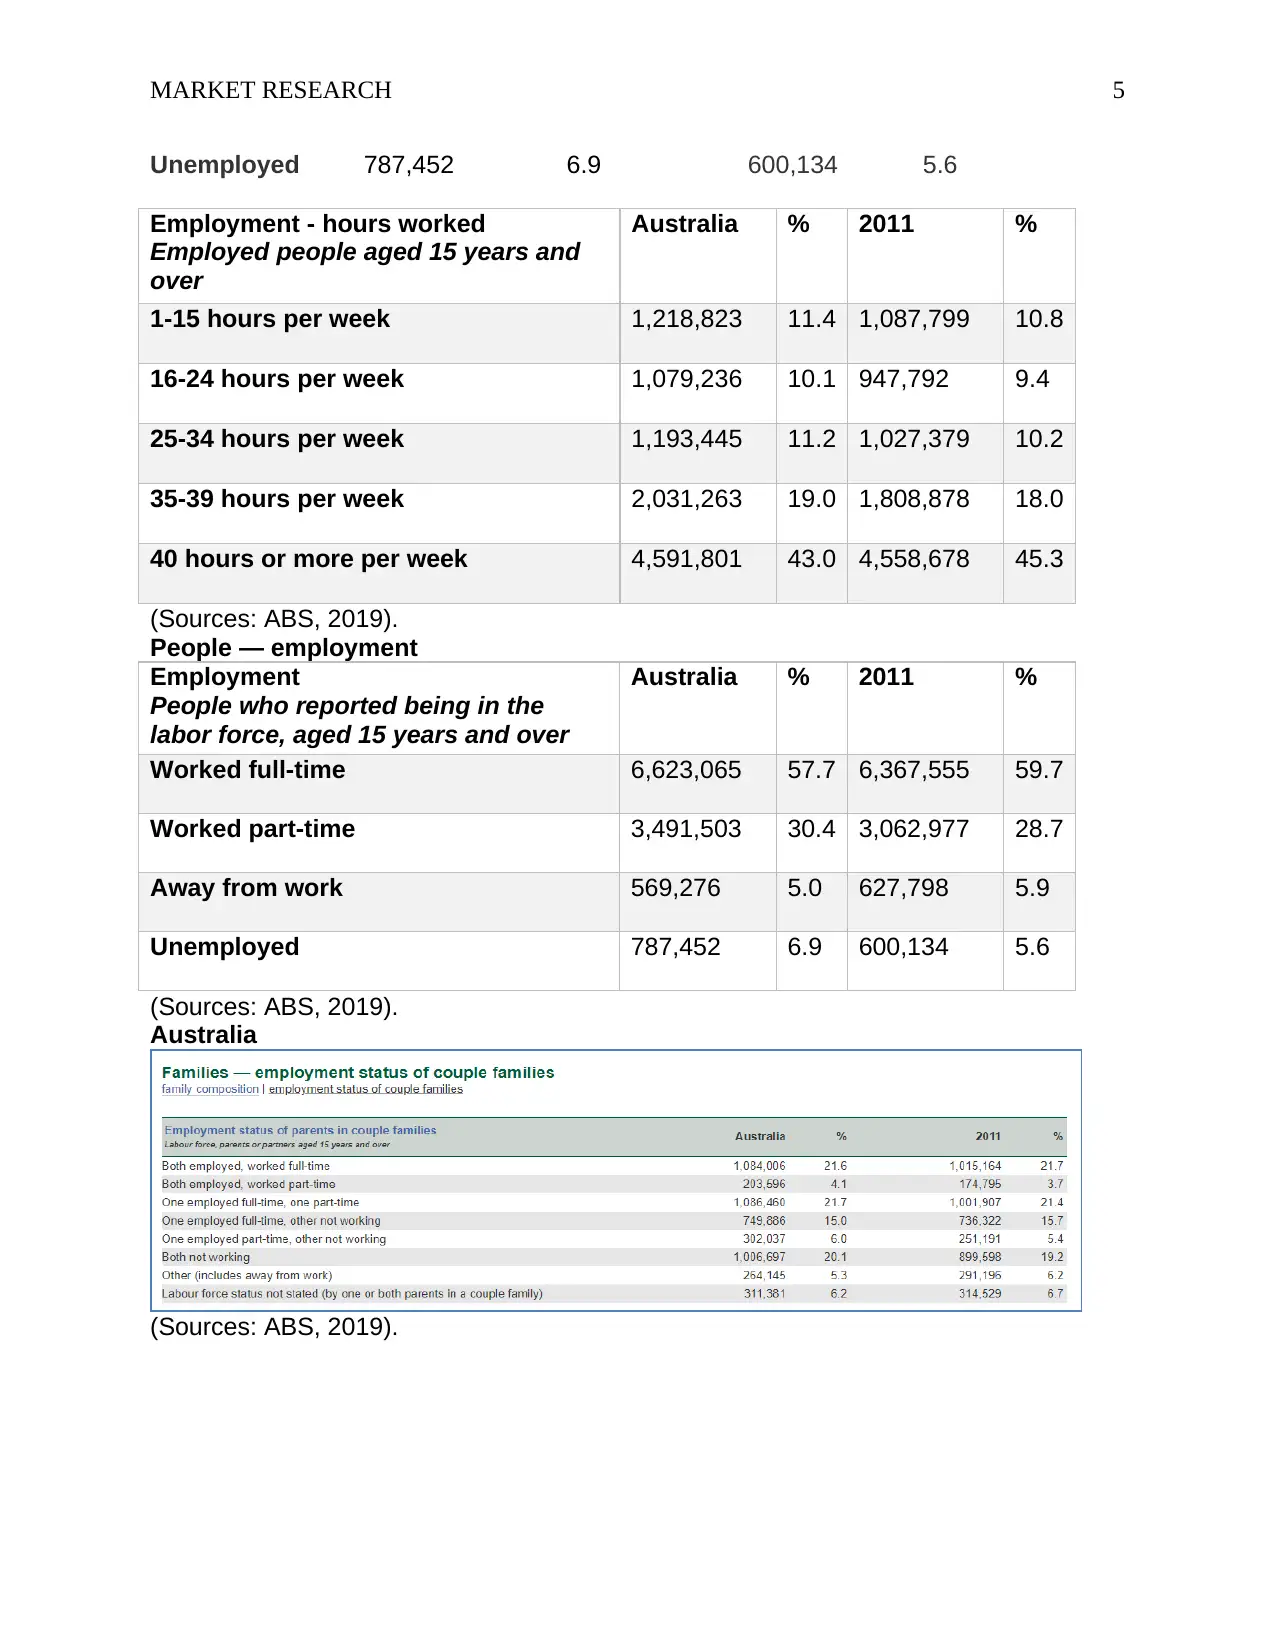
Unemployed 787,452 6.9 600,134 5.6
Employment - hours worked
Employed people aged 15 years and
over
Australia % 2011 %
1-15 hours per week 1,218,823 11.4 1,087,799 10.8
16-24 hours per week 1,079,236 10.1 947,792 9.4
25-34 hours per week 1,193,445 11.2 1,027,379 10.2
35-39 hours per week 2,031,263 19.0 1,808,878 18.0
40 hours or more per week 4,591,801 43.0 4,558,678 45.3
(Sources: ABS, 2019).
People — employment
Employment
People who reported being in the
labor force, aged 15 years and over
Australia % 2011 %
Worked full-time 6,623,065 57.7 6,367,555 59.7
Worked part-time 3,491,503 30.4 3,062,977 28.7
Away from work 569,276 5.0 627,798 5.9
Unemployed 787,452 6.9 600,134 5.6
(Sources: ABS, 2019).
Australia
(Sources: ABS, 2019).
Unemployed 787,452 6.9 600,134 5.6
Employment - hours worked
Employed people aged 15 years and
over
Australia % 2011 %
1-15 hours per week 1,218,823 11.4 1,087,799 10.8
16-24 hours per week 1,079,236 10.1 947,792 9.4
25-34 hours per week 1,193,445 11.2 1,027,379 10.2
35-39 hours per week 2,031,263 19.0 1,808,878 18.0
40 hours or more per week 4,591,801 43.0 4,558,678 45.3
(Sources: ABS, 2019).
People — employment
Employment
People who reported being in the
labor force, aged 15 years and over
Australia % 2011 %
Worked full-time 6,623,065 57.7 6,367,555 59.7
Worked part-time 3,491,503 30.4 3,062,977 28.7
Away from work 569,276 5.0 627,798 5.9
Unemployed 787,452 6.9 600,134 5.6
(Sources: ABS, 2019).
Australia
(Sources: ABS, 2019).
MARKET RESEARCH 6
(Sources: ABS, 2019).
Occupation
Employed people aged 15 years and
over
Australia % 2011 %
Professionals 2,370,966 22.2 2,145,442 21.3
Clerical and Administrative Workers 1,449,681 13.6 1,483,559 14.7
Technicians and Trades Workers 1,447,414 13.5 1,425,146 14.2
Managers 1,390,047 13.0 1,293,970 12.9
Community and Personal Service
Workers
1,157,003 10.8 971,898 9.7
Labourers 1,011,520 9.5 947,608 9.4
Sales Workers 1,000,955 9.4 942,140 9.4
Machinery Operators and Drivers 670,106 6.3 659,551 6.6
(Sources: ABS, 2019).
Industry of employment
The industry of
employment, top
responses
Australi
a
% 2011 %
Hospitals (except
Psychiatric Hospitals)
411,808 3.9 358,989 3.6
Supermarket and Grocery
Stores
254,275 2.4 235,773 2.3
Cafes and Restaurants 253,385 2.4 178,462 1.8
Primary Education 231,198 2.2 205,282 2.0
Aged Care Residential 211,621 2.0 165,485
(Sources: ABS, 2019).
Occupation
Employed people aged 15 years and
over
Australia % 2011 %
Professionals 2,370,966 22.2 2,145,442 21.3
Clerical and Administrative Workers 1,449,681 13.6 1,483,559 14.7
Technicians and Trades Workers 1,447,414 13.5 1,425,146 14.2
Managers 1,390,047 13.0 1,293,970 12.9
Community and Personal Service
Workers
1,157,003 10.8 971,898 9.7
Labourers 1,011,520 9.5 947,608 9.4
Sales Workers 1,000,955 9.4 942,140 9.4
Machinery Operators and Drivers 670,106 6.3 659,551 6.6
(Sources: ABS, 2019).
Industry of employment
The industry of
employment, top
responses
Australi
a
% 2011 %
Hospitals (except
Psychiatric Hospitals)
411,808 3.9 358,989 3.6
Supermarket and Grocery
Stores
254,275 2.4 235,773 2.3
Cafes and Restaurants 253,385 2.4 178,462 1.8
Primary Education 231,198 2.2 205,282 2.0
Aged Care Residential 211,621 2.0 165,485
⊘ This is a preview!⊘
Do you want full access?
Subscribe today to unlock all pages.
Trusted by 1+ million students worldwide
MARKET RESEARCH 7
Services
(Sources: ABS, 2019).
Dwelling structure
Dwellings Australia % 2011 %
Occupied
private
dwellings
8,286,073 88.8 7,760,314 89.3
Unoccupied
private
dwellings
1,039,874 11.2 934,471 10.7
(Sources: ABS, 2019).
Dwellings
Structure
Australia % 2011 %
Separate
house
6,041,788 72.9 5,864,573 75.6
Semi-
detached, row
or terrace
house,
townhouse
etc
1,055,016 12.7 765,980 9.9
Flat or
apartment
1,087,434 13.1 1,056,236 13.6
Other
dwelling
64,425 0.8 66,662 0.9
(Sources: ABS, 2019).
Ancestry, top
responses
Australia % 2011 %
English 7,852,224 25.0 7,238,533 25.9
Australian 7,298,243 23.3 7,098,486 25.4
Irish 2,388,058 7.6 2,087,758 7.5
Scottish 2,023,470 6.4 1,792,622 6.4
Chinese 1,213,903 3.9 866,208 3.1
(Sources: ABS, 2019).
Unpaid work
People aged 15 years and
over
Australia % 2011 %
Did unpaid domestic work
(last week)
13,143,914 69.0 12,149,347 70.0
Cared for child/children (last
two weeks)
5,259,400 27.6 4,827,807 27.8
Provided unpaid assistance to 2,145,203 11.3 1,896,955 10.9
Paraphrase This Document
Need a fresh take? Get an instant paraphrase of this document with our AI Paraphraser
MARKET RESEARCH 8
a person with a disability (last
two weeks)
Did voluntary work through an
organisation or group (last 12
months)
3,620,726 19.0 3,090,875 17.8
(Sources: ABS, 2019).
Unpaid domestic work, number
of hours
People aged 15 years and over
Australia % 2011 %
Less than 5 hours per week 4,298,593 22.6 3,883,357 22.4
5 to 14 hours per week 4,944,578 26.0 4,444,640 25.6
15 to 29 hours per week 2,189,776 11.5 2,075,154 12.0
30 hours or more per week 1,710,970 9.0 1,746,196 10.1
(Sources: ABS, 2019).
Dwelling internet
connection
Australia % 2011 %
Internet not accessed
from dwelling
1,172,415 14.1 1,525,107 19.7
Internet accessed from
dwelling
6,892,165 83.2 5,962,954 76.8
Not stated 221,494 2.7 272,254 3.5
(Sources: ABS, 2019).
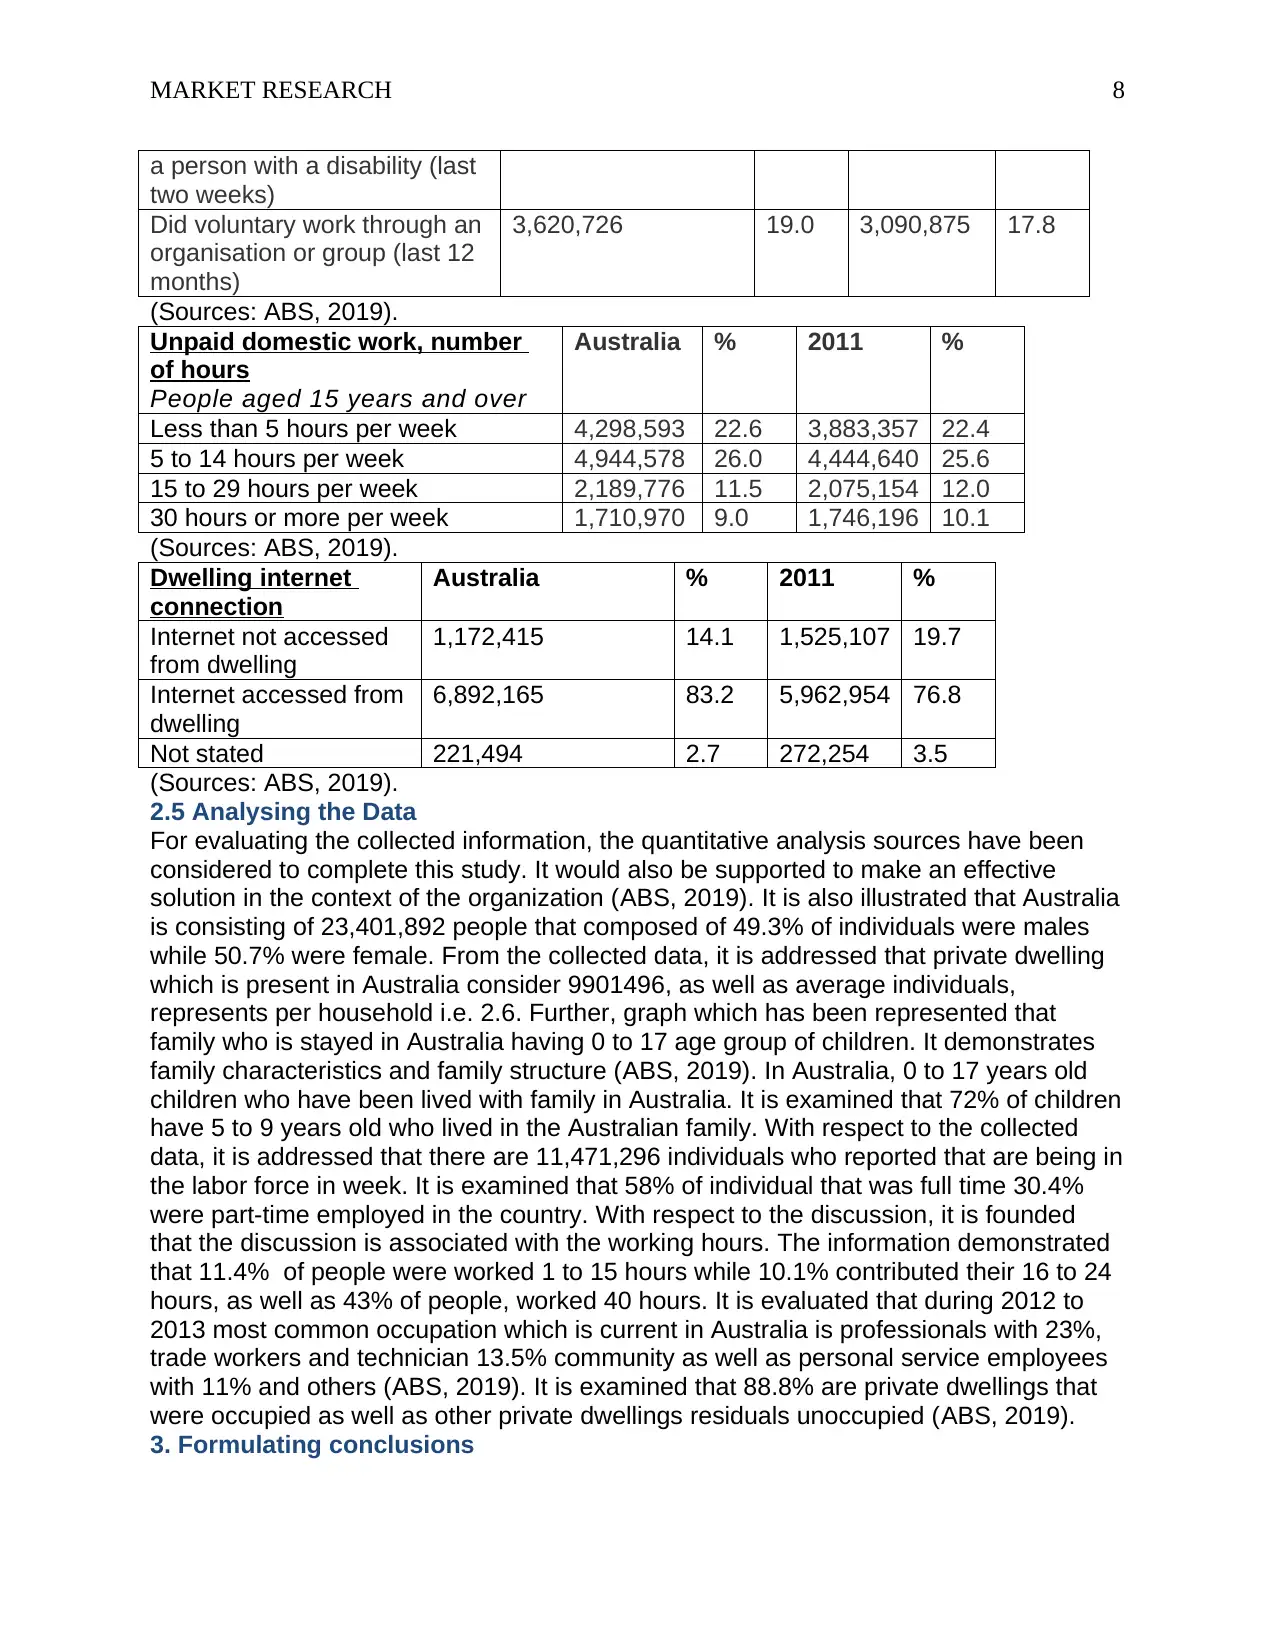
2.5 Analysing the Data
For evaluating the collected information, the quantitative analysis sources have been
considered to complete this study. It would also be supported to make an effective
solution in the context of the organization (ABS, 2019). It is also illustrated that Australia
is consisting of 23,401,892 people that composed of 49.3% of individuals were males
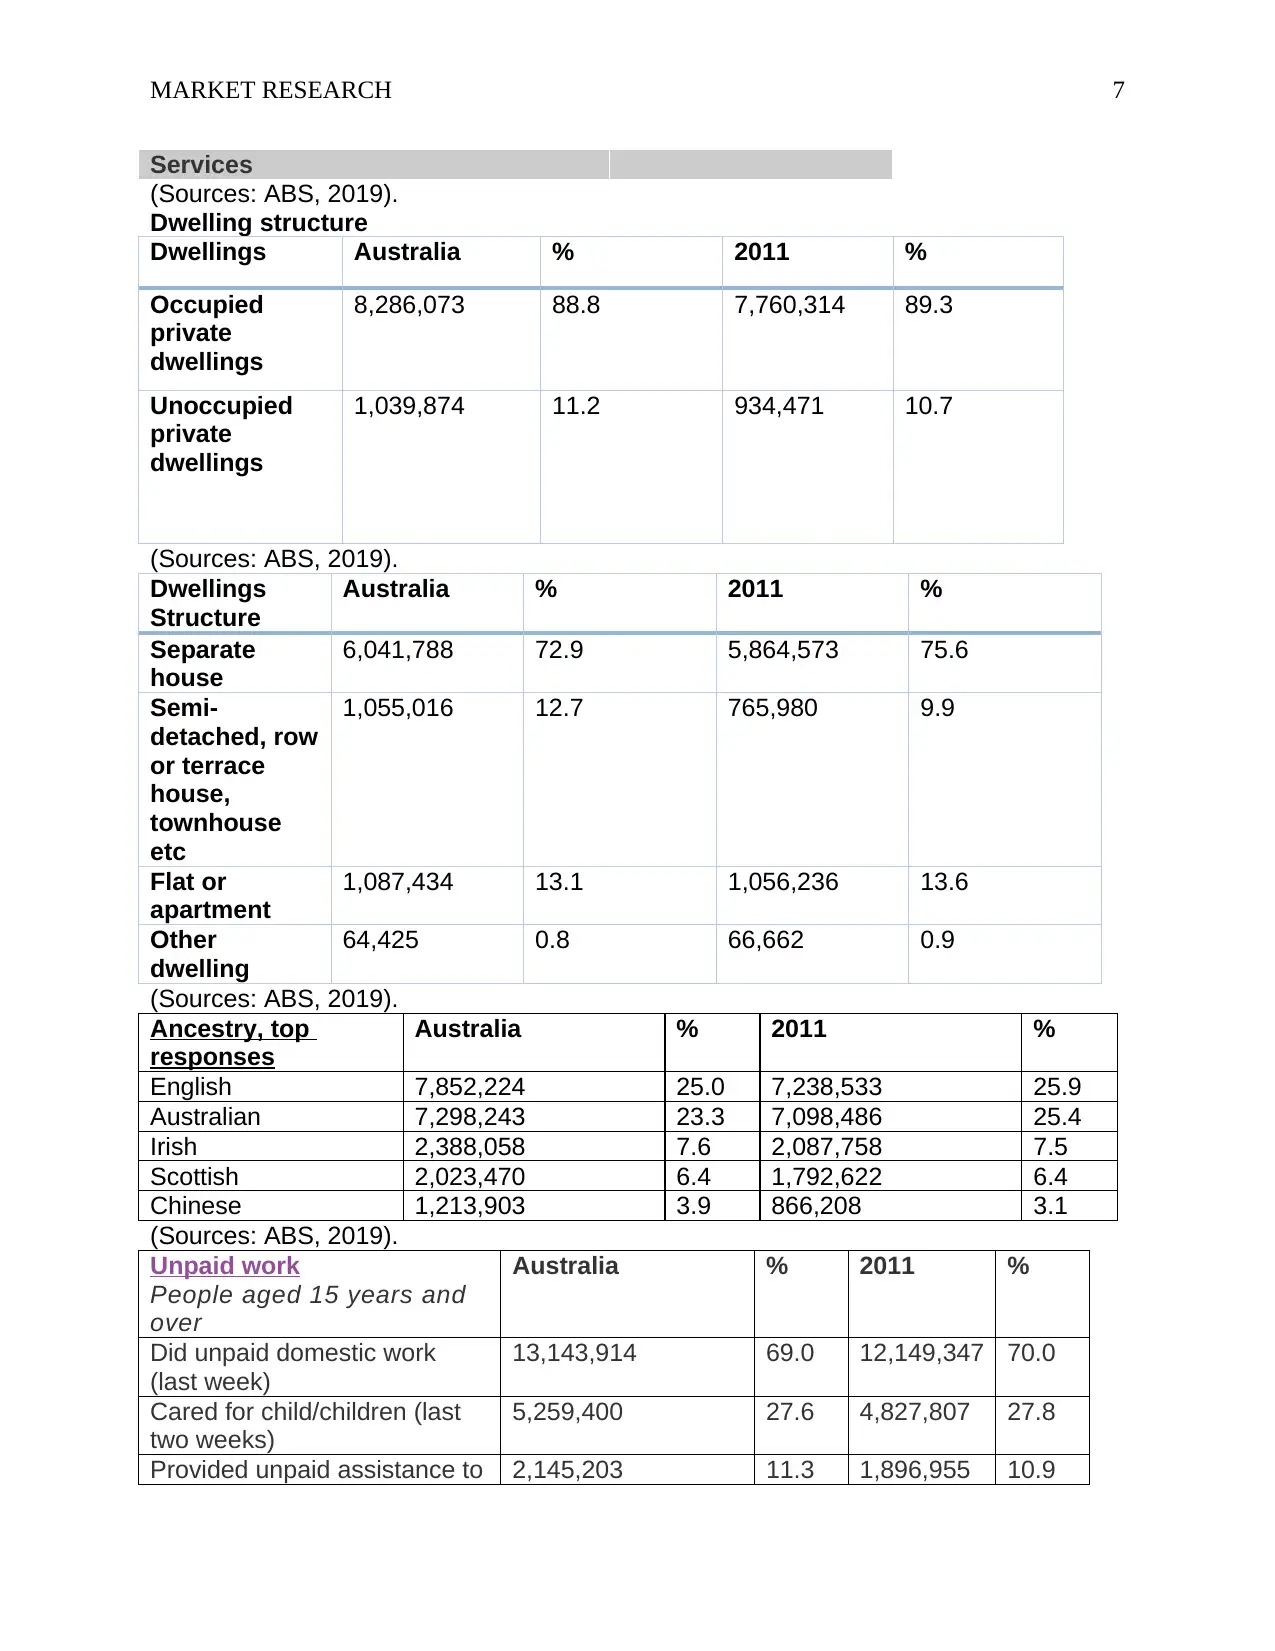
while 50.7% were female. From the collected data, it is addressed that private dwelling
which is present in Australia consider 9901496, as well as average individuals,
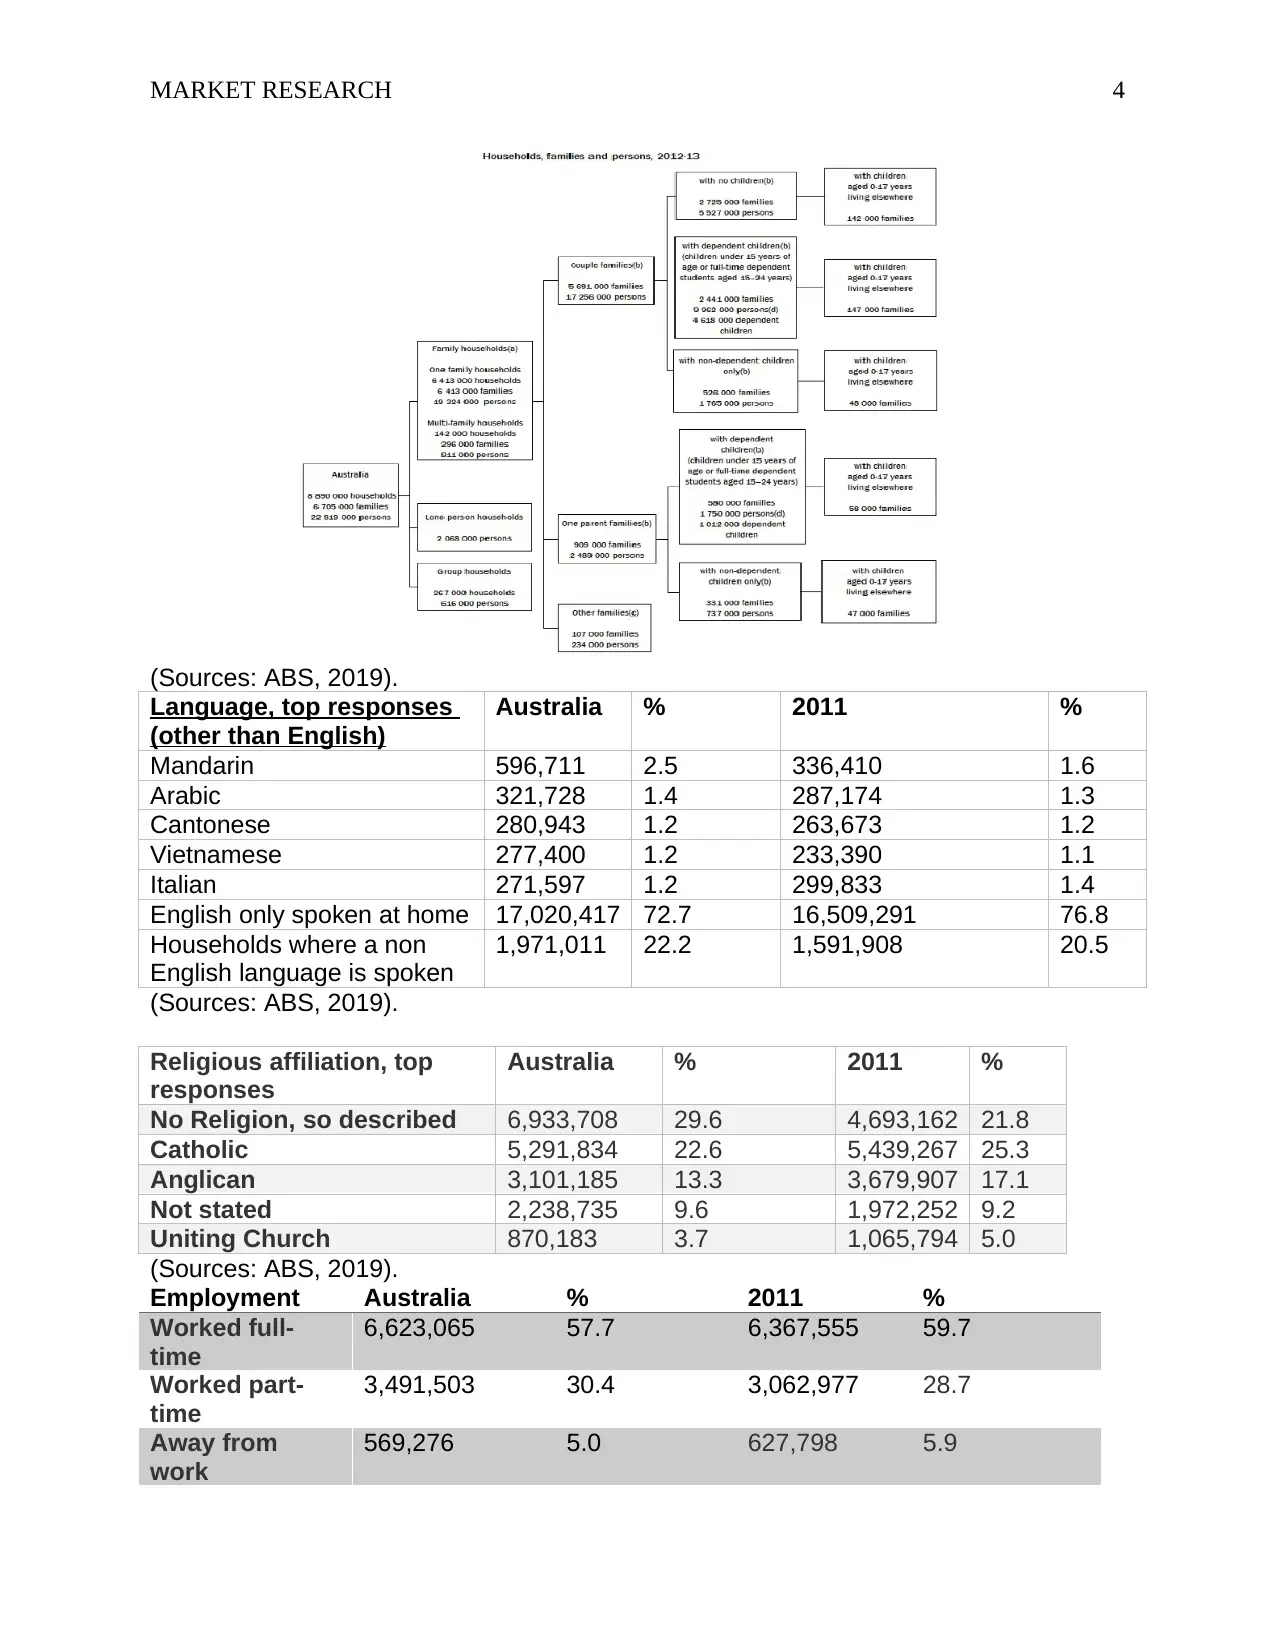
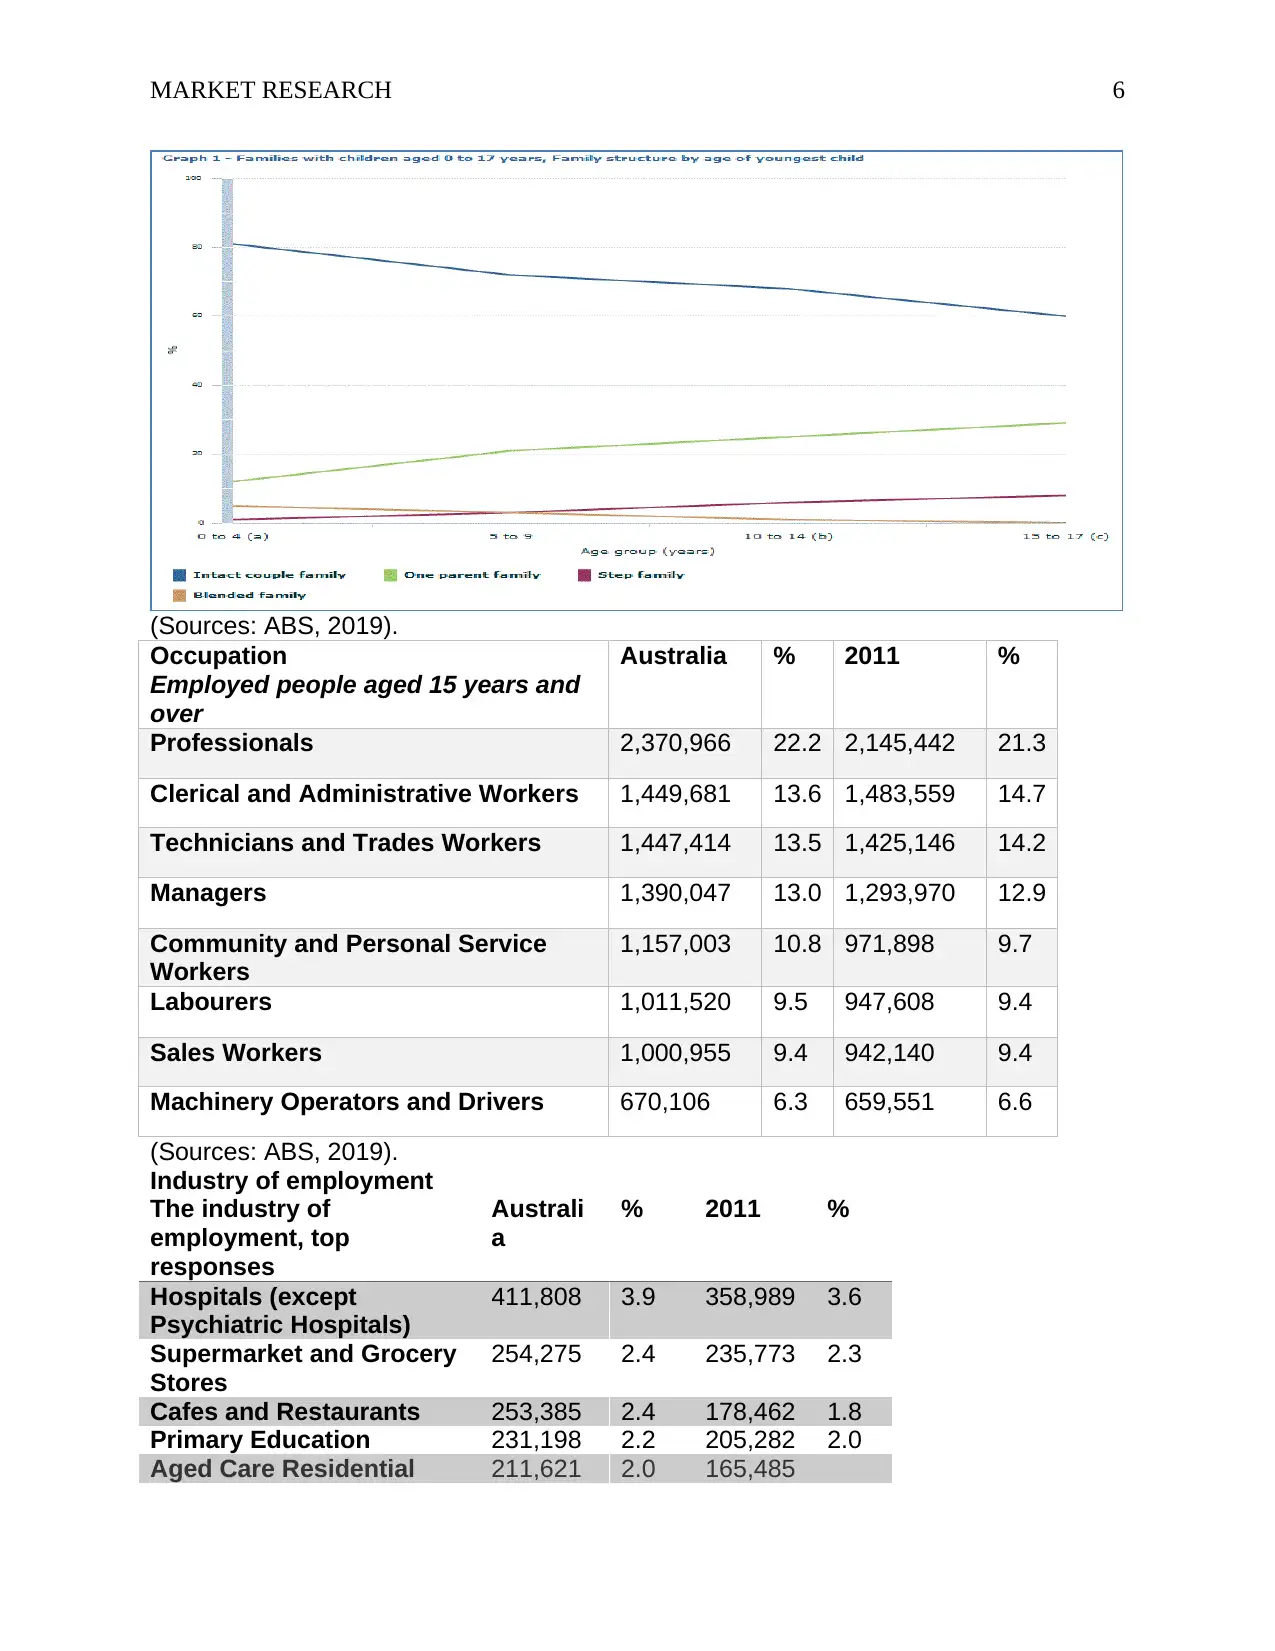
represents per household i.e. 2.6. Further, graph which has been represented that
family who is stayed in Australia having 0 to 17 age group of children. It demonstrates
family characteristics and family structure (ABS, 2019). In Australia, 0 to 17 years old
children who have been lived with family in Australia. It is examined that 72% of children
have 5 to 9 years old who lived in the Australian family. With respect to the collected
data, it is addressed that there are 11,471,296 individuals who reported that are being in
the labor force in week. It is examined that 58% of individual that was full time 30.4%
were part-time employed in the country. With respect to the discussion, it is founded
that the discussion is associated with the working hours. The information demonstrated
that 11.4% of people were worked 1 to 15 hours while 10.1% contributed their 16 to 24
hours, as well as 43% of people, worked 40 hours. It is evaluated that during 2012 to
2013 most common occupation which is current in Australia is professionals with 23%,
trade workers and technician 13.5% community as well as personal service employees
with 11% and others (ABS, 2019). It is examined that 88.8% are private dwellings that
were occupied as well as other private dwellings residuals unoccupied (ABS, 2019).
3. Formulating conclusions
a person with a disability (last
two weeks)
Did voluntary work through an
organisation or group (last 12
months)
3,620,726 19.0 3,090,875 17.8
(Sources: ABS, 2019).
Unpaid domestic work, number
of hours
People aged 15 years and over
Australia % 2011 %
Less than 5 hours per week 4,298,593 22.6 3,883,357 22.4
5 to 14 hours per week 4,944,578 26.0 4,444,640 25.6
15 to 29 hours per week 2,189,776 11.5 2,075,154 12.0
30 hours or more per week 1,710,970 9.0 1,746,196 10.1
(Sources: ABS, 2019).
Dwelling internet
connection
Australia % 2011 %
Internet not accessed
from dwelling
1,172,415 14.1 1,525,107 19.7
Internet accessed from
dwelling
6,892,165 83.2 5,962,954 76.8
Not stated 221,494 2.7 272,254 3.5
(Sources: ABS, 2019).
2.5 Analysing the Data
For evaluating the collected information, the quantitative analysis sources have been
considered to complete this study. It would also be supported to make an effective
solution in the context of the organization (ABS, 2019). It is also illustrated that Australia
is consisting of 23,401,892 people that composed of 49.3% of individuals were males
while 50.7% were female. From the collected data, it is addressed that private dwelling
which is present in Australia consider 9901496, as well as average individuals,
represents per household i.e. 2.6. Further, graph which has been represented that
family who is stayed in Australia having 0 to 17 age group of children. It demonstrates
family characteristics and family structure (ABS, 2019). In Australia, 0 to 17 years old
children who have been lived with family in Australia. It is examined that 72% of children
have 5 to 9 years old who lived in the Australian family. With respect to the collected
data, it is addressed that there are 11,471,296 individuals who reported that are being in
the labor force in week. It is examined that 58% of individual that was full time 30.4%
were part-time employed in the country. With respect to the discussion, it is founded
that the discussion is associated with the working hours. The information demonstrated
that 11.4% of people were worked 1 to 15 hours while 10.1% contributed their 16 to 24
hours, as well as 43% of people, worked 40 hours. It is evaluated that during 2012 to
2013 most common occupation which is current in Australia is professionals with 23%,
trade workers and technician 13.5% community as well as personal service employees
with 11% and others (ABS, 2019). It is examined that 88.8% are private dwellings that
were occupied as well as other private dwellings residuals unoccupied (ABS, 2019).
3. Formulating conclusions
MARKET RESEARCH 9
With respect to the above discussion, it can be concluded that real estate developers
are dealing with issue caused bya modification in demand of families and structure of
households.
In this study, SKY HIGH Real Estate Developers is willing to comprehend the actual
situation of the market due to understanding the needs of consumers towards
households and family. It is examined that the research design is practiced to get the
conceptual information towards the research matter. This method could facilitate to get
the real data towards the research matter. It is recommended that developers could
take efforts for purchasing housing (Loures, 2015). The real estate company could use
effective communication tool by which the firm could conduct suitable behavior with
consumers and attar them to consume goods and services of the firm. It can also be
recommended that the company should make the business alliance by which the firm
would be able to deal with the prime commercial properties and get higher competitive
advantages (Zuo, et al., 2014). This organization could need to determine the
parameters that are presented in the market (Wong, 2017). It is also illustrated that
organization could use modern competitive technology in their business process due to
making diverse image of the company in the marketplace. It can also be recommended
that the organization should give value to consumers due to making the positive
relationship with consumers (Rogers, et al., 2015).
⊘ This is a preview!⊘
Do you want full access?
Subscribe today to unlock all pages.
Trusted by 1+ million students worldwide
MARKET RESEARCH 10
References
ABS. 2019.2016 Census QuickStats. [Online]. Available at:
https://quickstats.censusdata.abs.gov.au/census_services/getproduct/census/2016/
quickstat/036 (Accessed: 23 August 2019).
ABS. 2019. 4442.0 - Family Characteristics and Transitions, Australia, 2012-
13. [Online]. Available at:https://www.abs.gov.au/ausstats/abs@.nsf/mf/4442.0
(Accessed: 23 August 2019).
Gopalan, K. and Venkataraman, M., 2015. Affordable housing: Policy and practice in
India. IIMB Management Review, 27(2), pp.129-140.
Loures, L., 2015. Post-industrial landscapes as drivers for urban redevelopment: Public
versus expert perspectives towards the benefits and barriers of the reuse of post-
industrial sites in urban areas. Habitat International, 45, pp.72-81.
Rogers, D., Lee, C.L. and Yan, D., 2015. The politics of foreign investment in Australian
housing: Chinese investors, translocal sales agents, and local resistance. Housing
Studies, 30(5), pp.730-748.
Turner, M.J. and Guilding, C., 2014. An investigation of Australian and New Zealand
hotel ownership. Journal of Hospitality and Tourism Management, 21, pp.76-89.
Wong, A., 2017. Transnational real estate in Australia: new Chinese diaspora, media
representation and urban transformation in Sydney's Chinatown. International Journal of
Housing Policy, 17(1), pp.97-119.
Zuo, J., Xia, B., Barker, J., and Skitmore, M., 2014. Green buildings for greying people:
a case study of a retirement village in Australia. Facilities, 32(7/8), pp.365-381.
1 out of 10
Related Documents


Your All-in-One AI-Powered Toolkit for Academic Success.
+13062052269
info@desklib.com
Available 24*7 on WhatsApp / Email
![[object Object]](/_next/static/media/star-bottom.7253800d.svg)
Unlock your academic potential
Copyright © 2020–2026 A2Z Services. All Rights Reserved. Developed and managed by ZUCOL.