Corporate Finance Report: Analysis of Home Depot Financial Performance

Verified

Added on  2020/03/04

|7
|1065
|45
Report
AI Summary
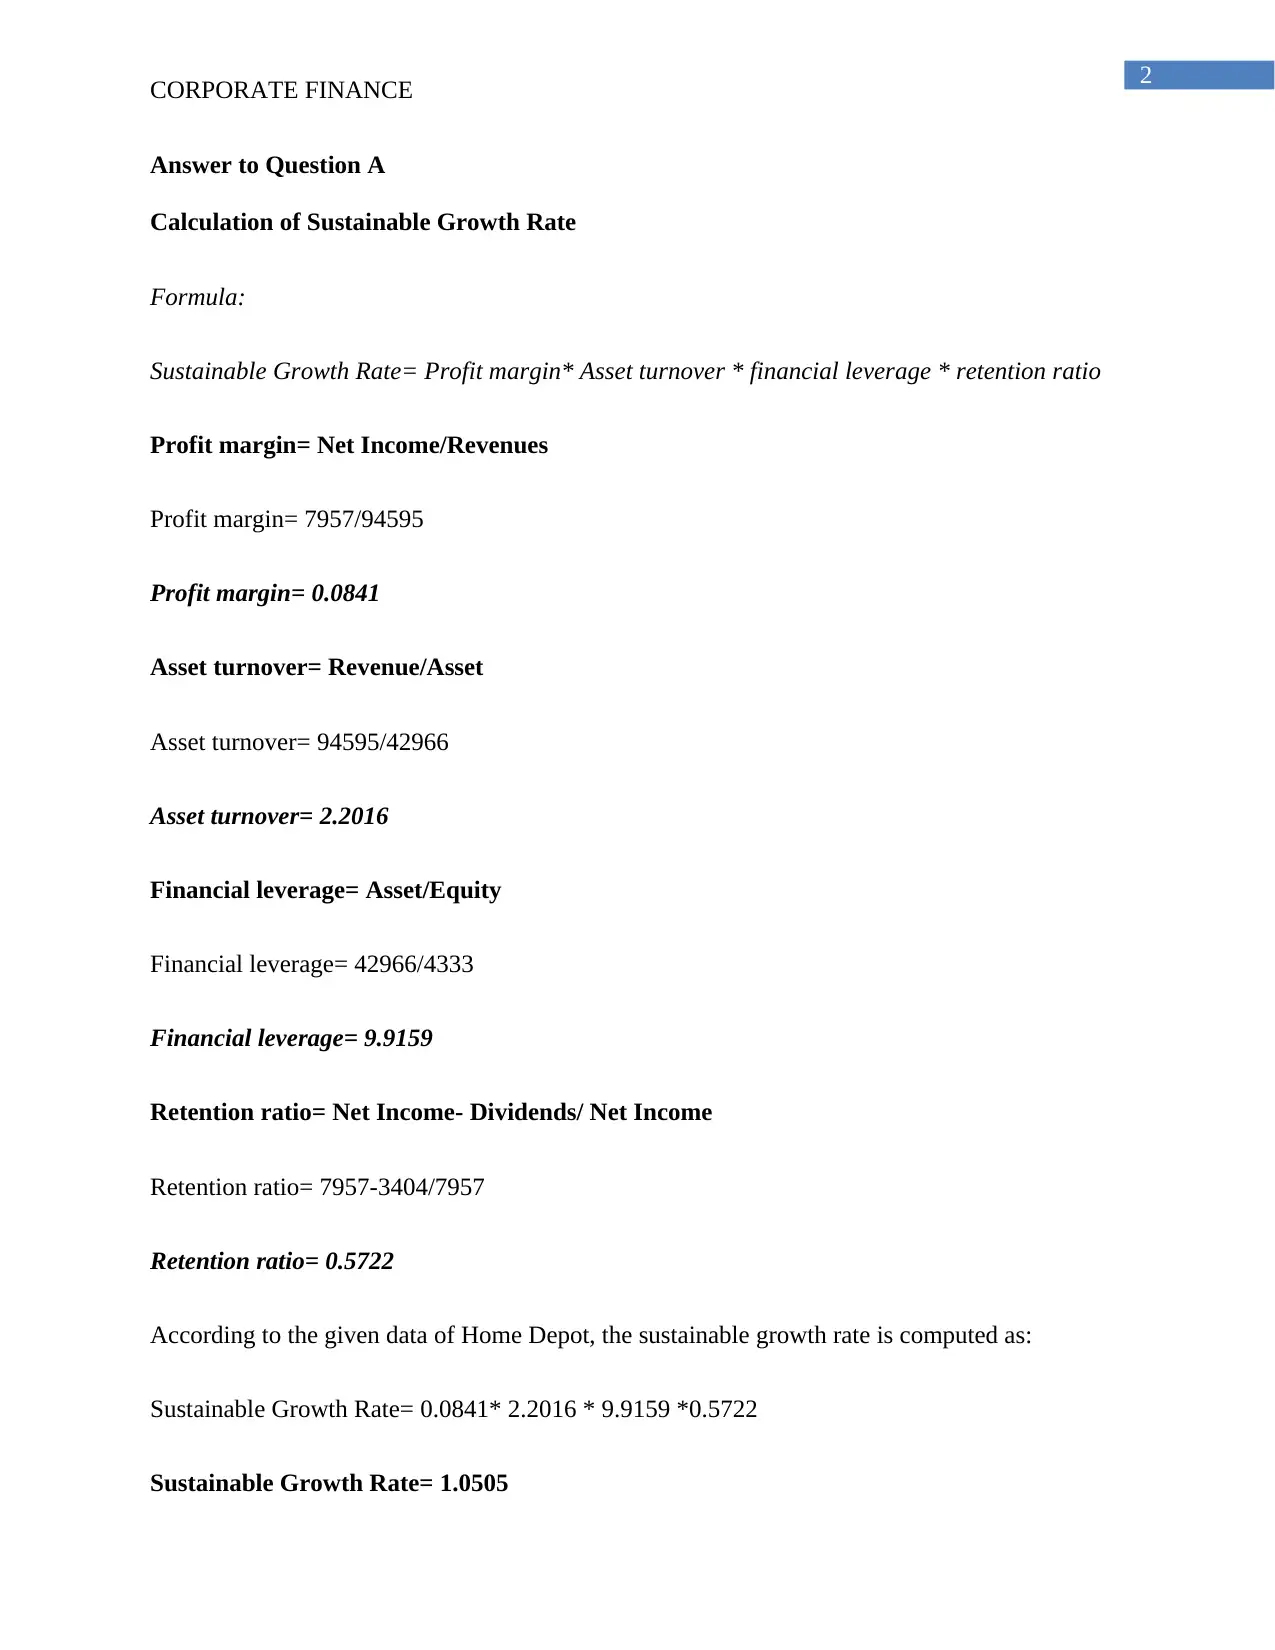
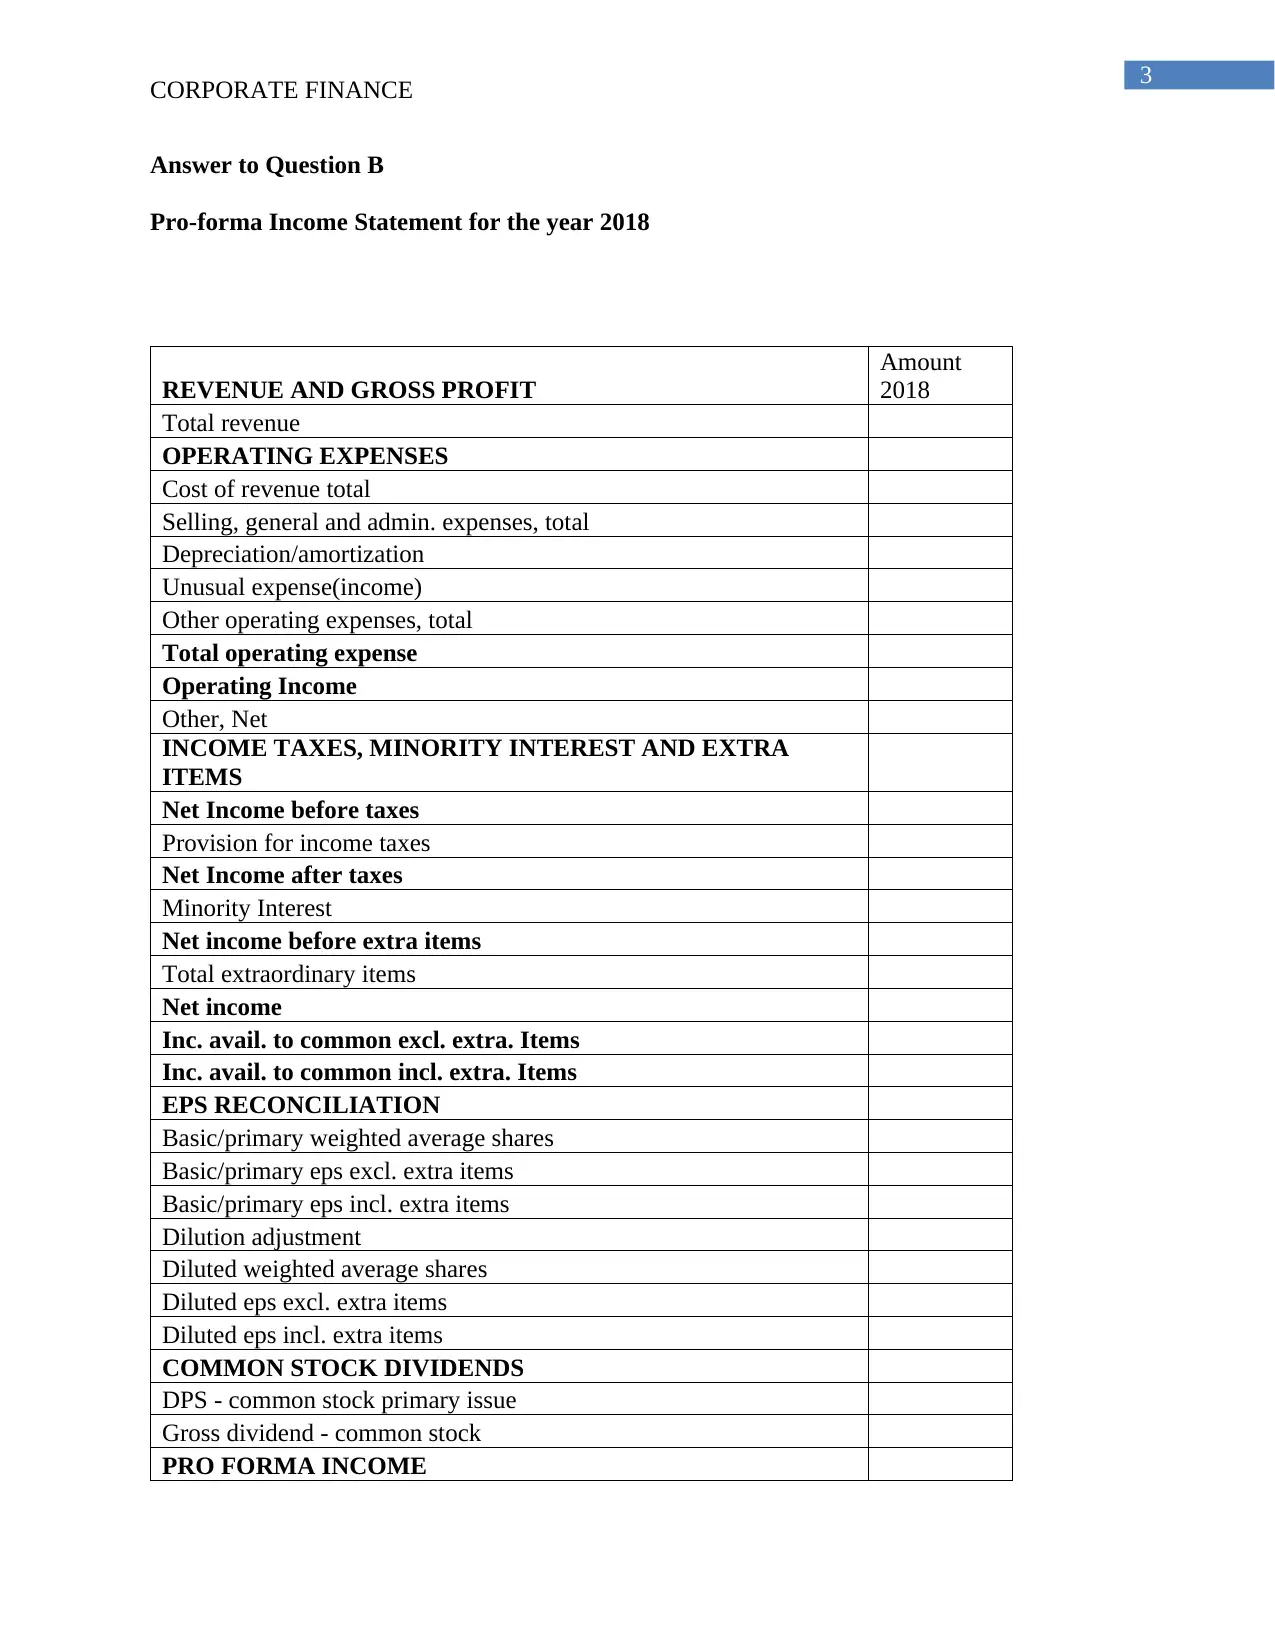
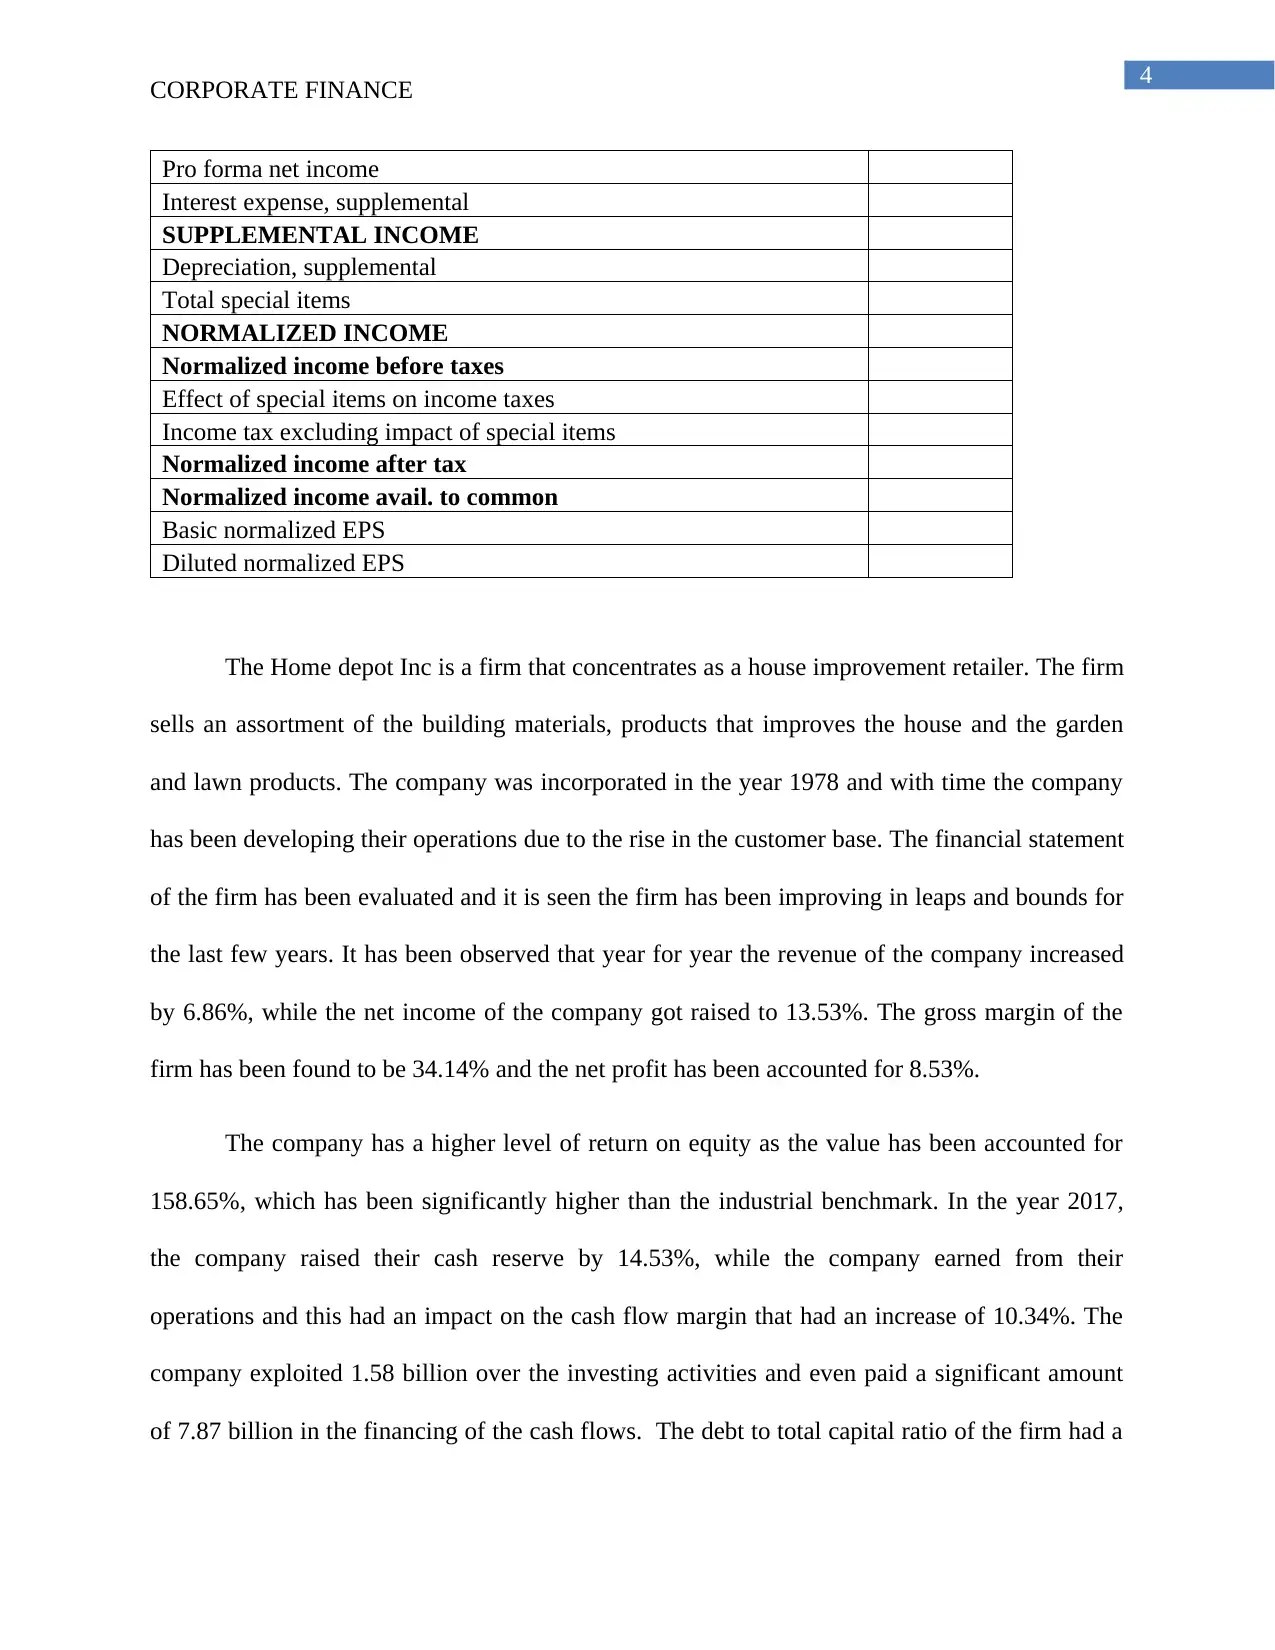
This report provides a comprehensive corporate finance analysis of Home Depot. It begins by calculating the sustainable growth rate using key financial metrics such as profit margin, asset turnover, financial leverage, and retention ratio. The report then presents a pro-forma income statement for the year 2018, detailing revenue, operating expenses, and net income. A review of Home Depot's financial performance is included, highlighting revenue growth, net income increases, gross margin, return on equity, cash flow, and debt-to-capital ratio. The analysis indicates the company's positive financial trends and potential for projected growth, supported by EPS and DPS growth. The report concludes with a reference list of sources used in the analysis.
Document Page
Running head: CORPORATE FINANCE
Corporate Finance
Name of the Student:
Name of the University:
Author’s Note:
tabler-icon-diamond-filled.svg

Paraphrase This Document

Need a fresh take? Get an instant paraphrase of this document with our AI Paraphraser
Document Page
1
CORPORATE FINANCE
Table of Contents
Answer to Question A.....................................................................................................................1
Answer to Question B......................................................................................................................2
Reference List and Bibliography.....................................................................................................5
Document Page
2
CORPORATE FINANCE
Answer to Question A
Calculation of Sustainable Growth Rate
Formula:
Sustainable Growth Rate= Profit margin* Asset turnover * financial leverage * retention ratio
Profit margin= Net Income/Revenues
Profit margin= 7957/94595
Profit margin= 0.0841
Asset turnover= Revenue/Asset
Asset turnover= 94595/42966
Asset turnover= 2.2016
Financial leverage= Asset/Equity
Financial leverage= 42966/4333
Financial leverage= 9.9159
Retention ratio= Net Income- Dividends/ Net Income
Retention ratio= 7957-3404/7957
Retention ratio= 0.5722
According to the given data of Home Depot, the sustainable growth rate is computed as:
Sustainable Growth Rate= 0.0841* 2.2016 * 9.9159 *0.5722
Sustainable Growth Rate= 1.0505
Document Page
3
CORPORATE FINANCE
Answer to Question B
Pro-forma Income Statement for the year 2018
REVENUE AND GROSS PROFIT
Amount
2018
Total revenue
OPERATING EXPENSES
Cost of revenue total
Selling, general and admin. expenses, total
Depreciation/amortization
Unusual expense(income)
Other operating expenses, total
Total operating expense
Operating Income
Other, Net
INCOME TAXES, MINORITY INTEREST AND EXTRA
ITEMS
Net Income before taxes
Provision for income taxes
Net Income after taxes
Minority Interest
Net income before extra items
Total extraordinary items
Net income
Inc. avail. to common excl. extra. Items
Inc. avail. to common incl. extra. Items
EPS RECONCILIATION
Basic/primary weighted average shares
Basic/primary eps excl. extra items
Basic/primary eps incl. extra items
Dilution adjustment
Diluted weighted average shares
Diluted eps excl. extra items
Diluted eps incl. extra items
COMMON STOCK DIVIDENDS
DPS - common stock primary issue
Gross dividend - common stock
PRO FORMA INCOME
tabler-icon-diamond-filled.svg

Paraphrase This Document

Need a fresh take? Get an instant paraphrase of this document with our AI Paraphraser
Document Page
4
CORPORATE FINANCE
Pro forma net income
Interest expense, supplemental
SUPPLEMENTAL INCOME
Depreciation, supplemental
Total special items
NORMALIZED INCOME
Normalized income before taxes
Effect of special items on income taxes
Income tax excluding impact of special items
Normalized income after tax
Normalized income avail. to common
Basic normalized EPS
Diluted normalized EPS
The Home depot Inc is a firm that concentrates as a house improvement retailer. The firm
sells an assortment of the building materials, products that improves the house and the garden
and lawn products. The company was incorporated in the year 1978 and with time the company
has been developing their operations due to the rise in the customer base. The financial statement
of the firm has been evaluated and it is seen the firm has been improving in leaps and bounds for
the last few years. It has been observed that year for year the revenue of the company increased
by 6.86%, while the net income of the company got raised to 13.53%. The gross margin of the
firm has been found to be 34.14% and the net profit has been accounted for 8.53%.
The company has a higher level of return on equity as the value has been accounted for
158.65%, which has been significantly higher than the industrial benchmark. In the year 2017,
the company raised their cash reserve by 14.53%, while the company earned from their
operations and this had an impact on the cash flow margin that had an increase of 10.34%. The
company exploited 1.58 billion over the investing activities and even paid a significant amount
of 7.87 billion in the financing of the cash flows. The debt to total capital ratio of the firm had a
Document Page
5
CORPORATE FINANCE
value of 85.27%, which is way lower than the previous year, which had a value of 329.98%.
Year on year, the earnings per share and the dividends per share increased to 18.03% and
16.95%. The positive movement in the payment of the dividend is a significant factor as there are
certain firms who pay an amount as dividend. After the evaluation of the earnings per share and
the dividend per share it has been observed that the growth of the firm has been positioned to be
the highest in relation to the industrial peers.
By analyzing the the financial trends and the financial position of the firm, it has been
observed that the company has the potential for projected growth as the revenue of the firm has
been increasing with respect to the previous years. The growth of the company has been
observed as the net profit of the firm has been increasing from time to time and therefore, by
looking at the financial performance of the firm, it can be suggested that the company has the
ability for projected growth with respect to the year to year actuals
Document Page
6
CORPORATE FINANCE
Reference List and Bibliography
Aetukuri, N. B., McCloskey, B. D., García, J. M., Krupp, L. E., Viswanathan, V., & Luntz, A. C.
(2015). Solvating additives drive solution-mediated electrochemistry and enhance toroid
growth in non-aqueous Li–O2 batteries. Nature chemistry, 7(1), 50-56.
Cox, P. M., Pearson, D., Booth, B. B., Friedlingstein, P., Huntingford, C., Jones, C. D., & Luke,
C. M. (2013). Sensitivity of tropical carbon to climate change constrained by carbon
dioxide variability. Nature, 494(7437), 341.
Harper, A. E., & Benevenga, N. J. (2016). Effects of disproportionate amounts of amino
acids. Proteins as Human Food: Proceedings of the Sixteenth Easter School in
Agricultural Science, University of Nottingham, 1969, 417.
Home Depot Inc, HD:NYQ financials - FT.com. (2017). Markets.ft.com. Retrieved 14 August
2017, from https://markets.ft.com/data/equities/tearsheet/financials?s=HD:NYQ
Kiviet, D. J., Nghe, P., Walker, N., Boulineau, S., Sunderlikova, V., & Tans, S. J. (2014).
Stochasticity of metabolism and growth at the single-cell level. Nature, 514(7522), 376.
Piketty, T. (2014). Capital in the 21st Century.
chevron_up_icon
1 out of 7
circle_padding
hide_on_mobile
zoom_out_icon
[object Object]