Corporate Finance Report: Home Depot Financial Performance Analysis

Verified

Added on  2019/11/08

|7
|1233
|188
Report
AI Summary
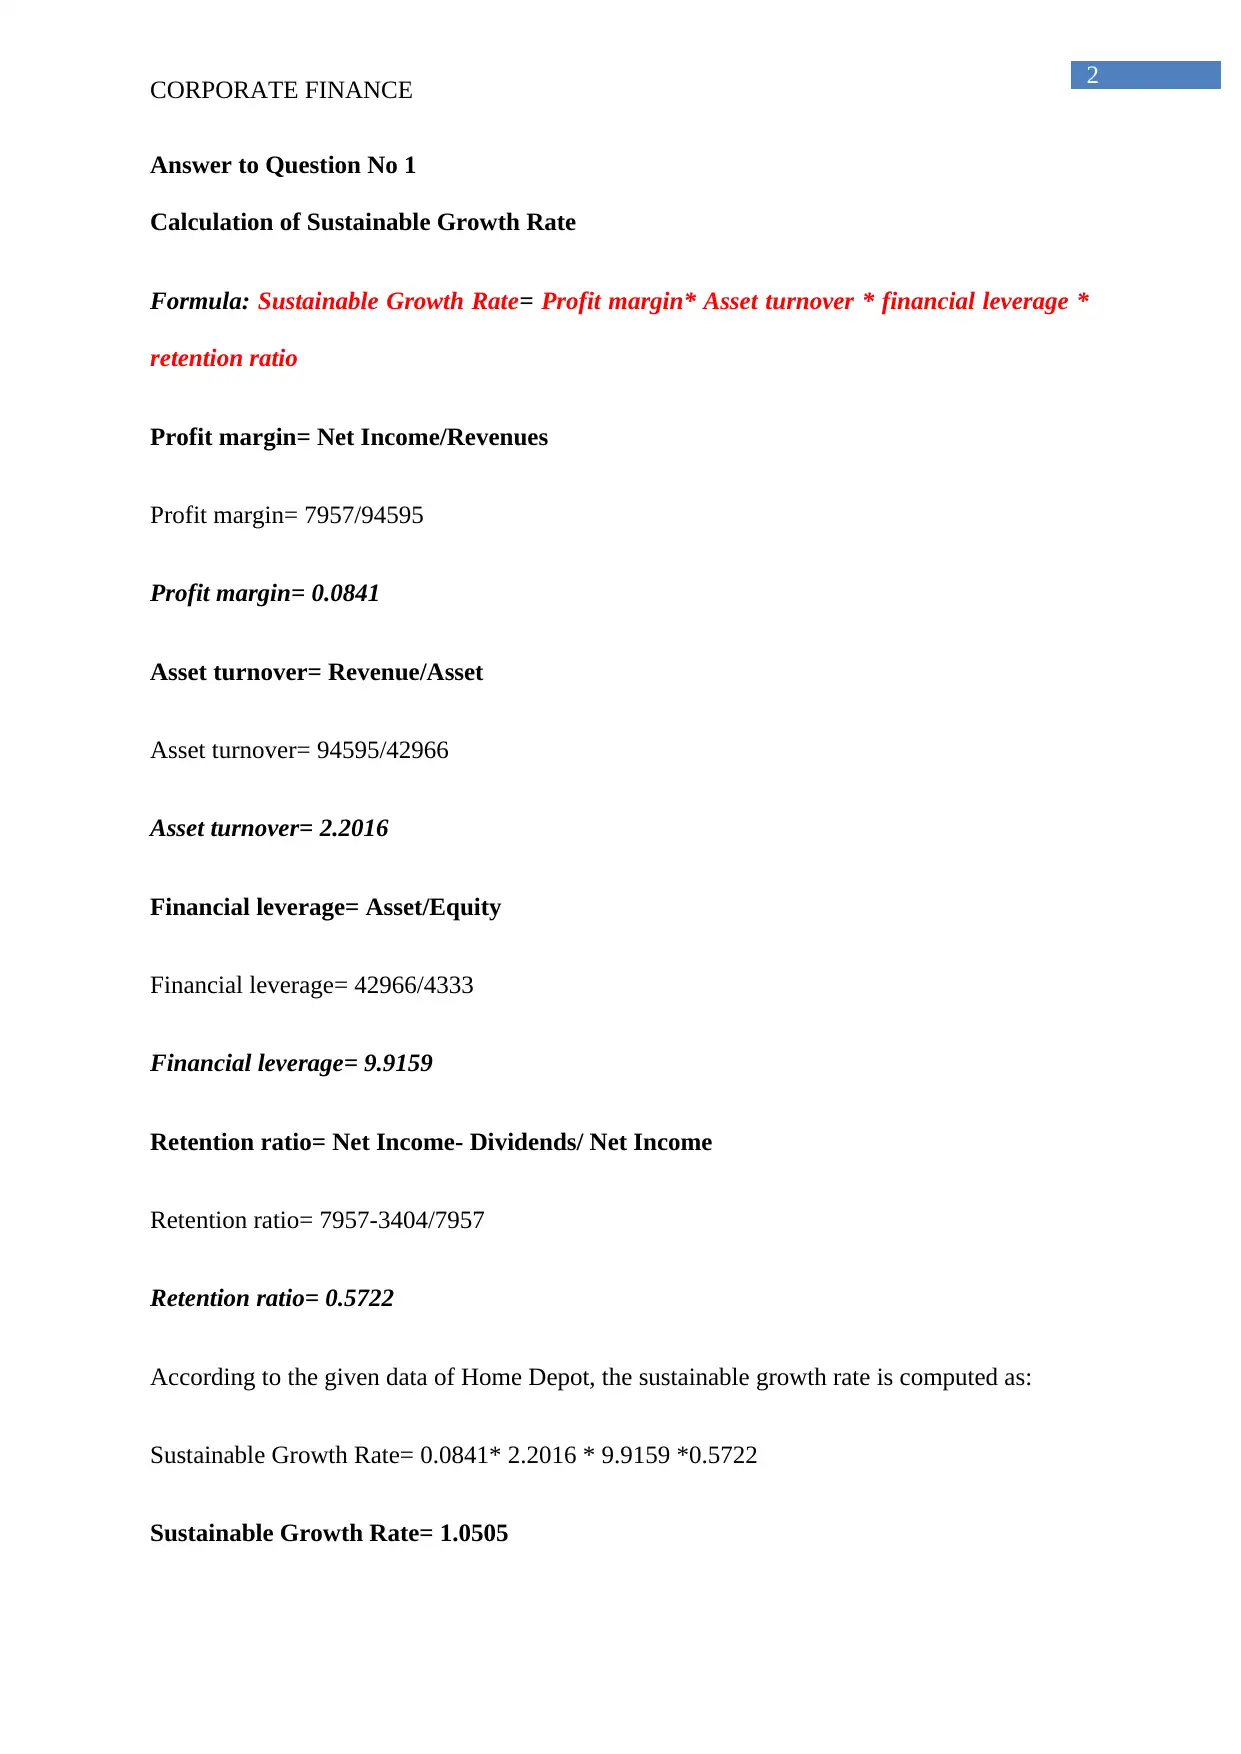
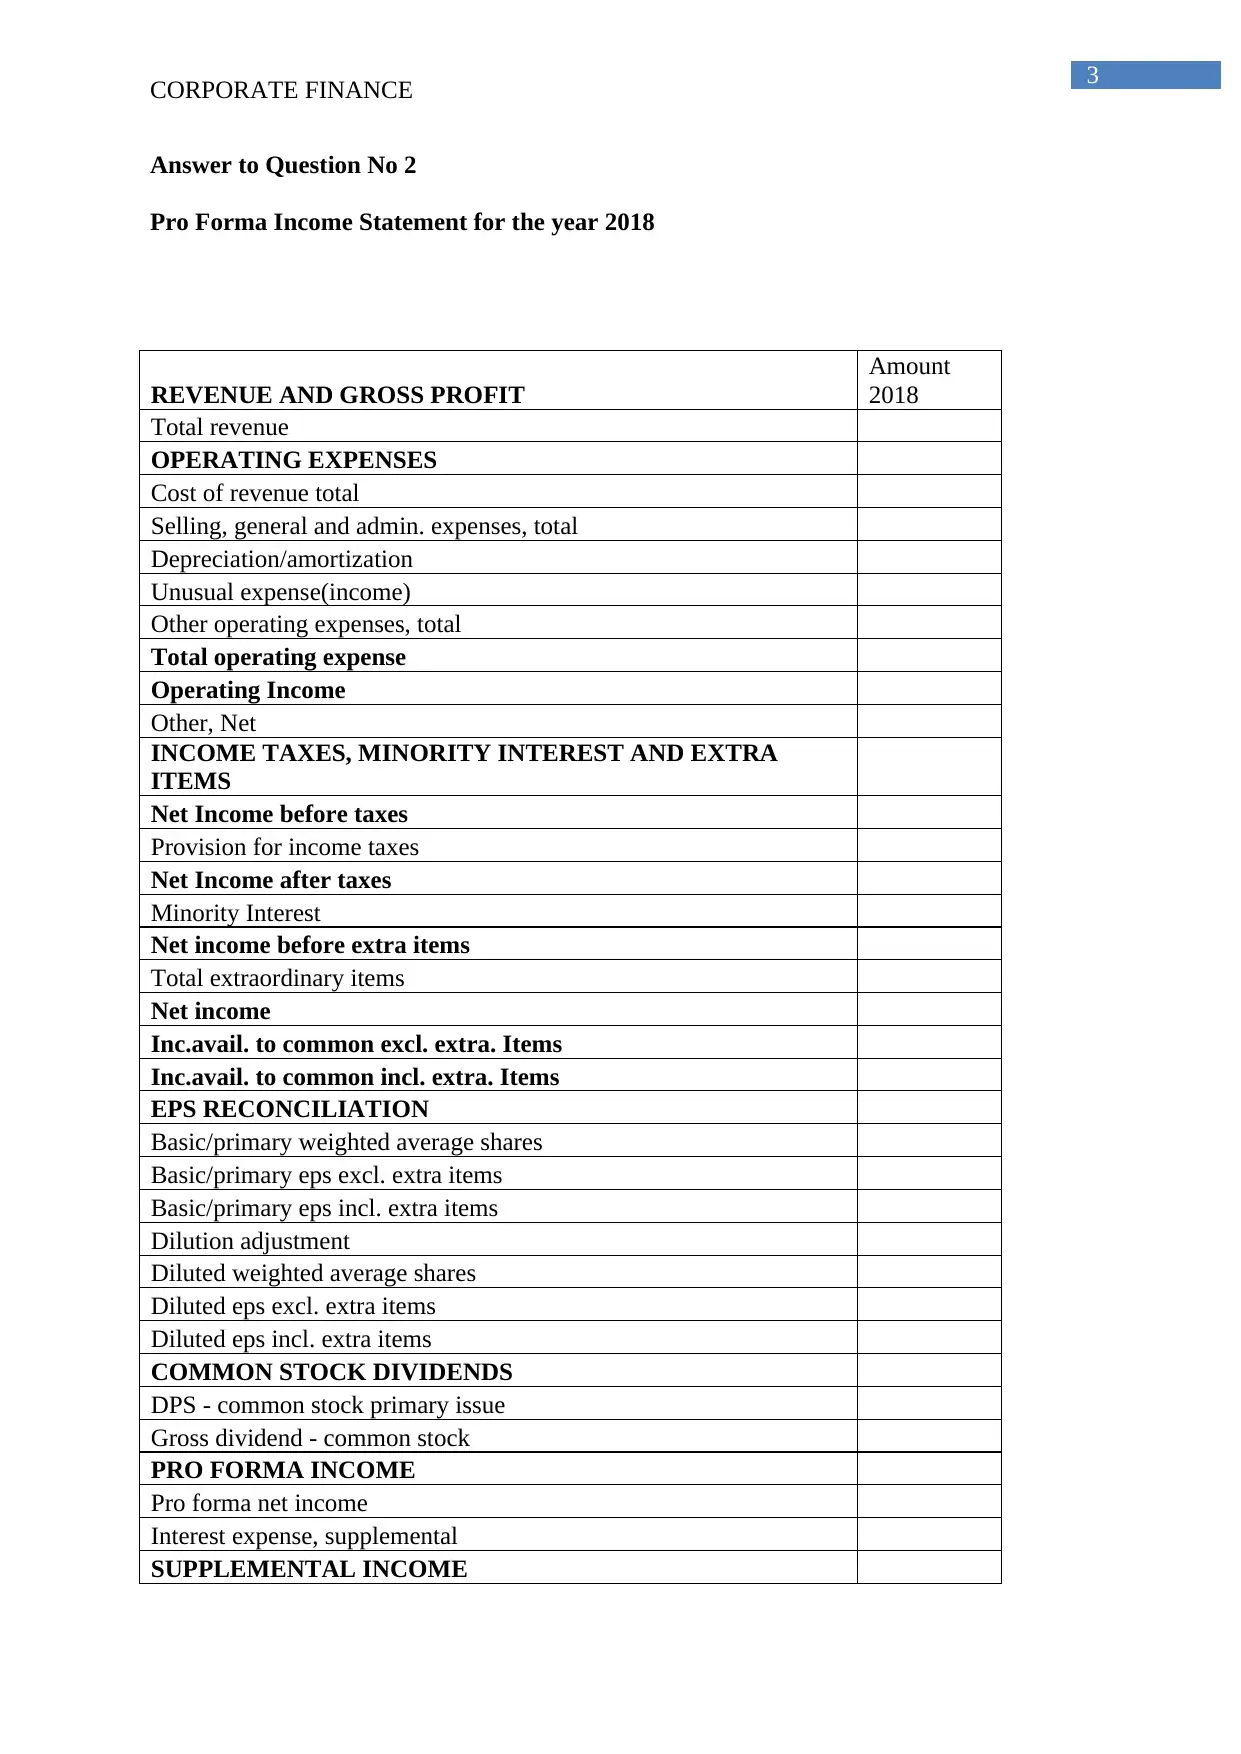
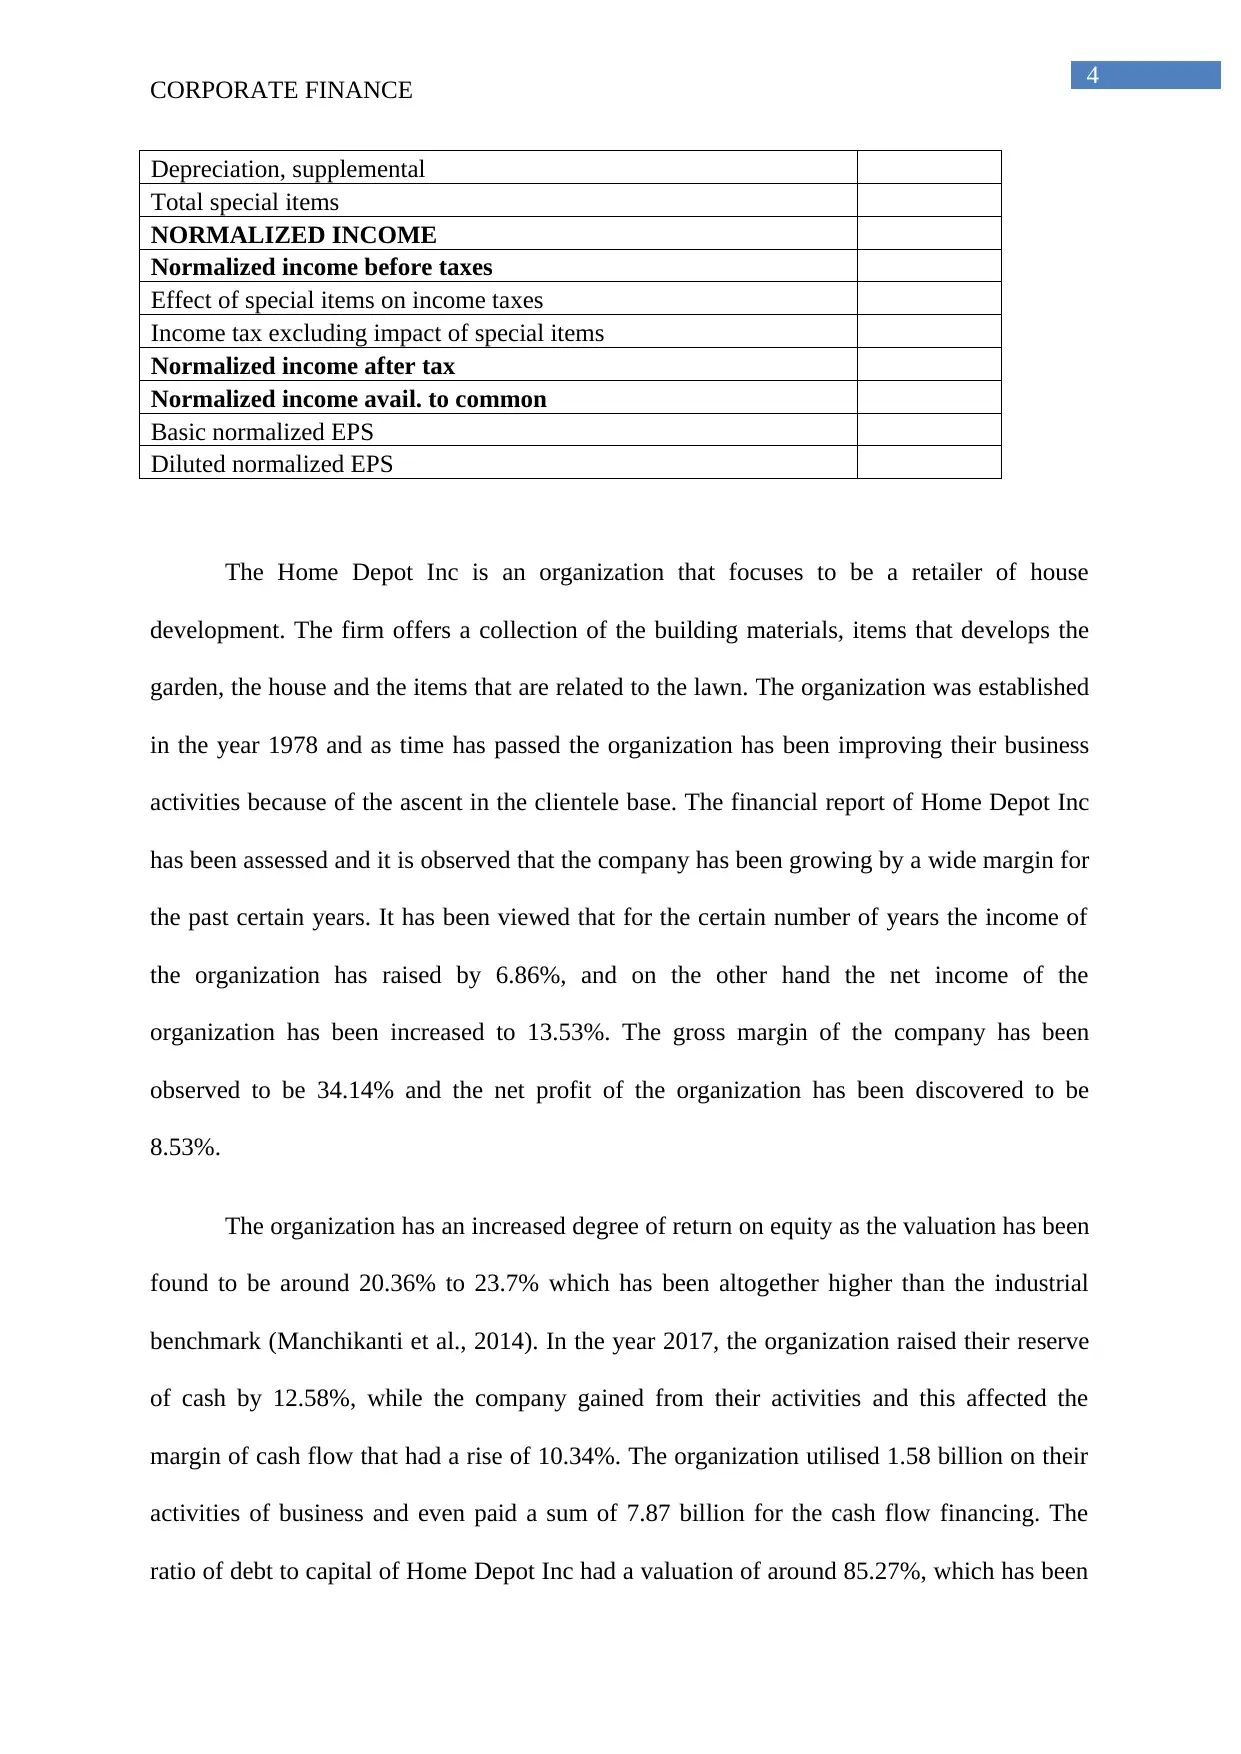
This report presents a corporate finance analysis of Home Depot, focusing on its financial performance and growth potential. It begins by calculating the sustainable growth rate using key financial metrics such as profit margin, asset turnover, financial leverage, and retention ratio, based on the provided data. The report then constructs a pro forma income statement for 2018, projecting revenue, expenses, and net income. A qualitative analysis of Home Depot's business activities and financial trends is also included, highlighting its revenue growth, net income increases, and return on equity. The analysis emphasizes the company's capacity for anticipated expansion and its strong position relative to industry competitors. The report references several academic sources, including studies on sustainable growth rates and financial analysis.
Document Page
Running head: CORPORATE FINANCE
Corporate Finance
Name of the Student:
Name of the University:
Author’s Note:
tabler-icon-diamond-filled.svg

Paraphrase This Document

Need a fresh take? Get an instant paraphrase of this document with our AI Paraphraser
Document Page
1
CORPORATE FINANCE
Table of Contents
Answer to Question No 1...........................................................................................................2
Answer to Question No 2...........................................................................................................3
Bibliography...............................................................................................................................6
Document Page
2
CORPORATE FINANCE
Answer to Question No 1
Calculation of Sustainable Growth Rate
Formula: Sustainable Growth Rate= Profit margin* Asset turnover * financial leverage *
retention ratio
Profit margin= Net Income/Revenues
Profit margin= 7957/94595
Profit margin= 0.0841
Asset turnover= Revenue/Asset
Asset turnover= 94595/42966
Asset turnover= 2.2016
Financial leverage= Asset/Equity
Financial leverage= 42966/4333
Financial leverage= 9.9159
Retention ratio= Net Income- Dividends/ Net Income
Retention ratio= 7957-3404/7957
Retention ratio= 0.5722
According to the given data of Home Depot, the sustainable growth rate is computed as:
Sustainable Growth Rate= 0.0841* 2.2016 * 9.9159 *0.5722
Sustainable Growth Rate= 1.0505
Document Page
3
CORPORATE FINANCE
Answer to Question No 2
Pro Forma Income Statement for the year 2018
REVENUE AND GROSS PROFIT
Amount
2018
Total revenue
OPERATING EXPENSES
Cost of revenue total
Selling, general and admin. expenses, total
Depreciation/amortization
Unusual expense(income)
Other operating expenses, total
Total operating expense
Operating Income
Other, Net
INCOME TAXES, MINORITY INTEREST AND EXTRA
ITEMS
Net Income before taxes
Provision for income taxes
Net Income after taxes
Minority Interest
Net income before extra items
Total extraordinary items
Net income
Inc.avail. to common excl. extra. Items
Inc.avail. to common incl. extra. Items
EPS RECONCILIATION
Basic/primary weighted average shares
Basic/primary eps excl. extra items
Basic/primary eps incl. extra items
Dilution adjustment
Diluted weighted average shares
Diluted eps excl. extra items
Diluted eps incl. extra items
COMMON STOCK DIVIDENDS
DPS - common stock primary issue
Gross dividend - common stock
PRO FORMA INCOME
Pro forma net income
Interest expense, supplemental
SUPPLEMENTAL INCOME
tabler-icon-diamond-filled.svg

Paraphrase This Document

Need a fresh take? Get an instant paraphrase of this document with our AI Paraphraser
Document Page
4
CORPORATE FINANCE
Depreciation, supplemental
Total special items
NORMALIZED INCOME
Normalized income before taxes
Effect of special items on income taxes
Income tax excluding impact of special items
Normalized income after tax
Normalized income avail. to common
Basic normalized EPS
Diluted normalized EPS
The Home Depot Inc is an organization that focuses to be a retailer of house
development. The firm offers a collection of the building materials, items that develops the
garden, the house and the items that are related to the lawn. The organization was established
in the year 1978 and as time has passed the organization has been improving their business
activities because of the ascent in the clientele base. The financial report of Home Depot Inc
has been assessed and it is observed that the company has been growing by a wide margin for
the past certain years. It has been viewed that for the certain number of years the income of
the organization has raised by 6.86%, and on the other hand the net income of the
organization has been increased to 13.53%. The gross margin of the company has been
observed to be 34.14% and the net profit of the organization has been discovered to be
8.53%.
The organization has an increased degree of return on equity as the valuation has been
found to be around 20.36% to 23.7% which has been altogether higher than the industrial
benchmark (Manchikanti et al., 2014). In the year 2017, the organization raised their reserve
of cash by 12.58%, while the company gained from their activities and this affected the
margin of cash flow that had a rise of 10.34%. The organization utilised 1.58 billion on their
activities of business and even paid a sum of 7.87 billion for the cash flow financing. The
ratio of debt to capital of Home Depot Inc had a valuation of around 85.27%, which has been
Document Page
5
CORPORATE FINANCE
significantly lower than the past year, which had valuation of around 329.98% (Reschovsky
et al., 2015). Year after year, the revenue per share and the dividends per share had an
increase to 18.03% and 16.95%. The optimistic movement in the dividend payout is a key
factor as there are various organizations that pay a significant amount of money from their
profit as dividend. After the assessment of the earnings per share and the dividend payout per
share it has been noticed that the development of the organization has been situated to be the
most noteworthy in accordance to the industrial competitors.
By breaking down the financial pattern and the financial scenario of the organization,
it has been viewed that the organization has the prospective for anticipated expansion as the
profit of Home Depot Inc has been developing in regards to the past few years (Saxena,
2015). Home Depot Inc has estimated net earnings of $4530 million and by looking at the
sustainable growth rate it can be said that the actual year after year will be growing and the
company would be expanding significantly and would be in a better position that the other
companies that are functioning in the same economy. The development of the organization
has been pertinent as the net profit of Home Depot Inc has been rising year after year and
consequently, by undertaking an observation at the financial development and performance of
the company, it can be proposed that the organization has the capacity for anticipated growth
in accordance to the year to year actual (Hirsch et al., 2016).
Document Page
6
CORPORATE FINANCE
Reference List and Bibliography
Hirsch, J. A., & Manchikanti, L. (2014). The sustainable growth rate: a 2014 update. Journal
of neurointerventional surgery, 6(6), 411-412.
Hirsch, J. A., Harvey, H. B., Barr, R. M., Donovan, W. D., Duszak, R., Nicola, G. N., ... &
Manchikanti, L. (2016). Sustainable growth rate repealed, MACRA revealed:
historical context and analysis of recent changes in Medicare physician payment
methodologies. American Journal of Neuroradiology, 37(2), 210-214.
Manchikanti, L., Staats, P. S., Boswell, M. V., & Hirsch, J. A. (2015). Analysis of the carrot
and stick policy of repeal of the sustainable growth rate formula: the good, the bad,
and the ugly. Pain Physician, 18(3), E273-E292.
Nguyen, A. P., Hyder, J. A., Wanta, B. T., Stelfox, H. T., & Schmidt, U. (2016). Measuring
intensive care unit performance after sustainable growth rate reform: An example
with the National Quality Forum metrics. Journal of critical care, 36, 81-84.
Reschovsky, J. D., Converse, L., & Rich, E. C. (2015). Solving the sustainable growth rate
formula conundrum continues steps toward cost savings and care improvements.
Health Affairs, 10-1377.
Saxena, S. (2015). Managed Sustainable Development: Classification Of Resources And
Goods & Services, Calculating Sustainable Growth Rate And The Sustainable
Development Index.
chevron_up_icon
1 out of 7
circle_padding
hide_on_mobile
zoom_out_icon
[object Object]