Honda Motor Company Portfolio Analysis Report - Marketing Strategies

Verified

Added on  2022/09/07

|5
|384
|29
Report
AI Summary
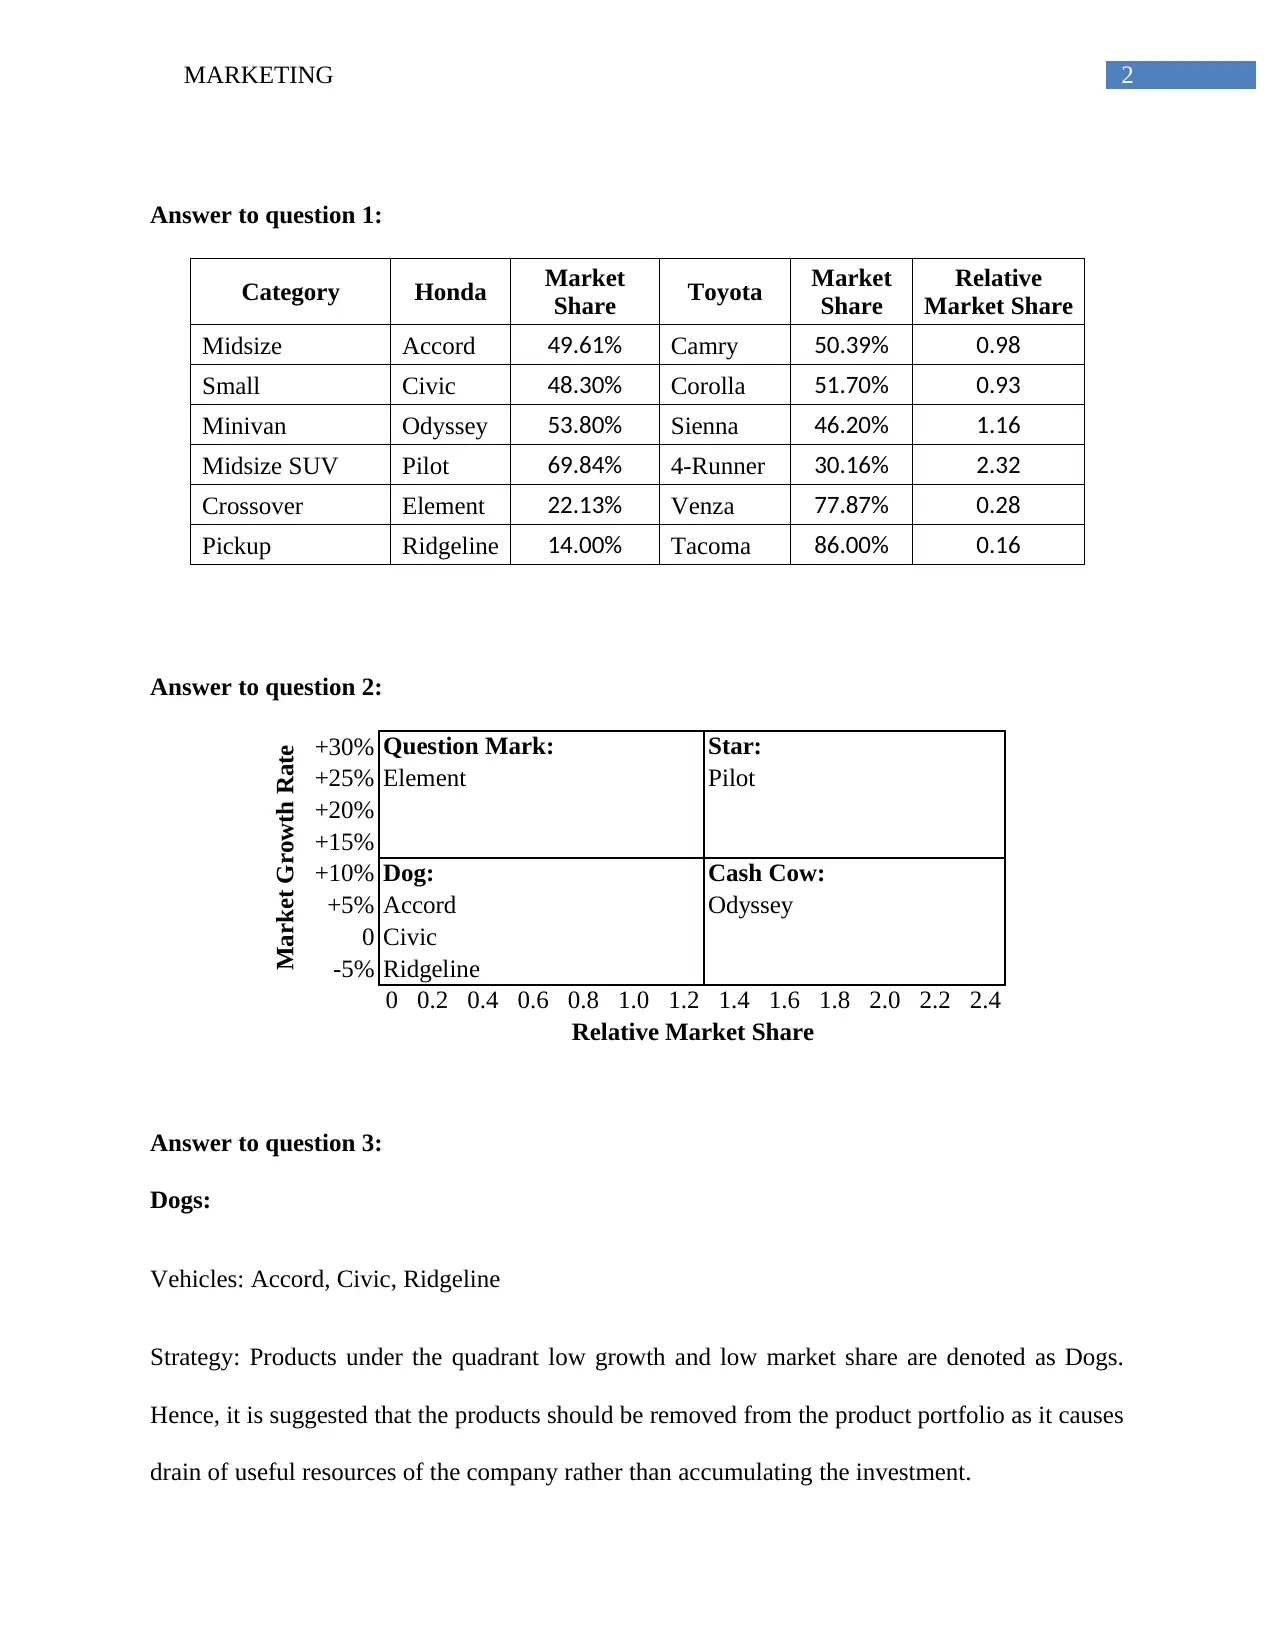
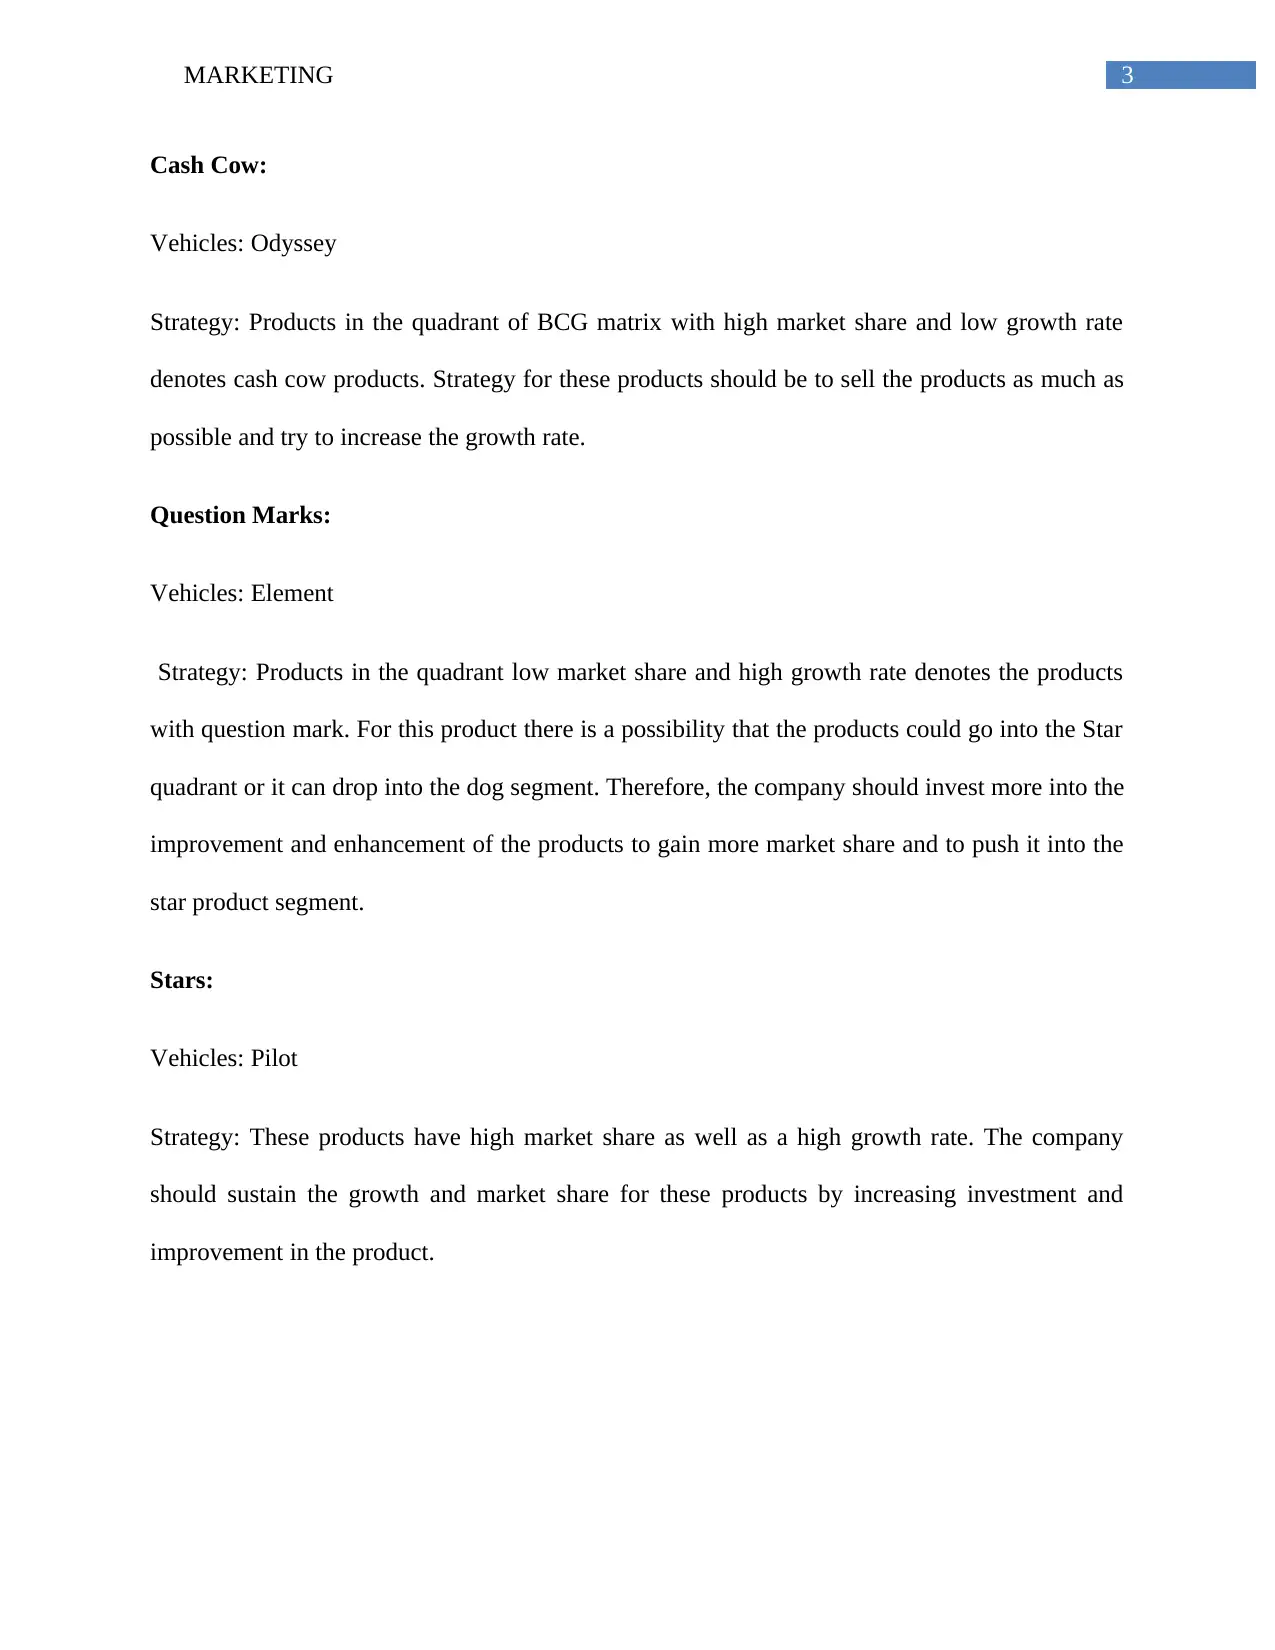
This report analyzes the Honda Motor Company's vehicle portfolio, focusing on six key vehicle categories: midsize, small, minivan, midsize SUV, crossover, and pickup trucks. The analysis compares Honda's market share to that of its competitor, Toyota, using 2010 sales data. The report applies the Boston Consulting Group (BCG) matrix to categorize each vehicle based on its market share and growth rate, classifying them as Dogs, Cash Cows, Question Marks, or Stars. Based on these classifications, the report suggests strategic recommendations for each vehicle, including whether to remove products, maximize sales, invest in improvement, or sustain growth. The report also includes a bibliography of cited sources.
Document Page
Running head: MARKETING
Marketing
Name of the Student:
Name of the University:
Author’s Note:
tabler-icon-diamond-filled.svg

Paraphrase This Document

Need a fresh take? Get an instant paraphrase of this document with our AI Paraphraser
Document Page
1MARKETING
Table of Contents
Answer to question 1:......................................................................................................................2
Answer to question 2:......................................................................................................................2
Answer to question 3:......................................................................................................................2
Bibliography:...................................................................................................................................4
Document Page
2MARKETING
Answer to question 1:
Category Honda Market
Share Toyota Market
Share
Relative
Market Share
Midsize Accord 49.61% Camry 50.39% 0.98
Small Civic 48.30% Corolla 51.70% 0.93
Minivan Odyssey 53.80% Sienna 46.20% 1.16
Midsize SUV Pilot 69.84% 4-Runner 30.16% 2.32
Crossover Element 22.13% Venza 77.87% 0.28
Pickup Ridgeline 14.00% Tacoma 86.00% 0.16
Answer to question 2:
+30% Question Mark: Star:
+25% Element Pilot
+20%
+15%
+10% Dog: Cash Cow:
+5% Accord Odyssey
0 Civic
-5% Ridgeline
0 0.2 0.4 0.6 0.8 1.0 1.2 1.4 1.6 1.8 2.0 2.2 2.4
Market Growth Rate
Relative Market Share
Answer to question 3:
Dogs:
Vehicles: Accord, Civic, Ridgeline
Strategy: Products under the quadrant low growth and low market share are denoted as Dogs.
Hence, it is suggested that the products should be removed from the product portfolio as it causes
drain of useful resources of the company rather than accumulating the investment.
Document Page
3MARKETING
Cash Cow:
Vehicles: Odyssey
Strategy: Products in the quadrant of BCG matrix with high market share and low growth rate
denotes cash cow products. Strategy for these products should be to sell the products as much as
possible and try to increase the growth rate.
Question Marks:
Vehicles: Element
Strategy: Products in the quadrant low market share and high growth rate denotes the products
with question mark. For this product there is a possibility that the products could go into the Star
quadrant or it can drop into the dog segment. Therefore, the company should invest more into the
improvement and enhancement of the products to gain more market share and to push it into the
star product segment.
Stars:
Vehicles: Pilot
Strategy: These products have high market share as well as a high growth rate. The company
should sustain the growth and market share for these products by increasing investment and
improvement in the product.
tabler-icon-diamond-filled.svg

Paraphrase This Document

Need a fresh take? Get an instant paraphrase of this document with our AI Paraphraser
Document Page
4MARKETING
Bibliography:
Smith C. Portfolio Management. Wiley Encyclopedia of Management. 2015 Jan 5:1-3.
Whitehead J. BCG (Growth Share) Matrix. Wiley Encyclopedia of Management. 2015 Jan 5:1-2.
chevron_up_icon
1 out of 5
circle_padding
hide_on_mobile
zoom_out_icon
[object Object]