Financial Performance Analysis Report: Hornby and Games Workshop
VerifiedAdded on 2022/11/30
|15
|4039
|298
Report
AI Summary
This report provides a detailed financial analysis of Hornby plc and Games Workshop plc, focusing on key performance indicators and financial ratios. The analysis includes an examination of profitability, liquidity, efficiency, and solvency ratios, such as net profit margin, gross profit margin, operating profit margin, return on assets, return on equity, current ratio, quick ratio, and asset turnover ratio. The report evaluates the cash flow performance, funding structure, and share price movements of Hornby plc, highlighting its financial challenges and the impact on investor decisions. The report also analyzes the financial performance of Games Workshop plc, comparing its results with Hornby and providing insights into the companies' strengths and weaknesses. The analysis aims to assess the financial health and performance of both companies, offering a comprehensive overview for investors and stakeholders.
Financial Analysis
Paraphrase This Document
Need a fresh take? Get an instant paraphrase of this document with our AI Paraphraser
Table of Contents
Introduction-................................................................................................................................................3
Task – 1-......................................................................................................................................................3
Task – 2-......................................................................................................................................................9
Conclusion-...............................................................................................................................................13
References-................................................................................................................................................13
Introduction-
This report is based on financial analysis. Financial analysis of a company is very important to
know the financial performance of the company. Financial performance of the company is
measured by ratios. Various kind of ratios are calculated in order to know that how company is
performing and comparison can be done with similar industries. Ratios include liquidity,
profitability, efficiency and solvency. These are the important ratios which are measured by
companies.
In this report Hornby plc and games workshop plc’s financial performance is analyzed. Hornby
plc is founded by Frank Hornby in 1901. It is British railway model brand. It is listed on London
stock exchange. Company has faced financial troubles in June 2017 and currently it is owned by
phoenix asset management. Net income of the company in 2020 is -£2.8 million. Company has
currently 191 working employees.( Yoon, Hong 2018)
On the other hand, games workshop plc is manufacturer of miniature wargaming. It is located at
Nottingham, England. This company is also listed on London stock exchange. It is founded by
John Peake in 1975. net income of the company is £71.3 million. Financial performance of both
companies is analyzed according to point of view of investors.
Task – 1-
Analysis of sales and profitability-
Net profit margin-
It is defined as profit earned by company from sales after subtracting all the expenses. Net profit
margin can be calculated by dividing net profit by net sales. It is also known as percentage of net
income earned by company. In context of hornby plc, company’s profitability ratio is showing
negative sign. It means company is suffering from losses. No profit is earned by company. In the
year 2018 net profit margin is -27.64% and in 2019 it is -16.21. So, it can be interpreted that in
2019 had less losses when it is compared to 2018. Net sales of the company is good but profit
earned from sales is negative. It can be due to operating expenses or production spending.
⊘ This is a preview!⊘
Do you want full access?
Subscribe today to unlock all pages.
Trusted by 1+ million students worldwide
Gross profit margin-
Gross profit margin is that margin which is earned by company after deducting production cost
of product. As it can be seen that gross profit margin of the company is increasing in 2019. It is a
positive sign for the company. It means production cost in 2018 is more than 2019. In the recent
year, company performed better and it increases gross profit margin. It increases from 38.57 to
40.93. It can be seen that there is 2% increase in gross profit margin.
Operating Profit margin-
Operating profit of the company can be calculated by deducting all the operating expenses of the
company from gross profit. These operating expenses include distribution cost, selling and
marketing cost, administrative expenses and other expenses. (Gen, Park….2020)
It can be seen from the income statement that marketing expenses and distribution expenses of
the company is more than expected. Company has negative operating profit margin which is
danger for company. Operating profit margin of the company in 2018 is -27.68% and in 2019 it
is -15.94%. It is an indicator that company needs to reduce its marketing and distribution
expenses.
Return on assets-
Return on assets is a profitability ratio. It indicates the profitability of the company related to its
assets. It is very important for investors to know that efficiency of company in management of its
assets. Return on assets must be between 5% to 20%. Here, it can be seen that ROA of the
company is negative. (Robaina, Madaleno….2020) It clearly indicates that company is suffering
from financial losses. It is better for investor to not invest in this company otherwise he will
experience loss. There is an increase in return on assets it means company is trying to perform
better.
Return on equity-
Return on equity ratio is used to measure the financial performance of the company. Profitability
of the company can be checked in relation to equity. If return on equity is less than 10% then it is
considered as poor. From the above table it can be seen that there is negative return on equity. It
Paraphrase This Document
Need a fresh take? Get an instant paraphrase of this document with our AI Paraphraser
means company is generating negative profit related to equity. In 2018 return on equity is -0.31
and in 2019 it is -0.21. So, it can be said that company is not performing good and suffering from
financial losses.
Cash flow performance
Hornby Plc: The cash flow performance presenting the different activities of business in broad
manner. In this statement presents all the expenses and income that relate with the different
operations that occur in cash. This statement has been categorized into three parts such as,
operational activities, investment and financing activities. Cash flow from operation activities in
the year of 2018 was 924 due to settled share payments in effective manner and in the year 2019
was 165 because of paid interest so get negative results. Cash flow from investing activities that
in 2018 was 1425 because of acquisition of associate and in 2019 was 175 in positive manner. As
per the financing activities in 2018 was 2347 in 2019 was 13 in negative. Along with analysis the
cash and cash equivalents that was 4 in 2018 and 1 in 2019. At the end of the both years cash end
of the year was 4 in 2018 and 1 was in 2019. It is presenting that in the year of 2018 company
had good performance but in the 2019 performance falls down that impact on efficiency of
business.
Analysis of liquidity-
Liquidity is very important for company. It is cash generation capacity of the company beyond
its liabilities. It is measurement of hard cash company has in order to expand its business.
Liquidity of the company can be measured by current ratio, quick ratio and cash ratio. Liquidity
ratio of the company can be calculated as-
Current ratio-
Current ratio is liquidity ratio. It is defined as capability of the company in meeting its short term
obligations or short term debts. Current ratio can be calculated by dividing the current assets by
current liabilities. Ideal current ratio is 2:1. It means current assets must always be higher than
current liabilities. In the table, it is seen that current ratio in 2018 is 1.32 and in 2019 it is 1.66.
Both the year has less than two current ratio. So, It can be interpreted that company may face
difficulties in meeting its short term debts. It can affect the goodwill of the company.
Quick ratio-
It is defined as capability of the company in achieving its short term goals with its most liquid
assets. It does not count the inventory as quick asset. So, that inventory is subtracted from the
quick assets. Ideal quick ratio of the company is 1:1. In case of, Hornby quick ratio is less than
one. It means company has low liquidity.
Efficiency analysis of company-
Asset turnover ratio-
It is an efficiency ratio. Company’s value of sales and revenues can be covered related to value
of assets. Efficiency of the company can be measured that how well company is generating
revenue by using its assets. Higher turnover ratio indicates that company is efficiently generating
profit from its assets. On the other hand, if company is not generating revenue from its assets
then it is considered as inefficient. In retail sector asset turnover ratio of 2.5 is considered as
good and on the other hand in utility sector asset turnover ratio is between 0.25 to 0.5. In case of
Honrnby, Asset turnover ratio is 1.79 and 1.74. It is considered as good and it can be interpreted
that company has high efficiency.
Inventory turnover ratio-
It is measurement of number of times inventory is sold in a specific time of period. It is also
known as stock turn or stock turnover. It can be calculated by dividing cost of goods sold by
average inventory. Ideal turnover ratio is between 5 to 10. Inventory turnover ratio in 2018 is
2.18 and in 2019 it is 1.78. It is very low inventory turnover ratio. It can be due to low sales and
overstocking.
Funding structure of hornby plc-
There are two ways by company can raise funds equity and debt. Total equity in 2019 of the
company is 25799 and debt is 12670. So, it can be clearly seen that company is more reliable on
⊘ This is a preview!⊘
Do you want full access?
Subscribe today to unlock all pages.
Trusted by 1+ million students worldwide
raising funds from equity. In the year 2018, equity is 30864 and debt is 15248. Overall it can be
said that company believes in raising fund from its equity.
Fund raising is most important activity for an organization. Company raise capital from
operations, by debt and by equity capital. External investors are involved in raising capital from
equity and debt. Financial structure of the company is very essential for management of
company and shareholders as it considers variety of modes of financing in order to support its
operations. Two main components of financial structure are long term and short term. Financial
structure of the company can be analyzed by focusing on two main metrices which is debt and
equity. (Bacerra, Mayo…2020)
Share price movements-
As it is clear from financial ratios that company is facing losses and company’s performance is
not as expected. It definitely affects the share price movement of company in downward
direction. If company is not generating profits then it is difficult for investors to get attracted.
Survival of the company is very difficult. Currently share price of the company is 57.44. There
are many fluctuations in chart. In November 2020, highest peak was 70. In November share price
were highest. Then there is fall in share price can be seen. Reason behind fall in share price is
poor performance of the company. Company is not generating profit. This is the main reason
behind fall in the share price.
Dividend policy-
Dividend policy is the policy of the company is to pay dividends to pay its shareholders. There
are three types of dividend policy which are stable, constant and residual. Company decided to
not to pay interim dividends to its shareholders as company is facing financial losses. Company
needs to improve its performance by reducing operating expenses so that it will help in
generating overall profit. (Gen, Park….2020)
Task – 2-
Profitability Analysis-
Net profit margin-
Paraphrase This Document
Need a fresh take? Get an instant paraphrase of this document with our AI Paraphraser
From the above calculation it is determined that net profitability of company in 2019 was
increasing in compare of the 2018. The net profit of the company was 59455 in 2018 that was
increasing and identified 65821 in 2019. Due to increasing the profit the ratio identified the
results, 372.22% in 2018 and 389.91% in 2019. These results are presetting that company has
effective performance in adequate manner.
Gross profit margin-
As per the above table it has been analyzed that in the year of 2018 revenue of the company was
221304 that was increasing in 2019 reach on 256574. To calculate the profitability of business
apply this ratio that presents the profitability level in adequate manner and get results that in
2018 it was 70.98% that was increasing in 2019, 67.53%. (Agyei-Mensah …2018)Thus, it
presents the goof performance level and increasing profit level of business in positive manner.
Operating profit margin-
Operating profit margin of the company in 2018 is 33.58 and in 2019 it is 31.64. So, it can be
said that there is reduction in operating profit margin. Reduction in this ratio is caused by
increased operating expenses.
Return on assets-
There is decrease can be seen in the cash generation capacity of the company by using its assets.
In 2018 ratio is 50.32 and in 2019 it is 47.82. Company’s return on assets in more than 20%
which clearly indicates that company is profitable and financial performance is good.
Return on equity-
It is used to measure the profitability of company related to its assets. Anything less than 10% is
considered as poor. Return on equity of the company is very good. Hence, it can be said that
overall profitability of the company is very good.
Cash flow performance: There are analyzing the cash activities in 2018 and 2019 that present
the actual performance of business. Any investor before the investment analysis this statement
that presents cash inflow and outflow in proper manner. (Hutahayan….2020)
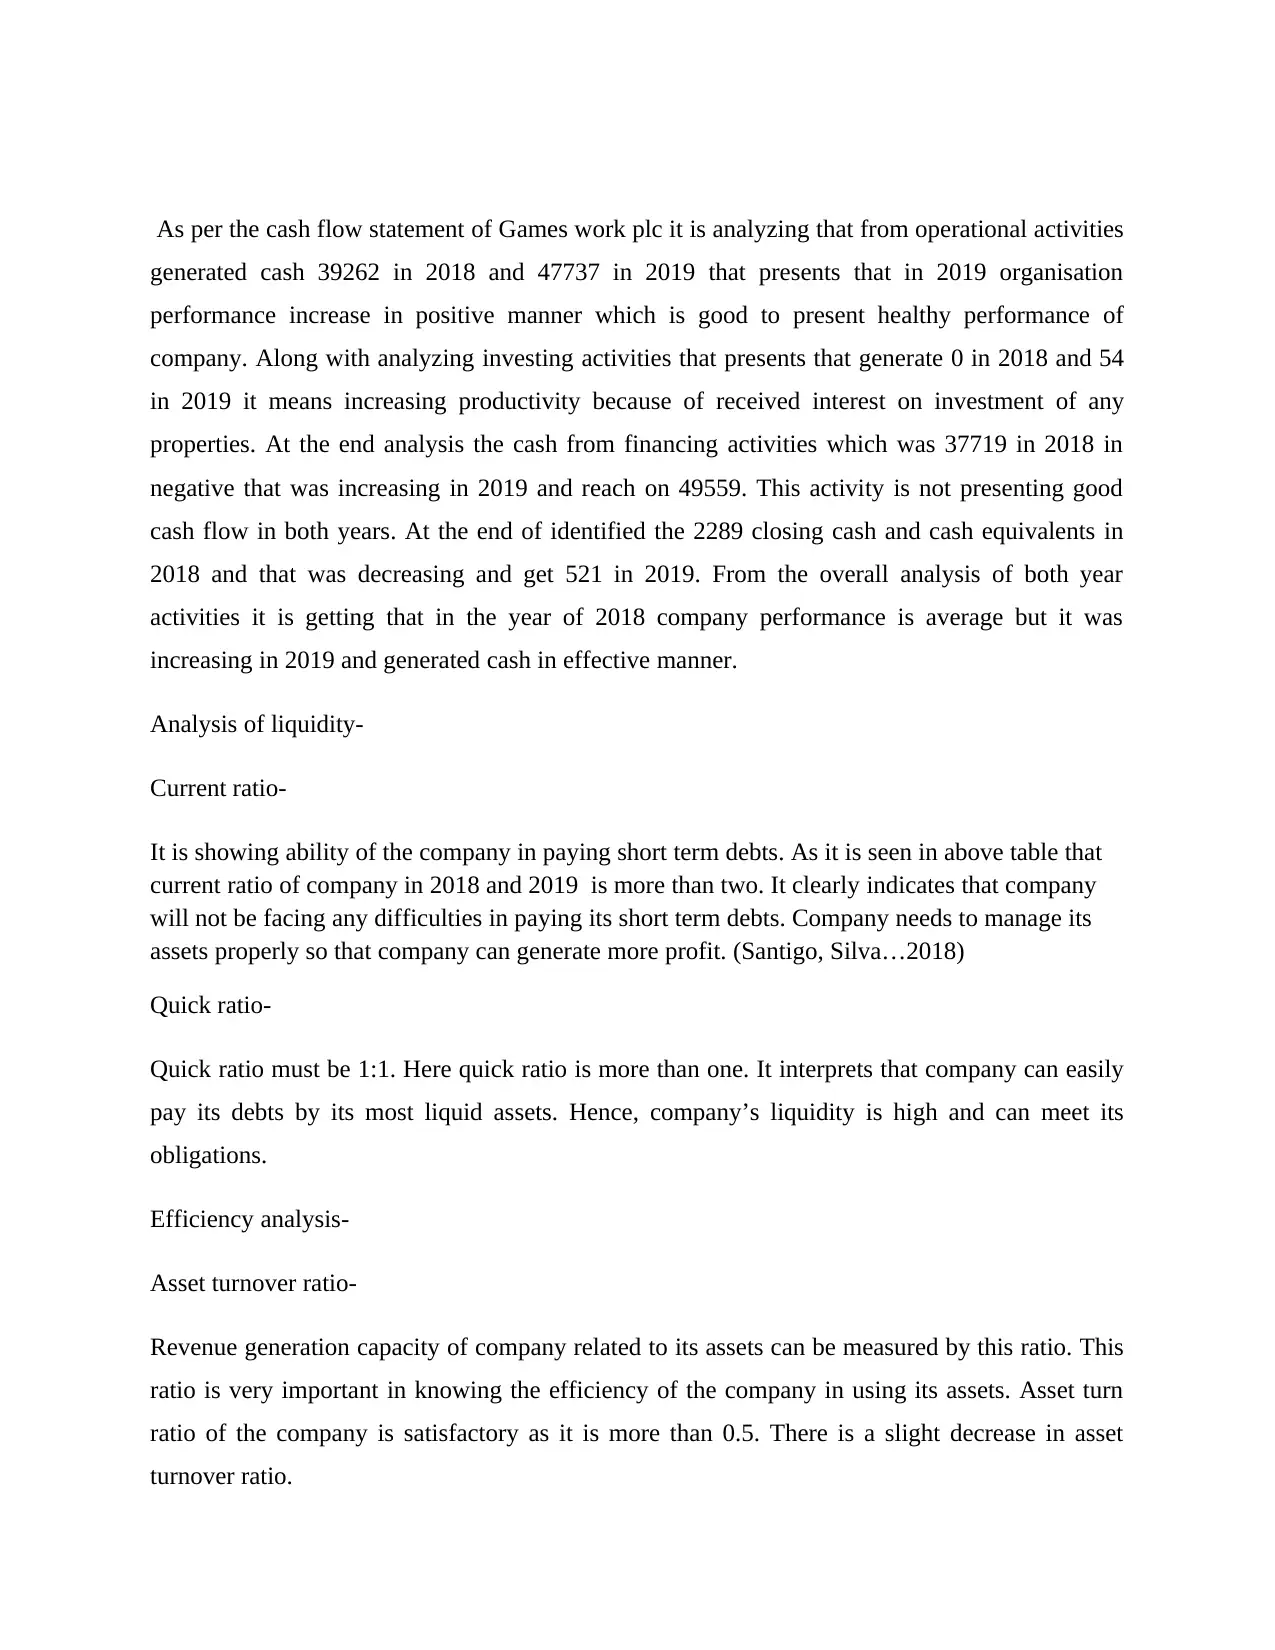
As per the cash flow statement of Games work plc it is analyzing that from operational activities
generated cash 39262 in 2018 and 47737 in 2019 that presents that in 2019 organisation
performance increase in positive manner which is good to present healthy performance of
company. Along with analyzing investing activities that presents that generate 0 in 2018 and 54
in 2019 it means increasing productivity because of received interest on investment of any
properties. At the end analysis the cash from financing activities which was 37719 in 2018 in
negative that was increasing in 2019 and reach on 49559. This activity is not presenting good
cash flow in both years. At the end of identified the 2289 closing cash and cash equivalents in
2018 and that was decreasing and get 521 in 2019. From the overall analysis of both year
activities it is getting that in the year of 2018 company performance is average but it was
increasing in 2019 and generated cash in effective manner.
Analysis of liquidity-
Current ratio-
It is showing ability of the company in paying short term debts. As it is seen in above table that
current ratio of company in 2018 and 2019 is more than two. It clearly indicates that company
will not be facing any difficulties in paying its short term debts. Company needs to manage its
assets properly so that company can generate more profit. (Santigo, Silva…2018)
Quick ratio-
Quick ratio must be 1:1. Here quick ratio is more than one. It interprets that company can easily
pay its debts by its most liquid assets. Hence, company’s liquidity is high and can meet its
obligations.
Efficiency analysis-
Asset turnover ratio-
Revenue generation capacity of company related to its assets can be measured by this ratio. This
ratio is very important in knowing the efficiency of the company in using its assets. Asset turn
ratio of the company is satisfactory as it is more than 0.5. There is a slight decrease in asset
turnover ratio.
⊘ This is a preview!⊘
Do you want full access?
Subscribe today to unlock all pages.
Trusted by 1+ million students worldwide
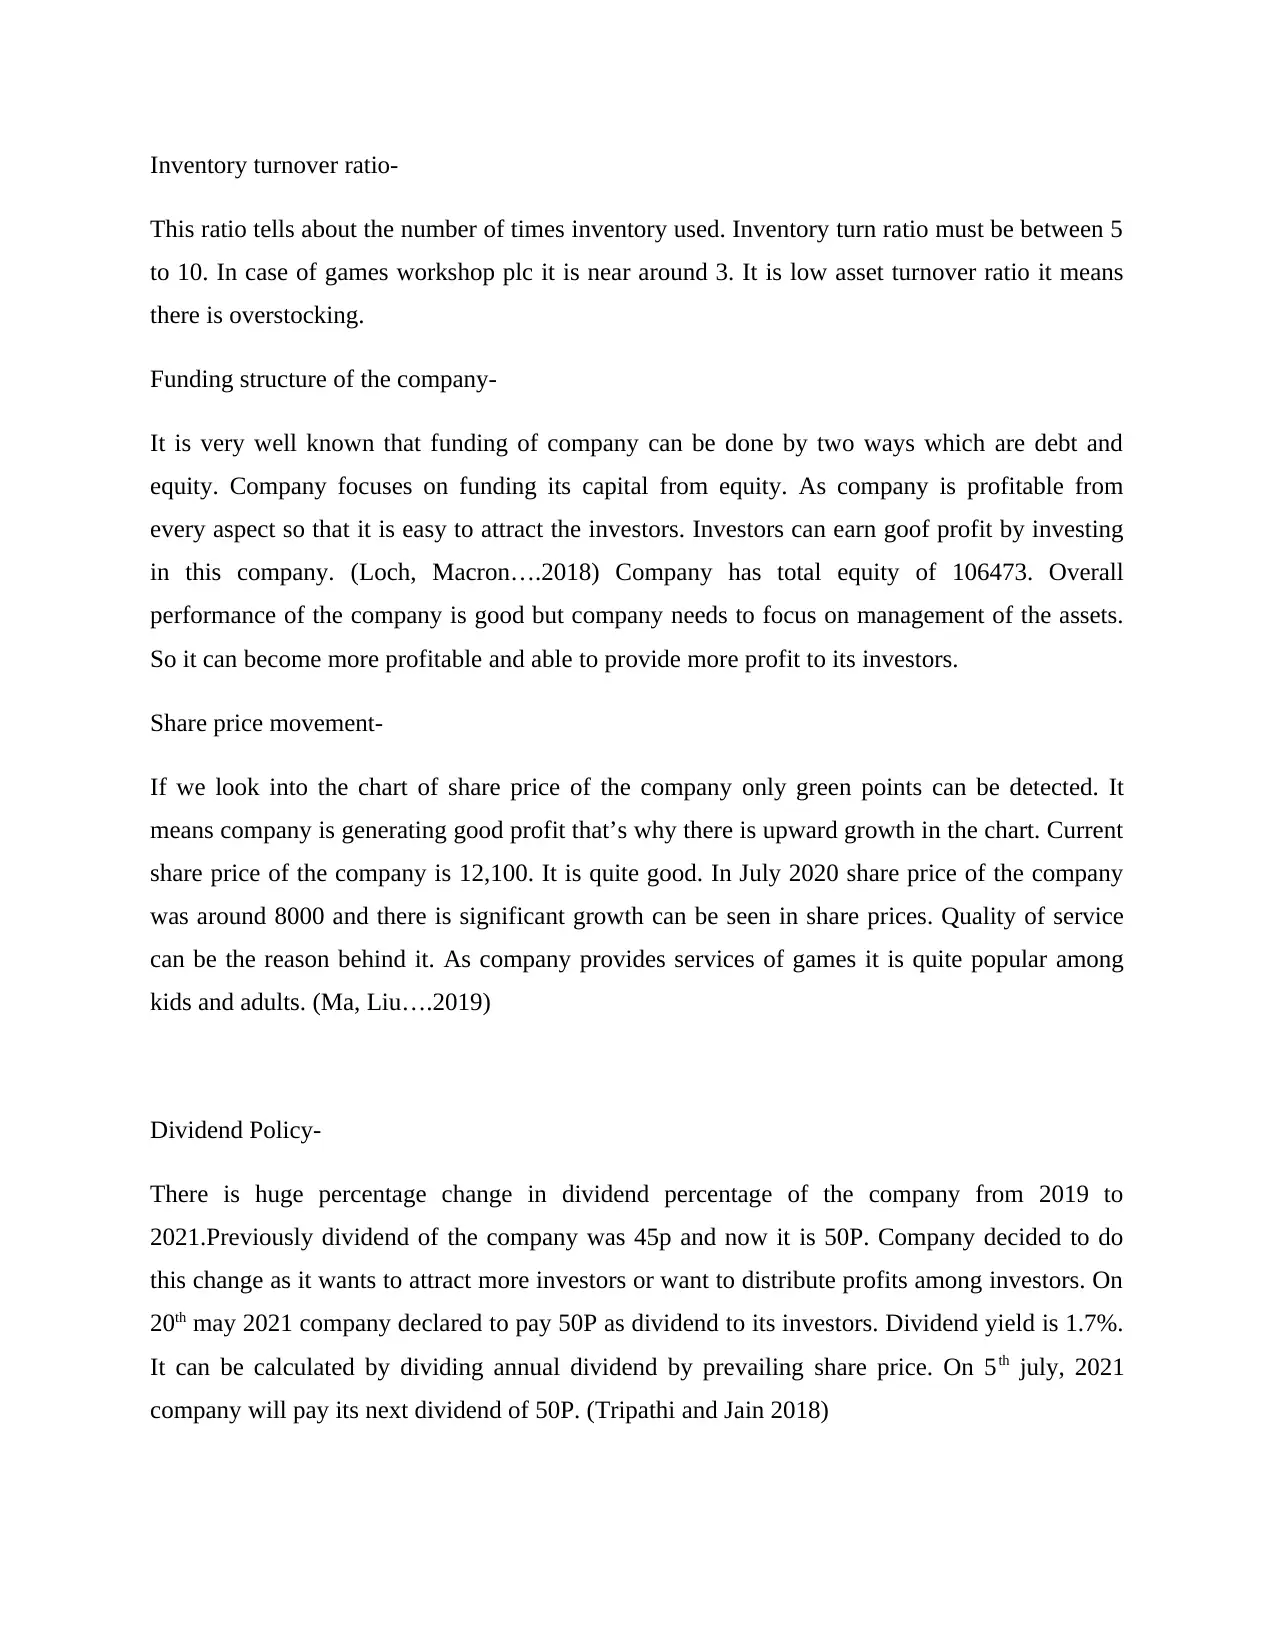
Inventory turnover ratio-
This ratio tells about the number of times inventory used. Inventory turn ratio must be between 5
to 10. In case of games workshop plc it is near around 3. It is low asset turnover ratio it means
there is overstocking.
Funding structure of the company-
It is very well known that funding of company can be done by two ways which are debt and
equity. Company focuses on funding its capital from equity. As company is profitable from
every aspect so that it is easy to attract the investors. Investors can earn goof profit by investing
in this company. (Loch, Macron….2018) Company has total equity of 106473. Overall
performance of the company is good but company needs to focus on management of the assets.
So it can become more profitable and able to provide more profit to its investors.
Share price movement-
If we look into the chart of share price of the company only green points can be detected. It
means company is generating good profit that’s why there is upward growth in the chart. Current
share price of the company is 12,100. It is quite good. In July 2020 share price of the company
was around 8000 and there is significant growth can be seen in share prices. Quality of service
can be the reason behind it. As company provides services of games it is quite popular among
kids and adults. (Ma, Liu….2019)
Dividend Policy-
There is huge percentage change in dividend percentage of the company from 2019 to
2021.Previously dividend of the company was 45p and now it is 50P. Company decided to do
this change as it wants to attract more investors or want to distribute profits among investors. On
20th may 2021 company declared to pay 50P as dividend to its investors. Dividend yield is 1.7%.
It can be calculated by dividing annual dividend by prevailing share price. On 5th july, 2021
company will pay its next dividend of 50P. (Tripathi and Jain 2018)
Paraphrase This Document
Need a fresh take? Get an instant paraphrase of this document with our AI Paraphraser
Conclusion-
In the above report, financial analysis of hornby plc and games workshop plc is done. It is
concluded that difference in the performance between two companies is very huge. As Hornby
plc is suffering from financial losses. There are not profits earned by company and it is also fail
to make happy their investors by giving poor performance. On the other hand, games warehouse
plc, is performing very well. Company performed above expectations according to investors. It is
very clear after analyzing financial ratios that company needs to perform well in order to survive
in the market.
There are some suggestions can be given to hornby plc, is that company needs to focus on
increasing its profit by reducing expenses. As it is seen in income statement that company has
high operating expenses that’s why it is not able to generate profit. Financial manager is
responsible for controlling expenses. On the other hand, Games workshop plc needs to manage
its assets in proper way so that company can earn more profit. Company needs to improve its
efficiency when it comes to inventory. Thus, it can be said that good financial performance of the
company is very important in order to survive in the market.
References-
Books and journals-
Yoon, G., Li, C., Ji, Y., North, M., Hong, C. and Liu, J., 2018. Attracting comments: Digital
engagement metrics on Facebook and financial performance. Journal of Advertising, 47(1),
pp.24-37.
Robaina, M. and Madaleno, M., 2020. The relationship between emissions reduction and
financial performance: Are Portuguese companies in a sustainable development path?. Corporate
Social Responsibility and Environmental Management, 27(3), pp.1213-1226.
Deng, Y., Zou, S. and You, D., 2020. Financial performance evaluation of nuclear power-related
enterprises from the perspective of sustainability. Environmental Science and Pollution
Research, 27(10), pp.11349-11363.
Agyei-Mensah, B.K., 2018. Impact of corporate governance attributes and financial reporting lag
on corporate financial performance. African Journal of Economic and Management Studies.
Smulowitz, S., Becerra, M. and Mayo, M., 2019. Racial diversity and its asymmetry within and
across hierarchical levels: The effects on financial performance. Human Relations, 72(10),
pp.1671-1696.
Gan, H., Park, M.S. and Suh, S., 2020. Non-financial performance measures, CEO
compensation, and firms’ future value. Journal of Business Research, 110, pp.213-227.
Hutahayan, B., 2020. The mediating role of human capital and management accounting
information system in the relationship between innovation strategy and internal process
performance and the impact on corporate financial performance. Benchmarking: An
International Journal.
Santiago, A., Pandey, S. and Manalac, M.T., 2019. Family presence, family firm reputation and
perceived financial performance: Empirical evidence from the Philippines. Journal of Family
Business Strategy, 10(1), pp.49-56.
Loch, M., Marcon, R., da Silva, A.L.P. and Xavier, W.G., 2018. Government's impact on the
financial performance of electric service providers as both regulator and shareholder. Utilities
Policy, 55, pp.142-150.
Ma, W., Jin, M., Liu, Y. and Xu, X., 2019. Empirical analysis of fractional differential equations
model for relationship between enterprise management and financial performance. Chaos,
Solitons & Fractals, 125, pp.17-23.
Tripathi, M., Kashiramka, S. and Jain, P.K., 2018. Flexibility in measuring corporate financial
performance, EVA versus conventional earnings measures: Evidences from India and
China. Global Journal of Flexible Systems Management, 19(2), pp.123-138.
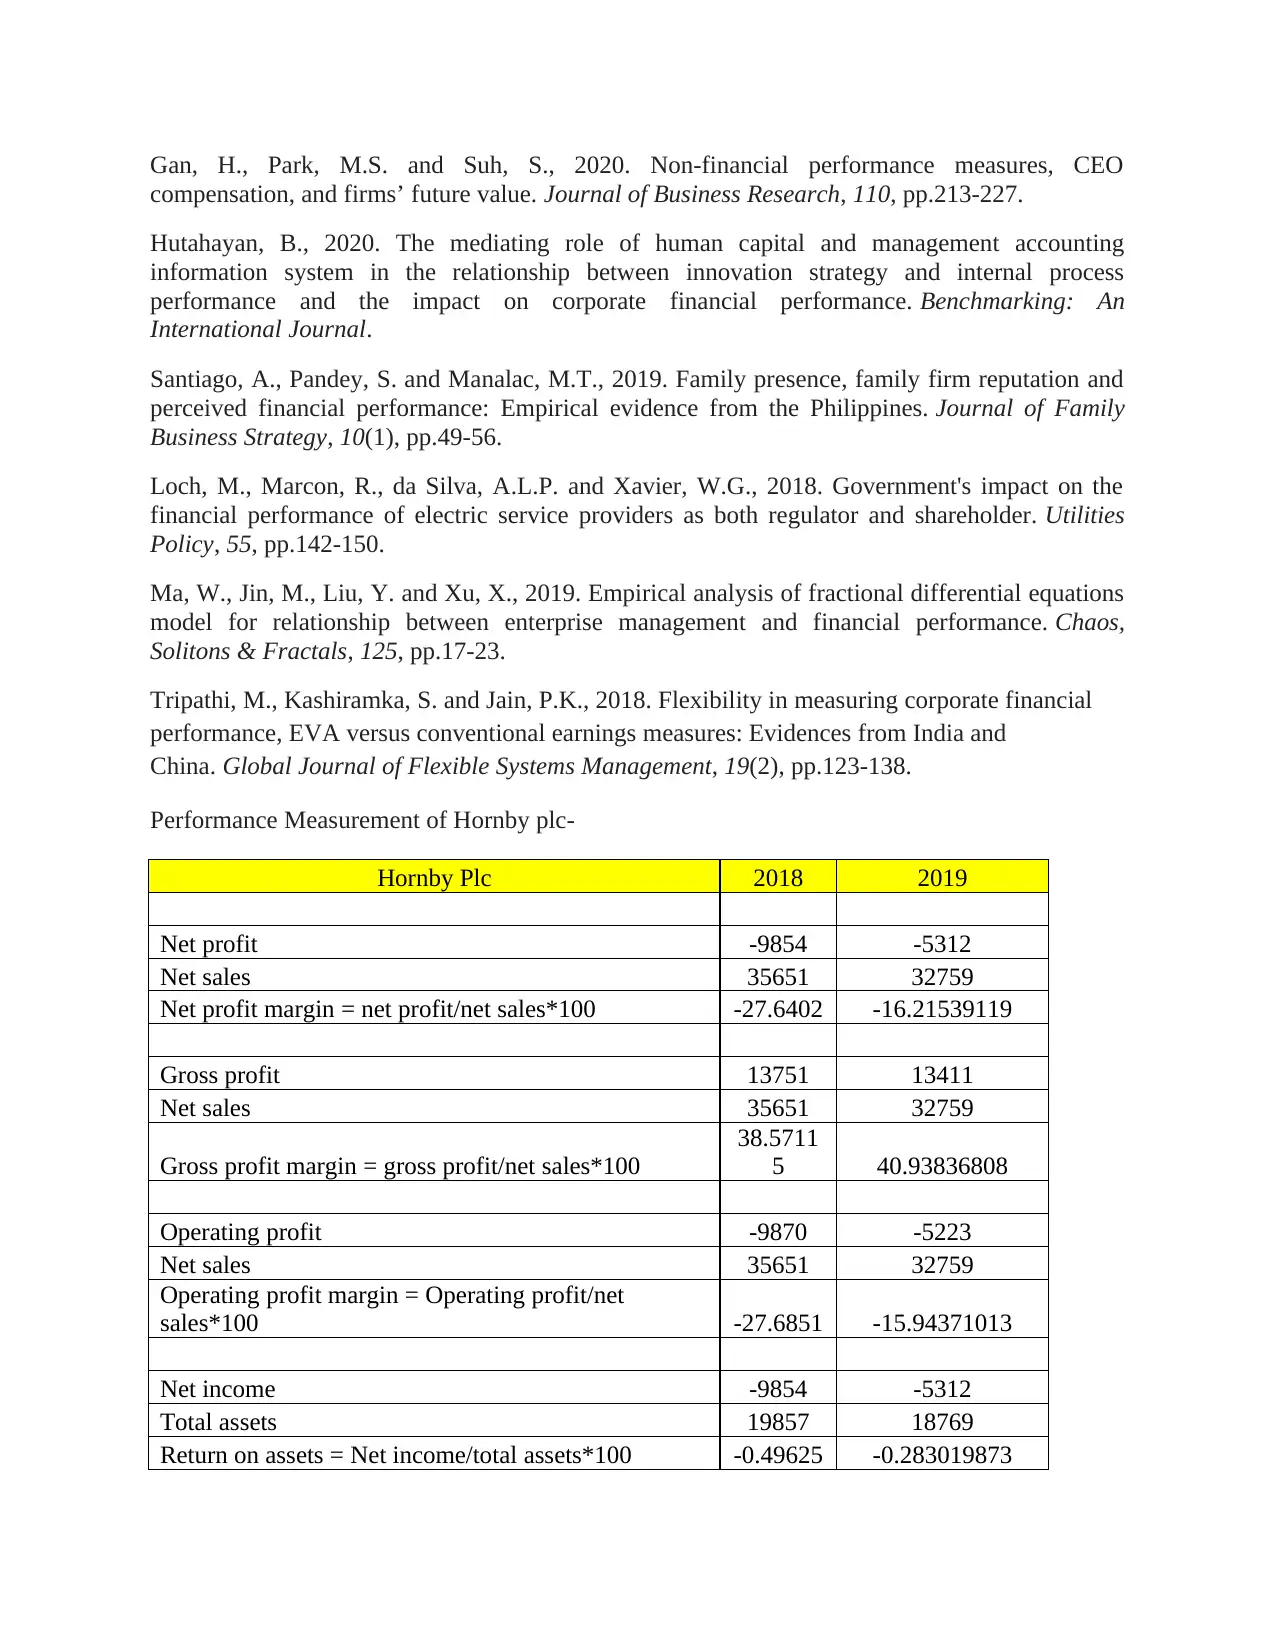
Performance Measurement of Hornby plc-
Hornby Plc 2018 2019
Net profit -9854 -5312
Net sales 35651 32759
Net profit margin = net profit/net sales*100 -27.6402 -16.21539119
Gross profit 13751 13411
Net sales 35651 32759
Gross profit margin = gross profit/net sales*100
38.5711
5 40.93836808
Operating profit -9870 -5223
Net sales 35651 32759
Operating profit margin = Operating profit/net
sales*100 -27.6851 -15.94371013
Net income -9854 -5312
Total assets 19857 18769
Return on assets = Net income/total assets*100 -0.49625 -0.283019873
compensation, and firms’ future value. Journal of Business Research, 110, pp.213-227.
Hutahayan, B., 2020. The mediating role of human capital and management accounting
information system in the relationship between innovation strategy and internal process
performance and the impact on corporate financial performance. Benchmarking: An
International Journal.
Santiago, A., Pandey, S. and Manalac, M.T., 2019. Family presence, family firm reputation and
perceived financial performance: Empirical evidence from the Philippines. Journal of Family
Business Strategy, 10(1), pp.49-56.
Loch, M., Marcon, R., da Silva, A.L.P. and Xavier, W.G., 2018. Government's impact on the
financial performance of electric service providers as both regulator and shareholder. Utilities
Policy, 55, pp.142-150.
Ma, W., Jin, M., Liu, Y. and Xu, X., 2019. Empirical analysis of fractional differential equations
model for relationship between enterprise management and financial performance. Chaos,
Solitons & Fractals, 125, pp.17-23.
Tripathi, M., Kashiramka, S. and Jain, P.K., 2018. Flexibility in measuring corporate financial
performance, EVA versus conventional earnings measures: Evidences from India and
China. Global Journal of Flexible Systems Management, 19(2), pp.123-138.
Performance Measurement of Hornby plc-
Hornby Plc 2018 2019
Net profit -9854 -5312
Net sales 35651 32759
Net profit margin = net profit/net sales*100 -27.6402 -16.21539119
Gross profit 13751 13411
Net sales 35651 32759
Gross profit margin = gross profit/net sales*100
38.5711
5 40.93836808
Operating profit -9870 -5223
Net sales 35651 32759
Operating profit margin = Operating profit/net
sales*100 -27.6851 -15.94371013
Net income -9854 -5312
Total assets 19857 18769
Return on assets = Net income/total assets*100 -0.49625 -0.283019873
⊘ This is a preview!⊘
Do you want full access?
Subscribe today to unlock all pages.
Trusted by 1+ million students worldwide
1 out of 15
Related Documents


Your All-in-One AI-Powered Toolkit for Academic Success.
+13062052269
info@desklib.com
Available 24*7 on WhatsApp / Email
![[object Object]](/_next/static/media/star-bottom.7253800d.svg)
Unlock your academic potential
Copyright © 2020–2026 A2Z Services. All Rights Reserved. Developed and managed by ZUCOL.