In-depth Financial Analysis of Hornby PLC - Accounts Report 2021
VerifiedAdded on 2023/06/12
|15
|3168
|348
Report
AI Summary
This report provides a comprehensive financial analysis of Hornby PLC, focusing on the years 2019 and 2020. It examines sales and profitability, cash flow trends, liquidity condition, efficiency, and leveraging. The analysis includes ratio calculations such as current ratio, quick ratio, gearing ratio, and interest coverage ratio to assess the company's financial health. The report also evaluates Hornby's stock value, dividend strategy, and recent acquisitions. Key findings indicate improved sales, reduced operational costs, and enhanced liquidity in 2020, attributed to restructuring plans and increased online sales during the COVID-19 pandemic. The analysis aims to provide entrepreneurs with valuable insights into Hornby PLC's financial performance and investment potential.

Accounts
Paraphrase This Document
Need a fresh take? Get an instant paraphrase of this document with our AI Paraphraser
Contents
Contents...........................................................................................................................................2
INTRODUCTION...........................................................................................................................1
MAIN BODY..................................................................................................................................1
Ratio analysis...............................................................................................................................1
CONCLUSION..............................................................................................................................10
REFERENCES..............................................................................................................................11
APPENDIX....................................................................................................................................12
INTRODUCTION
Financial statement of a company is one of the most essential as well as crucial document as
it helps in analysing and evaluating the profitability of the firm and also ensuring that the firm
can sustain and survive in the market which is highly competitive and dynamic in nature. There
are a number of methods and ratios which can be used to identify and analyse the efficiency of
the company so that a complete and comprehensive view of the firm can be made which can
prove beneficial in the long run scenario. This document is intended to be provided to an
entrepreneur as the assessment is based on an examination of Hornby PLC's fiscal achievements
and situation (Allain, Lemaire and Lux, 2021). We reviewed the revenue summary, monetary
statements, profit and loss accounts, and appendices to fiscal declaration to determine the exact
status of the firm, which has been afflicted by long-term monetary difficulties. Finance statistics
such as selling, productivity, effectiveness, solvency situation, and finance leverage have all been
examined. The document also includes an examination of stock market progress. This section
also contains the most recent business information. While choosing an investing choice on the
firm, the data which has been reviewed is really important. Hornby Company increased its sales
by 15% to $37.8 million in 2020. Deficits before taxes, on either side, decreased by 35.8%. This
is attributable to the firm's new plan being implemented. The paper looked at the years 2019 and
2020.
MAIN BODY
Ratio analysis
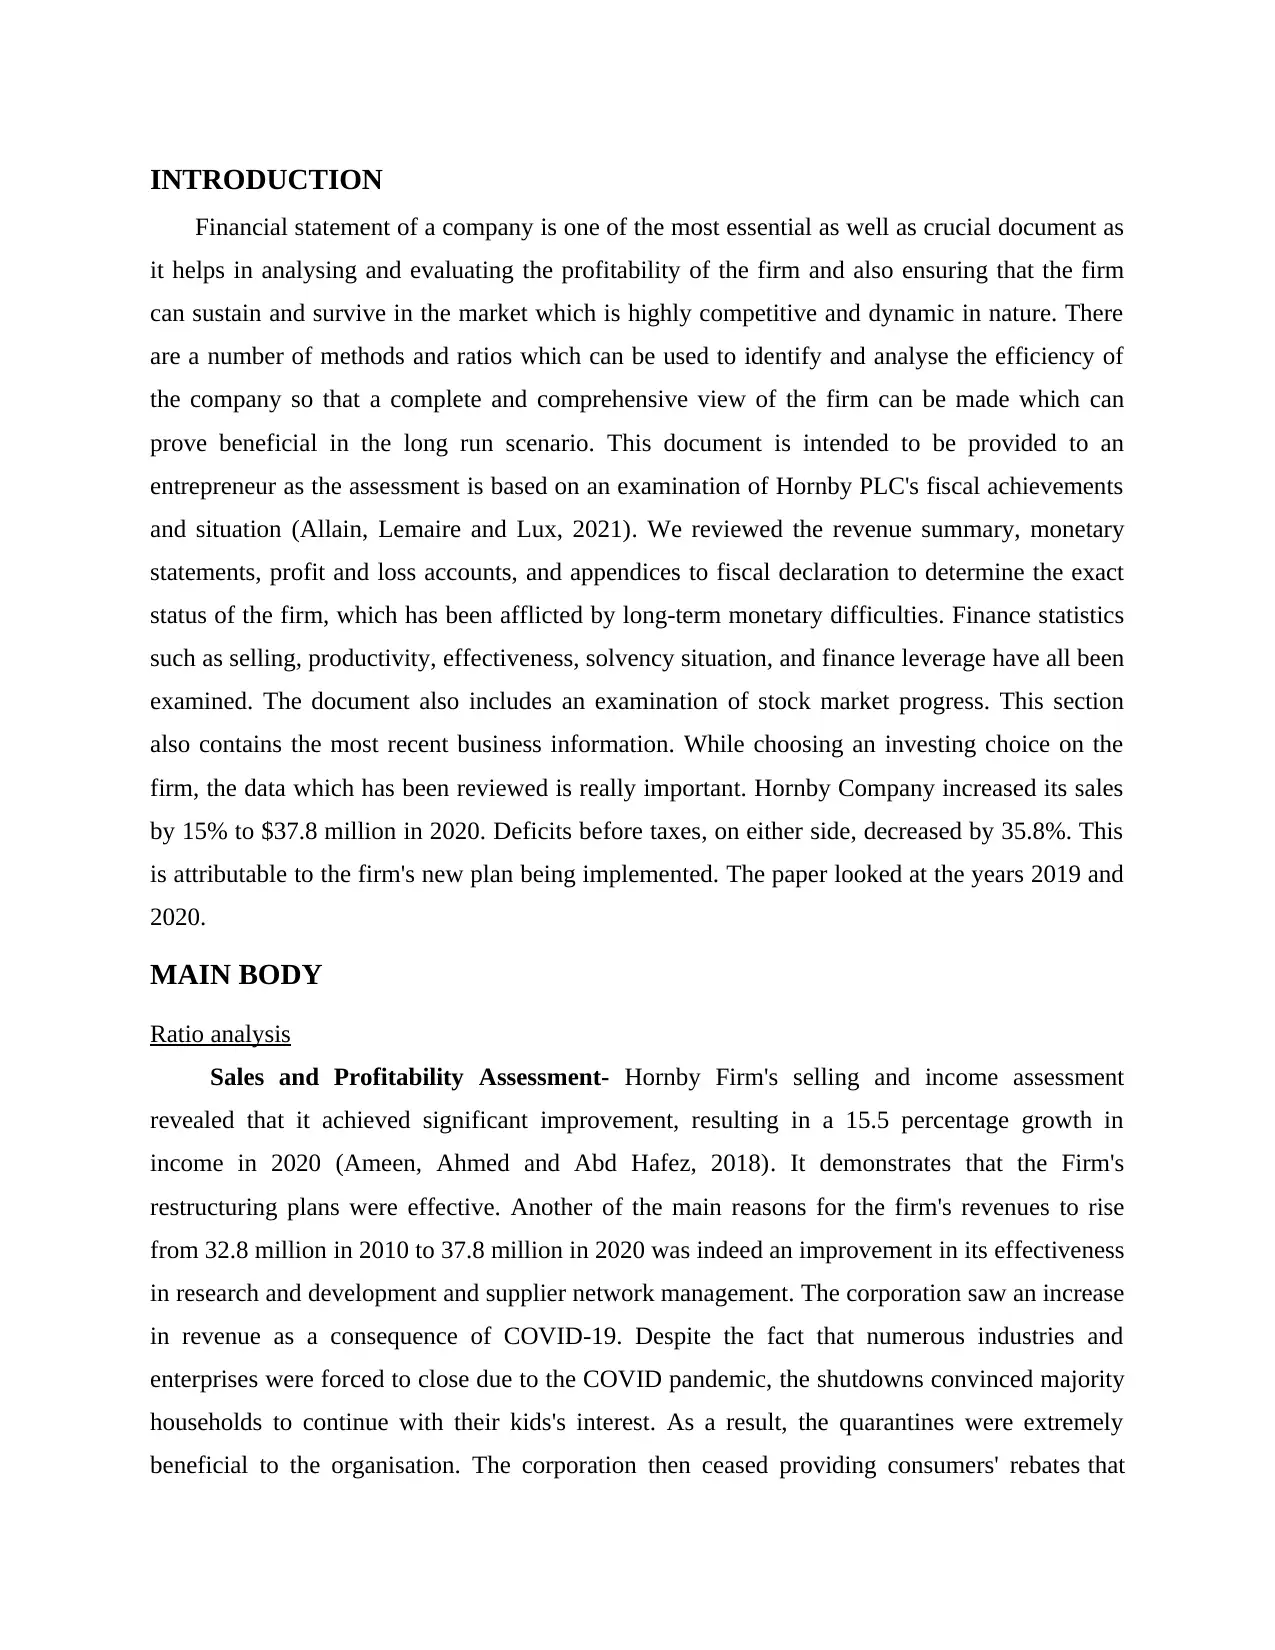
Sales and Profitability Assessment- Hornby Firm's selling and income assessment
revealed that it achieved significant improvement, resulting in a 15.5 percentage growth in
income in 2020 (Ameen, Ahmed and Abd Hafez, 2018). It demonstrates that the Firm's
restructuring plans were effective. Another of the main reasons for the firm's revenues to rise
from 32.8 million in 2010 to 37.8 million in 2020 was indeed an improvement in its effectiveness
in research and development and supplier network management. The corporation saw an increase
in revenue as a consequence of COVID-19. Despite the fact that numerous industries and
enterprises were forced to close due to the COVID pandemic, the shutdowns convinced majority
households to continue with their kids's interest. As a result, the quarantines were extremely
beneficial to the organisation. The corporation then ceased providing consumers' rebates that
Financial statement of a company is one of the most essential as well as crucial document as
it helps in analysing and evaluating the profitability of the firm and also ensuring that the firm
can sustain and survive in the market which is highly competitive and dynamic in nature. There
are a number of methods and ratios which can be used to identify and analyse the efficiency of
the company so that a complete and comprehensive view of the firm can be made which can
prove beneficial in the long run scenario. This document is intended to be provided to an
entrepreneur as the assessment is based on an examination of Hornby PLC's fiscal achievements
and situation (Allain, Lemaire and Lux, 2021). We reviewed the revenue summary, monetary
statements, profit and loss accounts, and appendices to fiscal declaration to determine the exact
status of the firm, which has been afflicted by long-term monetary difficulties. Finance statistics
such as selling, productivity, effectiveness, solvency situation, and finance leverage have all been
examined. The document also includes an examination of stock market progress. This section
also contains the most recent business information. While choosing an investing choice on the
firm, the data which has been reviewed is really important. Hornby Company increased its sales
by 15% to $37.8 million in 2020. Deficits before taxes, on either side, decreased by 35.8%. This
is attributable to the firm's new plan being implemented. The paper looked at the years 2019 and
2020.
MAIN BODY
Ratio analysis
Sales and Profitability Assessment- Hornby Firm's selling and income assessment
revealed that it achieved significant improvement, resulting in a 15.5 percentage growth in
income in 2020 (Ameen, Ahmed and Abd Hafez, 2018). It demonstrates that the Firm's
restructuring plans were effective. Another of the main reasons for the firm's revenues to rise
from 32.8 million in 2010 to 37.8 million in 2020 was indeed an improvement in its effectiveness
in research and development and supplier network management. The corporation saw an increase
in revenue as a consequence of COVID-19. Despite the fact that numerous industries and
enterprises were forced to close due to the COVID pandemic, the shutdowns convinced majority
households to continue with their kids's interest. As a result, the quarantines were extremely
beneficial to the organisation. The corporation then ceased providing consumers' rebates that
⊘ This is a preview!⊘
Do you want full access?
Subscribe today to unlock all pages.
Trusted by 1+ million students worldwide
38,000
37,000
36,000
35,000
34,000
33,000
32,000
31,000
30,000
55.5%
55.0%
54.5%
54.0%
53.5%
53.0%
52.5%
52.0%
51.5%
helped to boost selling even more. Hornby Group, on the other hand, lost ten million pounds in
the previous year (2016-17).
Operating Expenses- Operational Costs in 2020, running expenditure as a revenues ratio
can drop dramatically. By reducing client incentives, the business was able to lower overall
operational costs that in turn lower operational expenditures as a selling ratio (Ax and Greve,
2017).
Paraphrase This Document
Need a fresh take? Get an instant paraphrase of this document with our AI Paraphraser
50.5%
0.0%
-2.0%
-4.0%
-6.0%
-8.0%
-10.0%
-12.0%
-14.0%
-16.0%
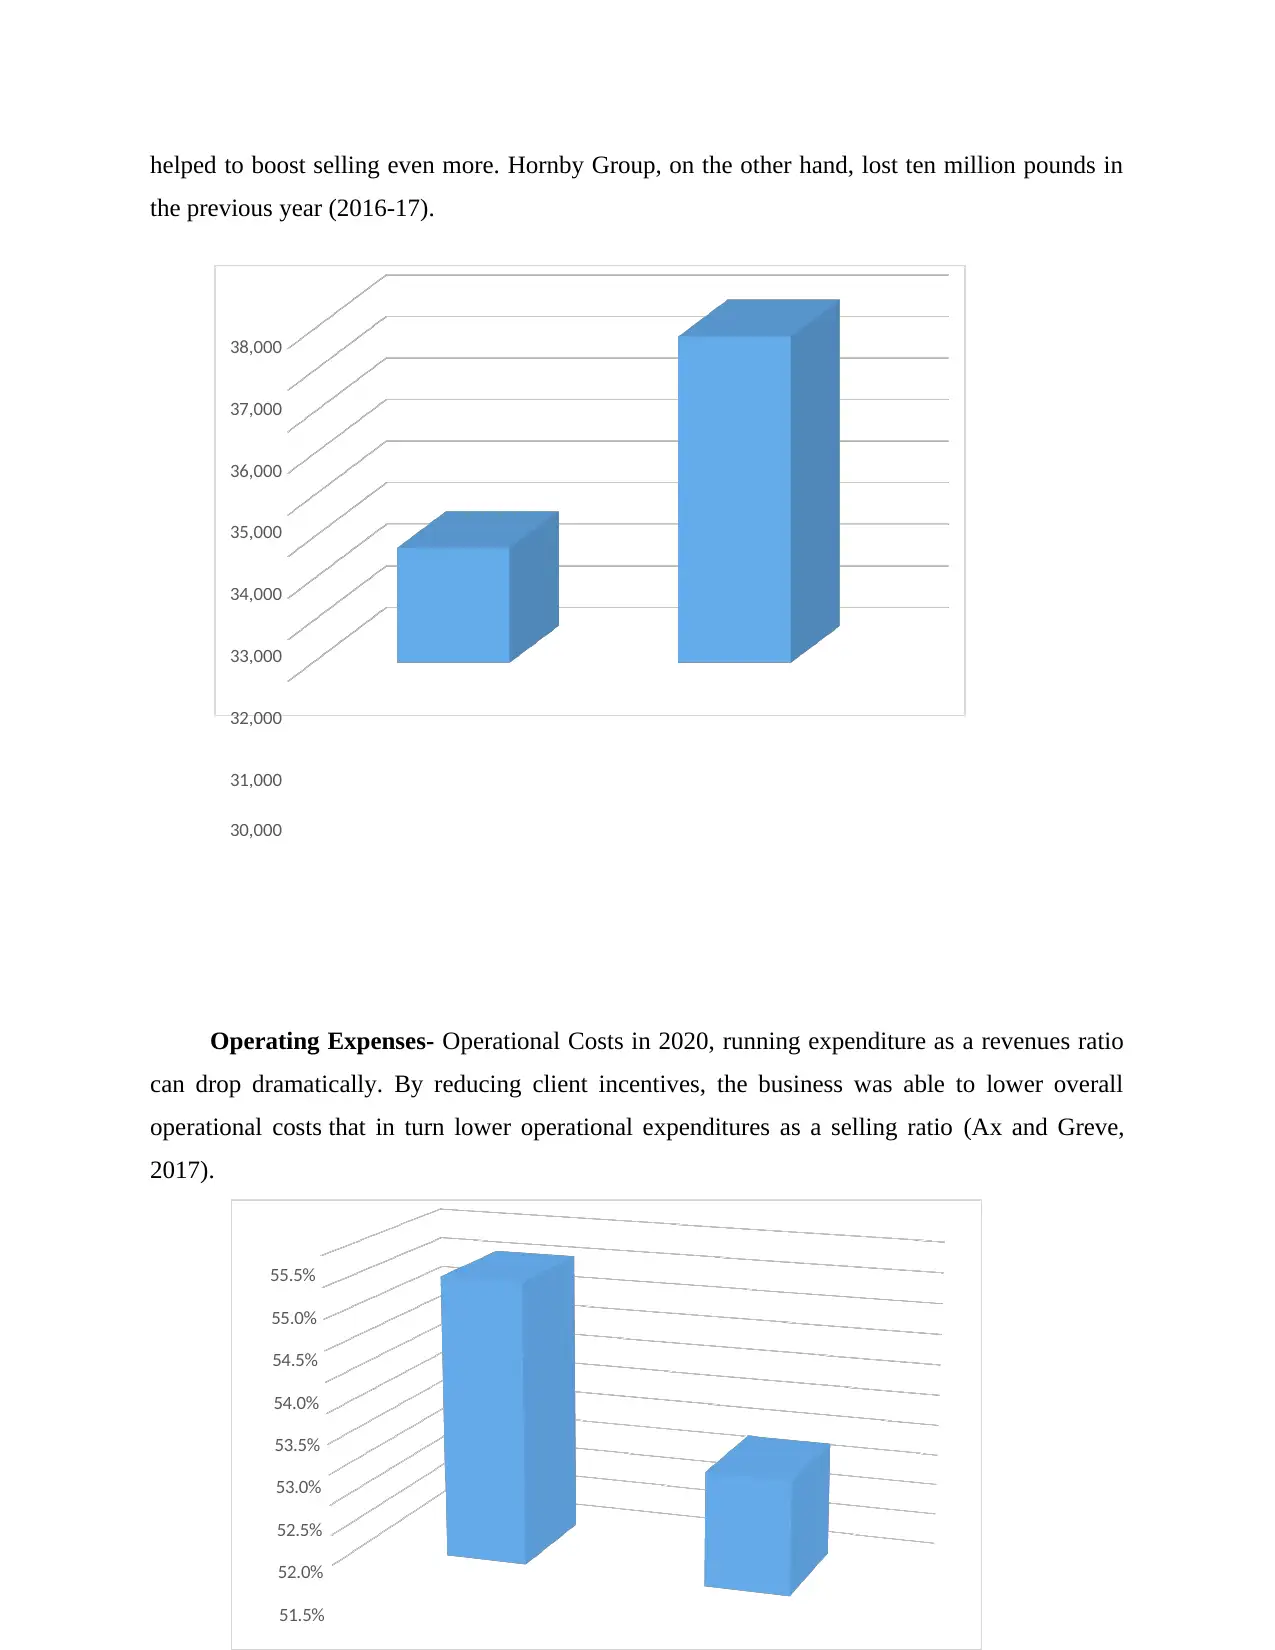
Net Profit ratio- Operational Revenue was adverse in 2010, it fell to -7.4 percent in 2020
from -15.9 percent in 2009. The rise is attributable to an improvement in earnings as well as the
firm's effectiveness in activities, as individuals began to return to their pursuits while at residence
attributed to closings. In addition, the Hornby Committee undertook various steps which resulted
in the cessation of significant undercutting, resulting in a steady employment force.
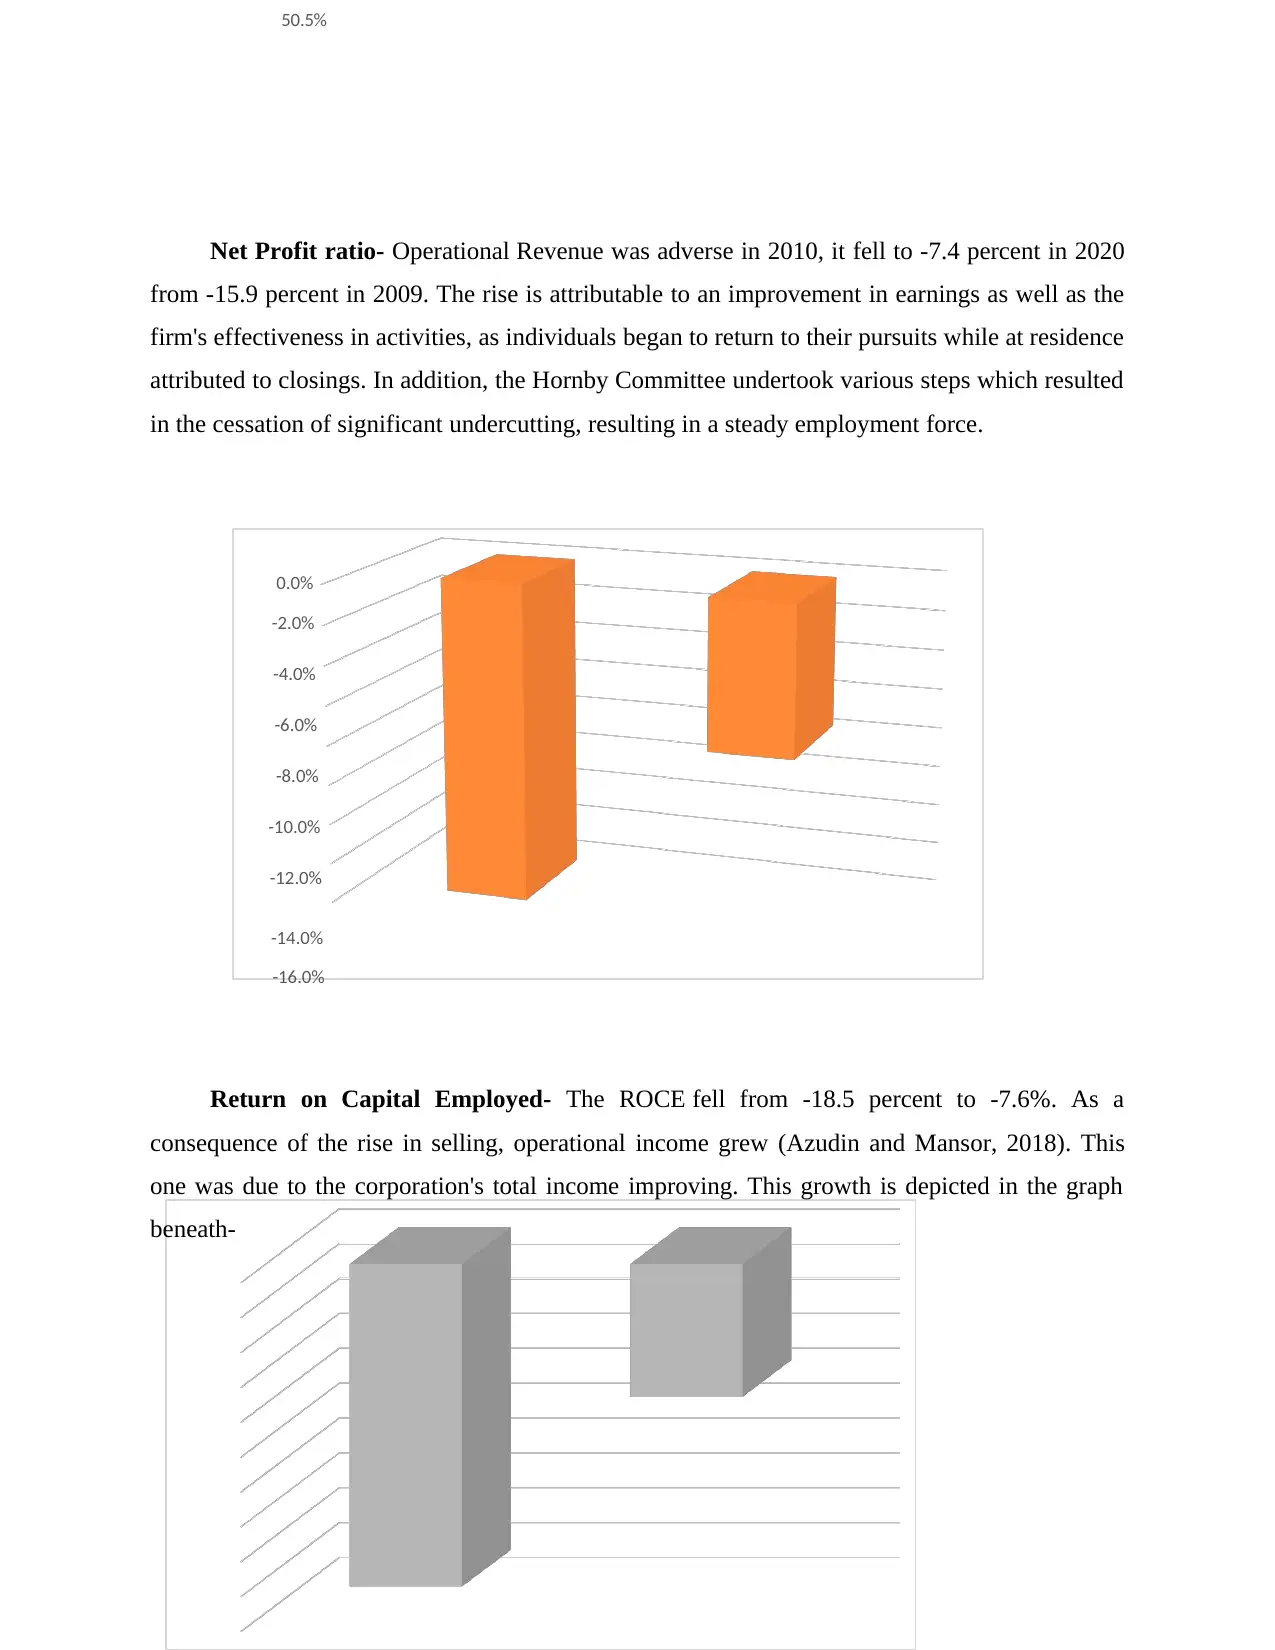
Return on Capital Employed- The ROCE fell from -18.5 percent to -7.6%. As a
consequence of the rise in selling, operational income grew (Azudin and Mansor, 2018). This
one was due to the corporation's total income improving. This growth is depicted in the graph
beneath-
0.0%
-2.0%
-4.0%
-6.0%
-8.0%
-10.0%
-12.0%
-14.0%
-16.0%
Net Profit ratio- Operational Revenue was adverse in 2010, it fell to -7.4 percent in 2020
from -15.9 percent in 2009. The rise is attributable to an improvement in earnings as well as the
firm's effectiveness in activities, as individuals began to return to their pursuits while at residence
attributed to closings. In addition, the Hornby Committee undertook various steps which resulted
in the cessation of significant undercutting, resulting in a steady employment force.
Return on Capital Employed- The ROCE fell from -18.5 percent to -7.6%. As a
consequence of the rise in selling, operational income grew (Azudin and Mansor, 2018). This
one was due to the corporation's total income improving. This growth is depicted in the graph
beneath-
0.0%
-2.0%
-4.0%
-6.0%
-8.0%
-10.0%
-12.0%
-14.0%
-16.0%
-18.0%
-20.0%
Evaluation of Cash Flow Trend, Liquidity Condition, and Efficiency
Cash Flow Assessment- Hornby Group's profitability stability was evaluated by
comparing operating revenues to cash flows from activity. Its cash flow involves revenue
produced from activities, interest components from repayments, and interests payable, according
to the cash flow statement. In 2020, the firm's cash from operational events decreased from -
2,921 to -3,856. The key factors which contributed to these outcomes were the firm's deficit,
higher inventory purchases, and a growth in accounts payable (Blay and Fennema, 2017).
The acquiring and sale of capital facilities, as well as other investment-related operations,
are included in the cash flows from investment undertakings. The usual financing operation
connected with it is such as the purchase and sale of real estate and liquid assets. According to
Hornby Group's cash flow summary, land, plants, and machinery rose by 15.7 percentage that
is from 2,144 in the year 2019 to 2,481 in the year 2020. In 2020, the gap amounted to Capital
increases costing $337. The firm's primary motivation for increasing equipment investment
would have been to secure the manufacturing of fresh and novel designs. The corporation
allocated a larger amount of Capital costs to manufacturing equipment. Despite this, the
purchasing of intangible property has decreased. The cash flow report revealed that the firm's
revenue expenditures from investment operations had increased (Lapsley and Rekers, 2017).
⊘ This is a preview!⊘
Do you want full access?
Subscribe today to unlock all pages.
Trusted by 1+ million students worldwide
-3,177; 37.93%
5,199; 62.07%
2019 2020
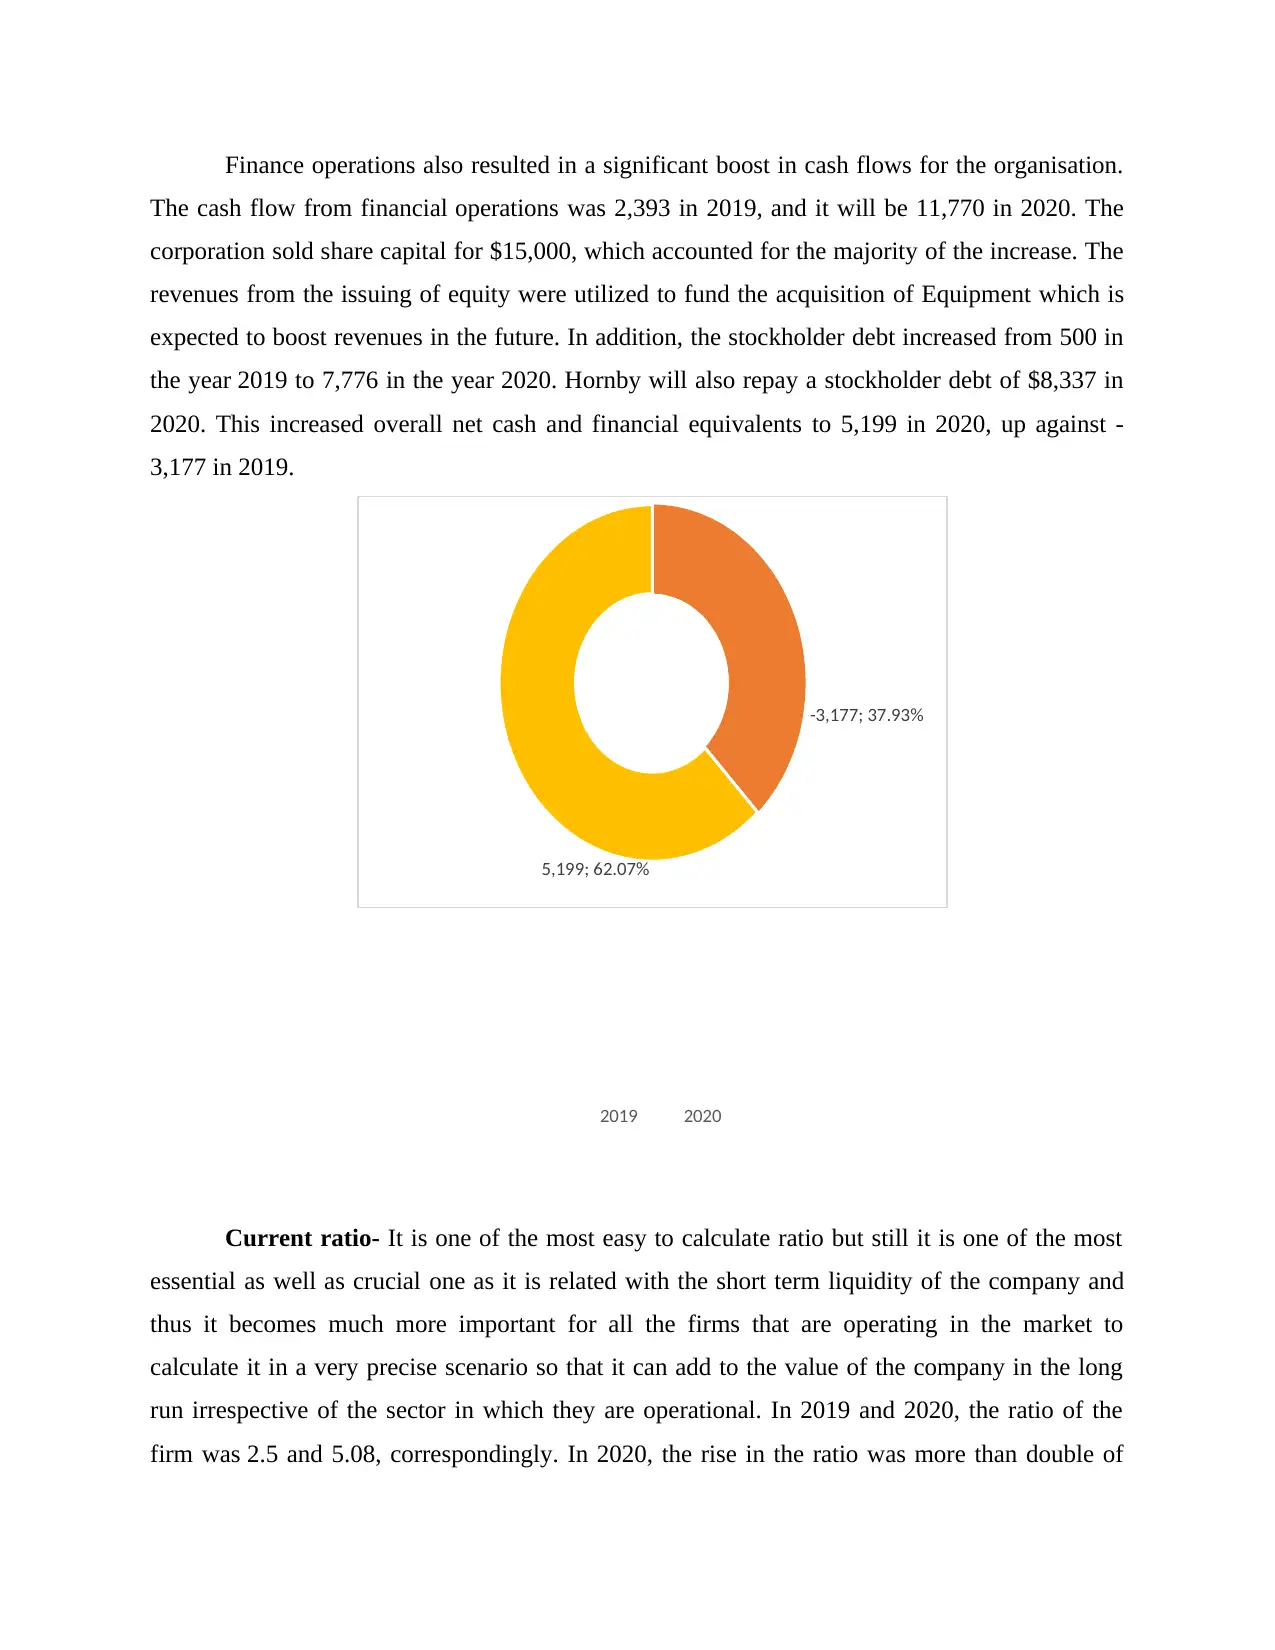
Finance operations also resulted in a significant boost in cash flows for the organisation.
The cash flow from financial operations was 2,393 in 2019, and it will be 11,770 in 2020. The
corporation sold share capital for $15,000, which accounted for the majority of the increase. The
revenues from the issuing of equity were utilized to fund the acquisition of Equipment which is
expected to boost revenues in the future. In addition, the stockholder debt increased from 500 in
the year 2019 to 7,776 in the year 2020. Hornby will also repay a stockholder debt of $8,337 in
2020. This increased overall net cash and financial equivalents to 5,199 in 2020, up against -
3,177 in 2019.
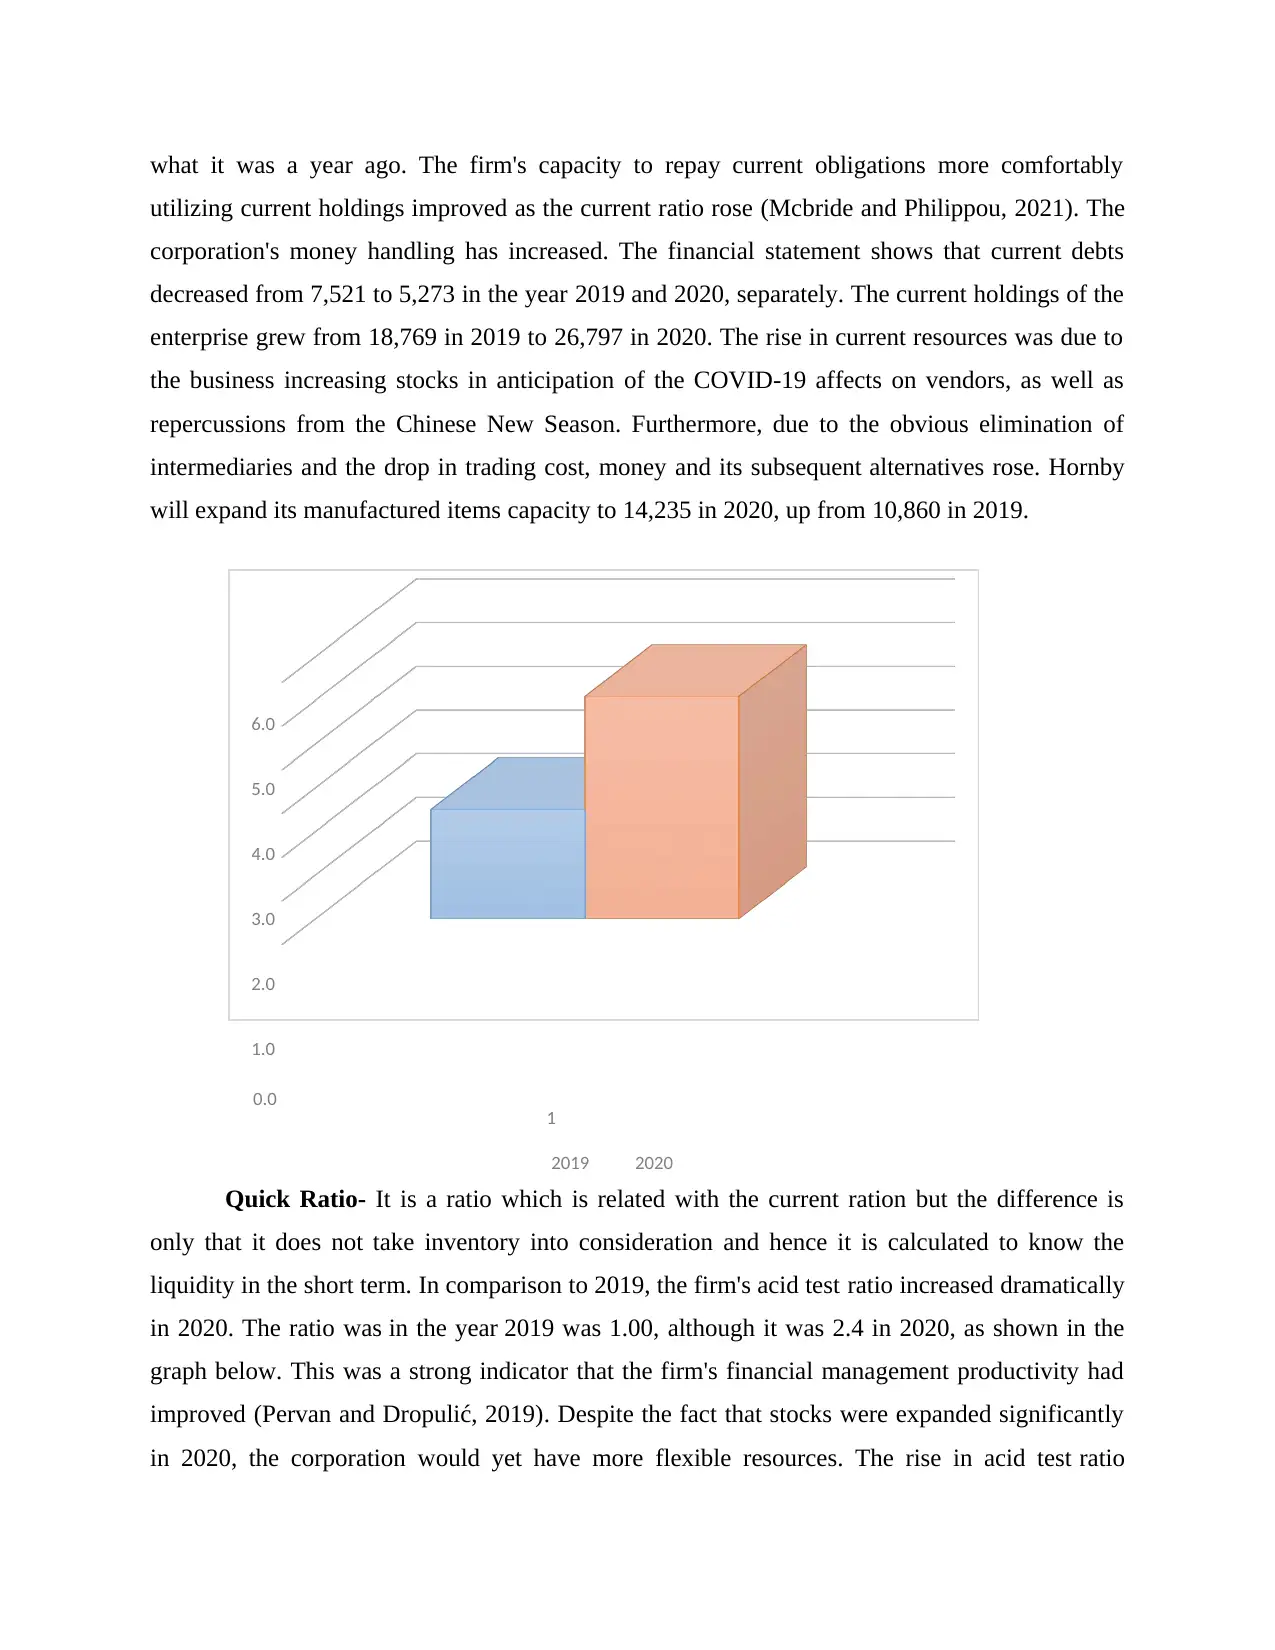
Current ratio- It is one of the most easy to calculate ratio but still it is one of the most
essential as well as crucial one as it is related with the short term liquidity of the company and
thus it becomes much more important for all the firms that are operating in the market to
calculate it in a very precise scenario so that it can add to the value of the company in the long
run irrespective of the sector in which they are operational. In 2019 and 2020, the ratio of the
firm was 2.5 and 5.08, correspondingly. In 2020, the rise in the ratio was more than double of
5,199; 62.07%
2019 2020
Finance operations also resulted in a significant boost in cash flows for the organisation.
The cash flow from financial operations was 2,393 in 2019, and it will be 11,770 in 2020. The
corporation sold share capital for $15,000, which accounted for the majority of the increase. The
revenues from the issuing of equity were utilized to fund the acquisition of Equipment which is
expected to boost revenues in the future. In addition, the stockholder debt increased from 500 in
the year 2019 to 7,776 in the year 2020. Hornby will also repay a stockholder debt of $8,337 in
2020. This increased overall net cash and financial equivalents to 5,199 in 2020, up against -
3,177 in 2019.
Current ratio- It is one of the most easy to calculate ratio but still it is one of the most
essential as well as crucial one as it is related with the short term liquidity of the company and
thus it becomes much more important for all the firms that are operating in the market to
calculate it in a very precise scenario so that it can add to the value of the company in the long
run irrespective of the sector in which they are operational. In 2019 and 2020, the ratio of the
firm was 2.5 and 5.08, correspondingly. In 2020, the rise in the ratio was more than double of
Paraphrase This Document
Need a fresh take? Get an instant paraphrase of this document with our AI Paraphraser
6.0
5.0
4.0
3.0
2.0
1.0
0.0
1
2019 2020
what it was a year ago. The firm's capacity to repay current obligations more comfortably
utilizing current holdings improved as the current ratio rose (Mcbride and Philippou, 2021). The
corporation's money handling has increased. The financial statement shows that current debts
decreased from 7,521 to 5,273 in the year 2019 and 2020, separately. The current holdings of the
enterprise grew from 18,769 in 2019 to 26,797 in 2020. The rise in current resources was due to
the business increasing stocks in anticipation of the COVID-19 affects on vendors, as well as
repercussions from the Chinese New Season. Furthermore, due to the obvious elimination of
intermediaries and the drop in trading cost, money and its subsequent alternatives rose. Hornby
will expand its manufactured items capacity to 14,235 in 2020, up from 10,860 in 2019.
Quick Ratio- It is a ratio which is related with the current ration but the difference is
only that it does not take inventory into consideration and hence it is calculated to know the
liquidity in the short term. In comparison to 2019, the firm's acid test ratio increased dramatically
in 2020. The ratio was in the year 2019 was 1.00, although it was 2.4 in 2020, as shown in the
graph below. This was a strong indicator that the firm's financial management productivity had
improved (Pervan and Dropulić, 2019). Despite the fact that stocks were expanded significantly
in 2020, the corporation would yet have more flexible resources. The rise in acid test ratio
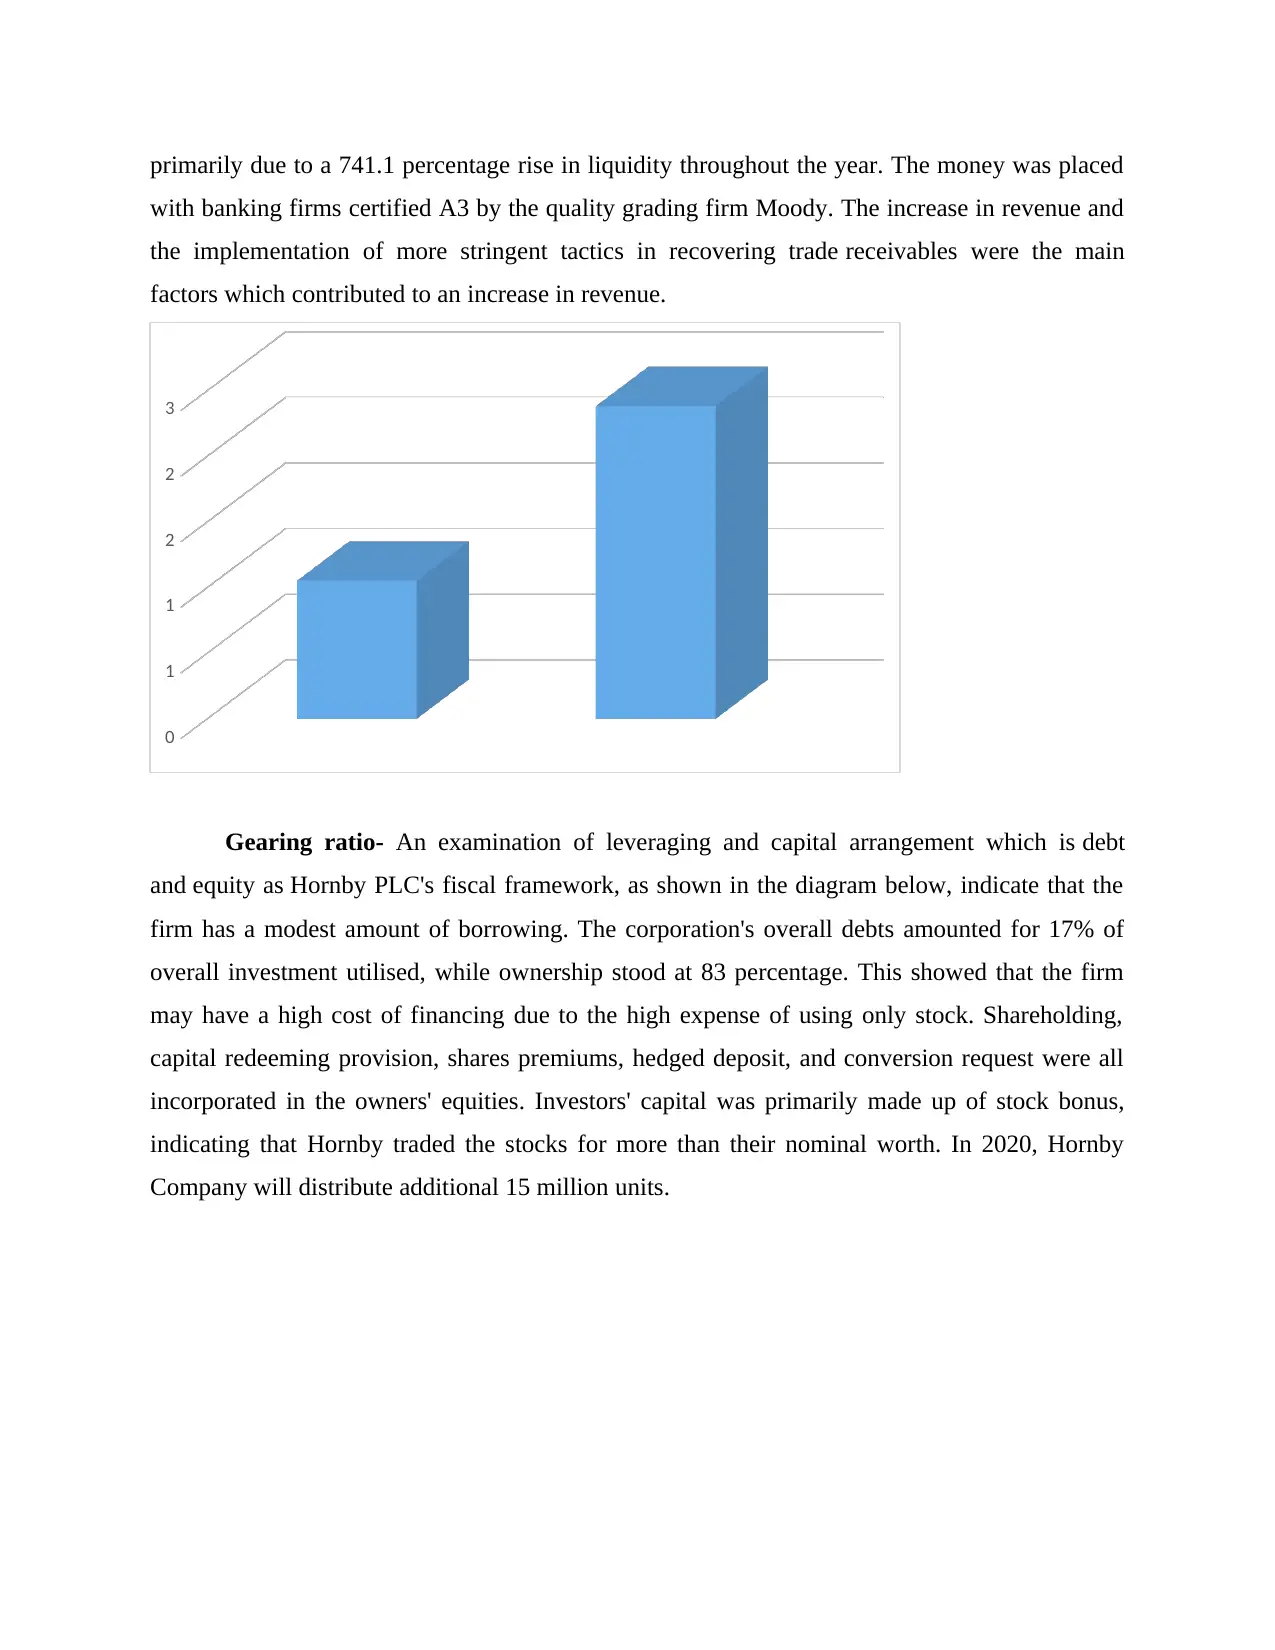
primarily due to a 741.1 percentage rise in liquidity throughout the year. The money was placed
with banking firms certified A3 by the quality grading firm Moody. The increase in revenue and
the implementation of more stringent tactics in recovering trade receivables were the main
factors which contributed to an increase in revenue.
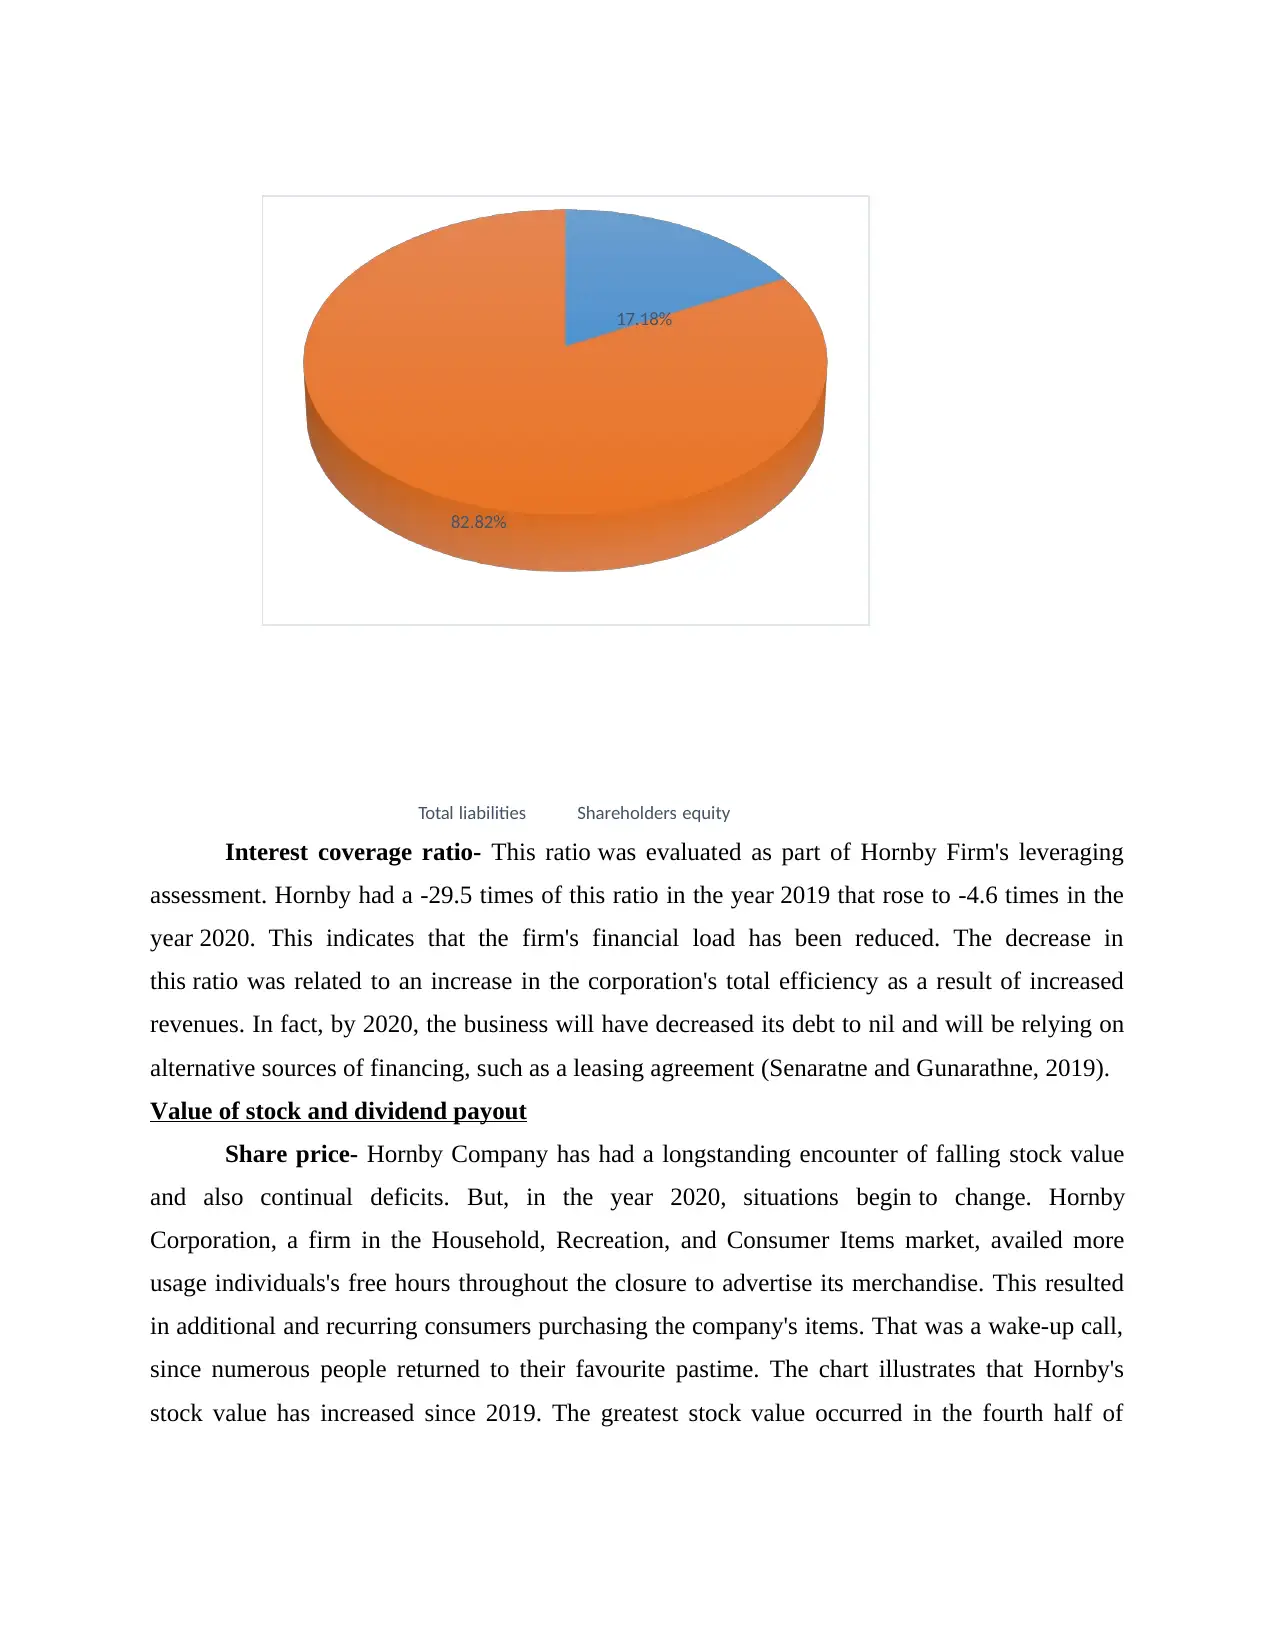
Gearing ratio- An examination of leveraging and capital arrangement which is debt
and equity as Hornby PLC's fiscal framework, as shown in the diagram below, indicate that the
firm has a modest amount of borrowing. The corporation's overall debts amounted for 17% of
overall investment utilised, while ownership stood at 83 percentage. This showed that the firm
may have a high cost of financing due to the high expense of using only stock. Shareholding,
capital redeeming provision, shares premiums, hedged deposit, and conversion request were all
incorporated in the owners' equities. Investors' capital was primarily made up of stock bonus,
indicating that Hornby traded the stocks for more than their nominal worth. In 2020, Hornby
Company will distribute additional 15 million units.
3
2
2
1
1
0
with banking firms certified A3 by the quality grading firm Moody. The increase in revenue and
the implementation of more stringent tactics in recovering trade receivables were the main
factors which contributed to an increase in revenue.
Gearing ratio- An examination of leveraging and capital arrangement which is debt
and equity as Hornby PLC's fiscal framework, as shown in the diagram below, indicate that the
firm has a modest amount of borrowing. The corporation's overall debts amounted for 17% of
overall investment utilised, while ownership stood at 83 percentage. This showed that the firm
may have a high cost of financing due to the high expense of using only stock. Shareholding,
capital redeeming provision, shares premiums, hedged deposit, and conversion request were all
incorporated in the owners' equities. Investors' capital was primarily made up of stock bonus,
indicating that Hornby traded the stocks for more than their nominal worth. In 2020, Hornby
Company will distribute additional 15 million units.
3
2
2
1
1
0
⊘ This is a preview!⊘
Do you want full access?
Subscribe today to unlock all pages.
Trusted by 1+ million students worldwide
17.18%
82.82%
Total liabilities Shareholders equity
Interest coverage ratio- This ratio was evaluated as part of Hornby Firm's leveraging
assessment. Hornby had a -29.5 times of this ratio in the year 2019 that rose to -4.6 times in the
year 2020. This indicates that the firm's financial load has been reduced. The decrease in
this ratio was related to an increase in the corporation's total efficiency as a result of increased
revenues. In fact, by 2020, the business will have decreased its debt to nil and will be relying on
alternative sources of financing, such as a leasing agreement (Senaratne and Gunarathne, 2019).
Value of stock and dividend payout
Share price- Hornby Company has had a longstanding encounter of falling stock value
and also continual deficits. But, in the year 2020, situations begin to change. Hornby
Corporation, a firm in the Household, Recreation, and Consumer Items market, availed more
usage individuals's free hours throughout the closure to advertise its merchandise. This resulted
in additional and recurring consumers purchasing the company's items. That was a wake-up call,
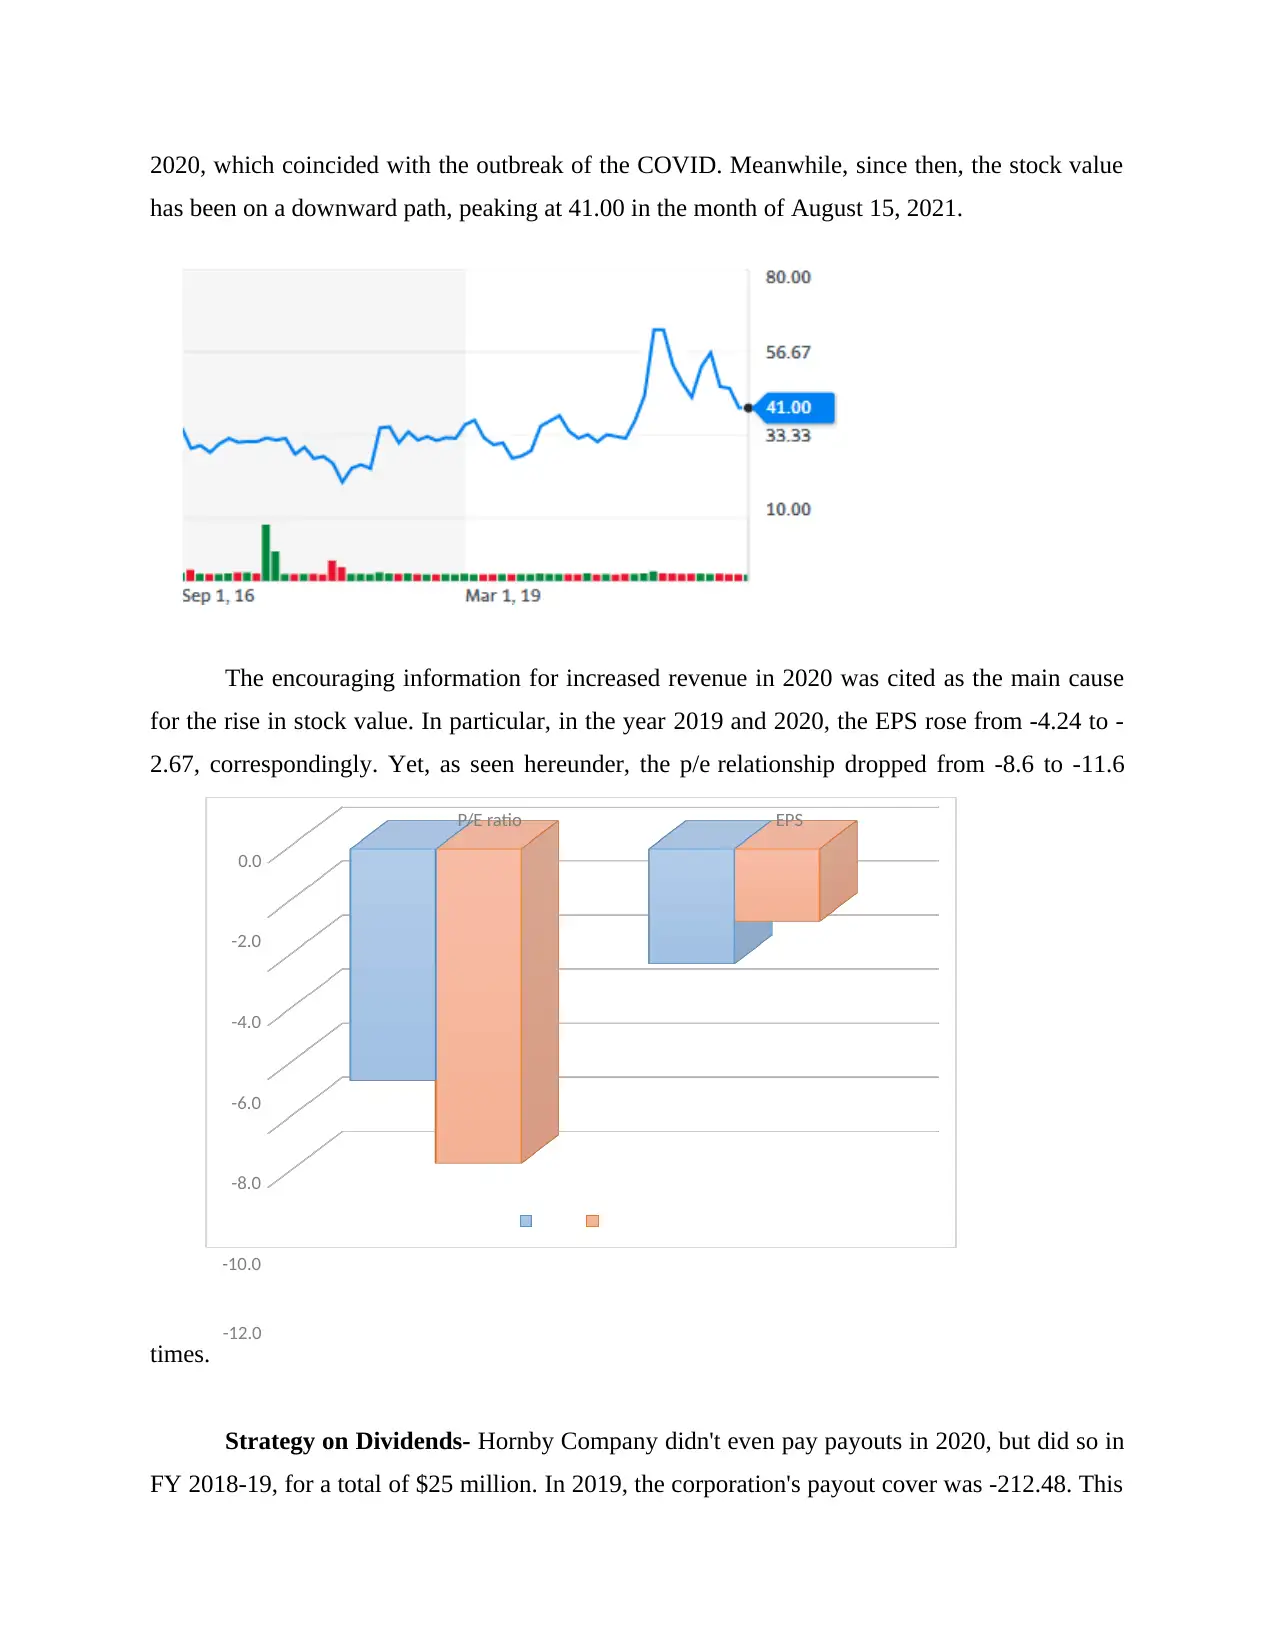
since numerous people returned to their favourite pastime. The chart illustrates that Hornby's
stock value has increased since 2019. The greatest stock value occurred in the fourth half of
82.82%
Total liabilities Shareholders equity
Interest coverage ratio- This ratio was evaluated as part of Hornby Firm's leveraging
assessment. Hornby had a -29.5 times of this ratio in the year 2019 that rose to -4.6 times in the
year 2020. This indicates that the firm's financial load has been reduced. The decrease in
this ratio was related to an increase in the corporation's total efficiency as a result of increased
revenues. In fact, by 2020, the business will have decreased its debt to nil and will be relying on
alternative sources of financing, such as a leasing agreement (Senaratne and Gunarathne, 2019).
Value of stock and dividend payout
Share price- Hornby Company has had a longstanding encounter of falling stock value
and also continual deficits. But, in the year 2020, situations begin to change. Hornby
Corporation, a firm in the Household, Recreation, and Consumer Items market, availed more
usage individuals's free hours throughout the closure to advertise its merchandise. This resulted
in additional and recurring consumers purchasing the company's items. That was a wake-up call,
since numerous people returned to their favourite pastime. The chart illustrates that Hornby's
stock value has increased since 2019. The greatest stock value occurred in the fourth half of
Paraphrase This Document
Need a fresh take? Get an instant paraphrase of this document with our AI Paraphraser
P/E ratio EPS
0.0
-2.0
-4.0
-6.0
-8.0
-10.0
-12.0
2020, which coincided with the outbreak of the COVID. Meanwhile, since then, the stock value
has been on a downward path, peaking at 41.00 in the month of August 15, 2021.
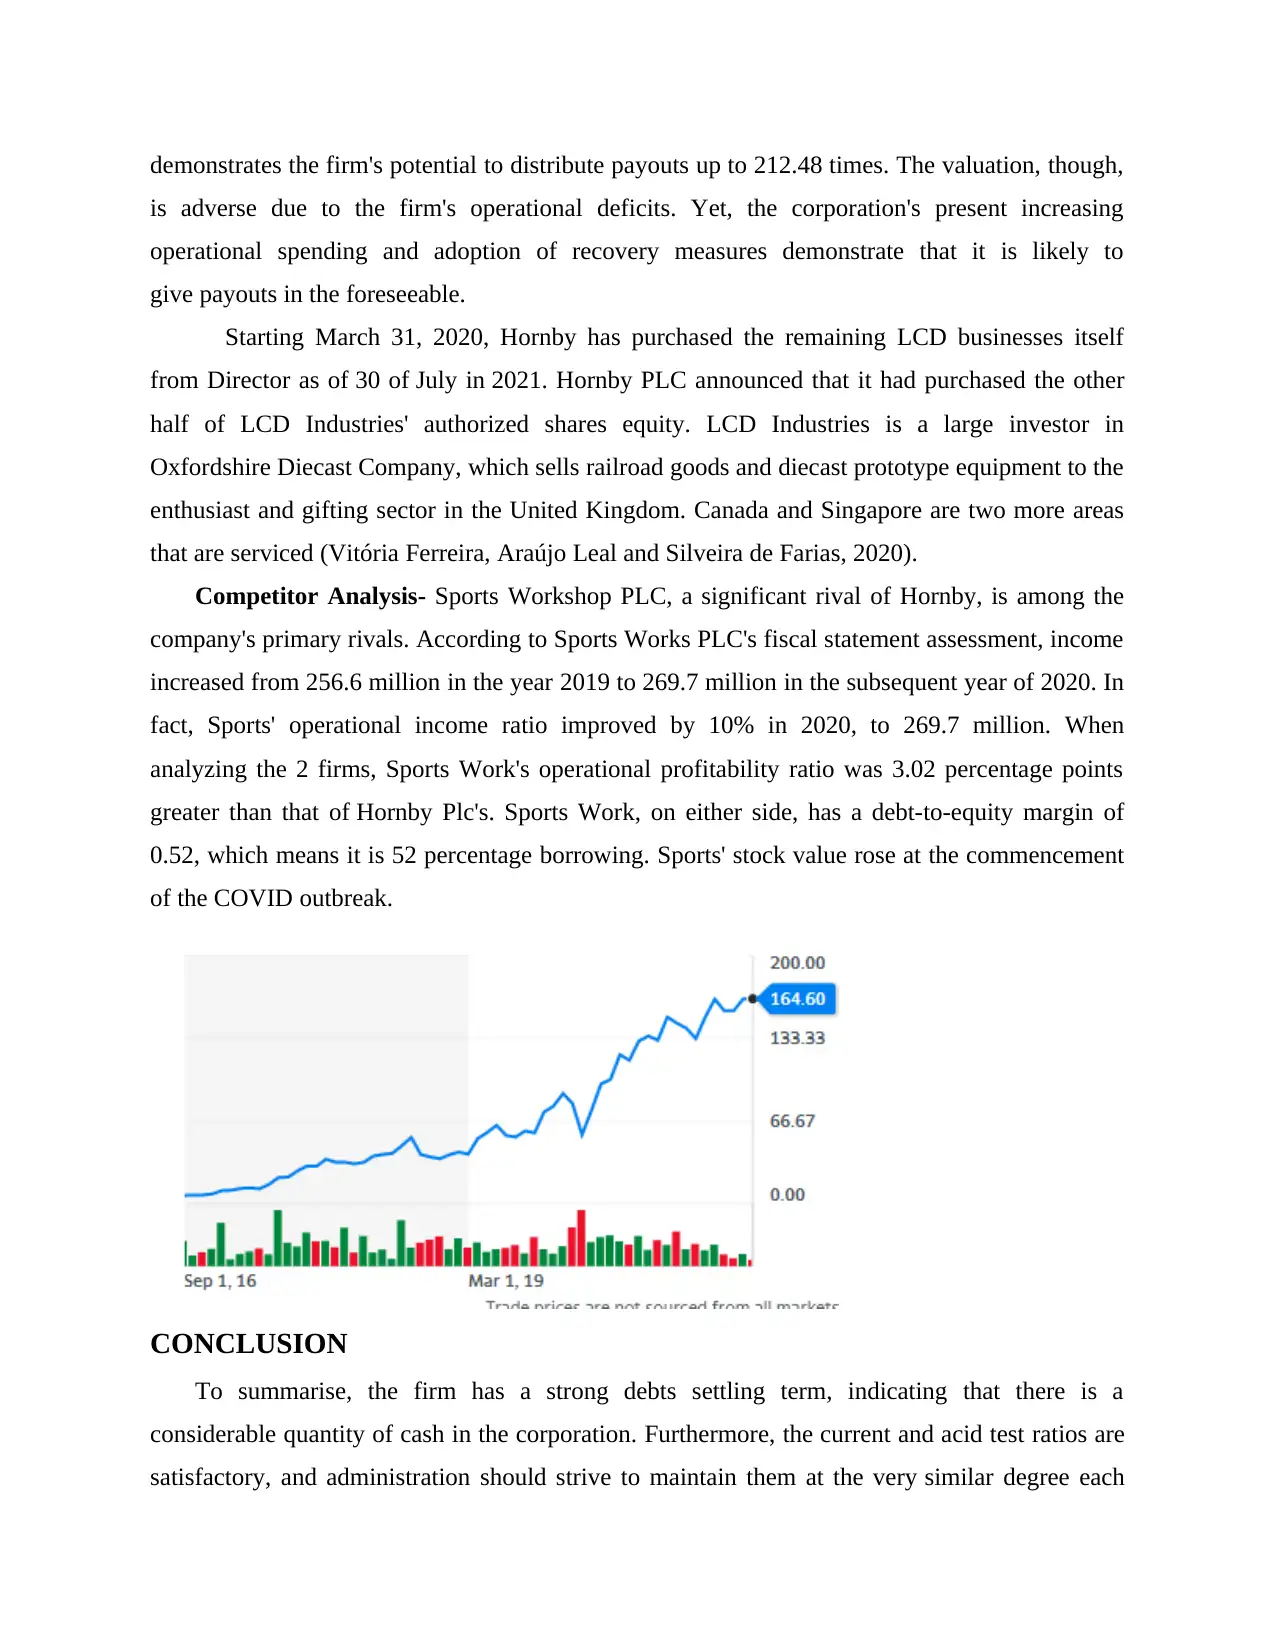
The encouraging information for increased revenue in 2020 was cited as the main cause
for the rise in stock value. In particular, in the year 2019 and 2020, the EPS rose from -4.24 to -
2.67, correspondingly. Yet, as seen hereunder, the p/e relationship dropped from -8.6 to -11.6
times.
Strategy on Dividends- Hornby Company didn't even pay payouts in 2020, but did so in
FY 2018-19, for a total of $25 million. In 2019, the corporation's payout cover was -212.48. This
0.0
-2.0
-4.0
-6.0
-8.0
-10.0
-12.0
2020, which coincided with the outbreak of the COVID. Meanwhile, since then, the stock value
has been on a downward path, peaking at 41.00 in the month of August 15, 2021.
The encouraging information for increased revenue in 2020 was cited as the main cause
for the rise in stock value. In particular, in the year 2019 and 2020, the EPS rose from -4.24 to -
2.67, correspondingly. Yet, as seen hereunder, the p/e relationship dropped from -8.6 to -11.6
times.
Strategy on Dividends- Hornby Company didn't even pay payouts in 2020, but did so in
FY 2018-19, for a total of $25 million. In 2019, the corporation's payout cover was -212.48. This
demonstrates the firm's potential to distribute payouts up to 212.48 times. The valuation, though,
is adverse due to the firm's operational deficits. Yet, the corporation's present increasing
operational spending and adoption of recovery measures demonstrate that it is likely to
give payouts in the foreseeable.
Starting March 31, 2020, Hornby has purchased the remaining LCD businesses itself
from Director as of 30 of July in 2021. Hornby PLC announced that it had purchased the other
half of LCD Industries' authorized shares equity. LCD Industries is a large investor in
Oxfordshire Diecast Company, which sells railroad goods and diecast prototype equipment to the
enthusiast and gifting sector in the United Kingdom. Canada and Singapore are two more areas
that are serviced (Vitória Ferreira, Araújo Leal and Silveira de Farias, 2020).
Competitor Analysis- Sports Workshop PLC, a significant rival of Hornby, is among the
company's primary rivals. According to Sports Works PLC's fiscal statement assessment, income
increased from 256.6 million in the year 2019 to 269.7 million in the subsequent year of 2020. In
fact, Sports' operational income ratio improved by 10% in 2020, to 269.7 million. When
analyzing the 2 firms, Sports Work's operational profitability ratio was 3.02 percentage points
greater than that of Hornby Plc's. Sports Work, on either side, has a debt-to-equity margin of
0.52, which means it is 52 percentage borrowing. Sports' stock value rose at the commencement
of the COVID outbreak.
CONCLUSION
To summarise, the firm has a strong debts settling term, indicating that there is a
considerable quantity of cash in the corporation. Furthermore, the current and acid test ratios are
satisfactory, and administration should strive to maintain them at the very similar degree each
⊘ This is a preview!⊘
Do you want full access?
Subscribe today to unlock all pages.
Trusted by 1+ million students worldwide
1 out of 15
Related Documents


Your All-in-One AI-Powered Toolkit for Academic Success.
+13062052269
info@desklib.com
Available 24*7 on WhatsApp / Email
![[object Object]](/_next/static/media/star-bottom.7253800d.svg)
Unlock your academic potential
Copyright © 2020–2026 A2Z Services. All Rights Reserved. Developed and managed by ZUCOL.