Finance in Hospitality Report
VerifiedAdded on 2019/12/03
|26
|7579
|138
Report
AI Summary
This report delves into the financial aspects of the hospitality industry, specifically focusing on a large restaurant chain. It examines various sources of funding, including debt, equity, and venture capital, weighing their advantages and disadvantages. The report then analyzes cost elements, gross profit percentage, and selling price, exploring methods for controlling stock and cash. Budgetary control processes are detailed, along with variance analysis between budgeted and actual performance, offering recommendations for improvement. The report also includes an analysis of financial statements, ratio analysis (gross profit, net profit, current, liquid, debtor, and creditor collection periods), and recommendations for enhancing business performance. Finally, it discusses fixed, variable, and semi-variable costs, and uses break-even calculations to inform short-term management decisions. The website provides this solved assignment and other past papers to help students.
FINANCE IN HOSPITALITY
Paraphrase This Document
Need a fresh take? Get an instant paraphrase of this document with our AI Paraphraser
TABLE OF CONTENTS
INTRODUCTION....................................................................................................................... 1
TASK 1....................................................................................................................................... 1
1.1 Sources of funding available to business............................................................................ 1
1.2 Contribution made by various methods of generating income for a large chain of
restaurants............................................................................................................................... 2
TASK 2....................................................................................................................................... 2
2.1 Elements of cost, gross profit percentage and selling price ...............................................2
2.2 Evaluating methods of controlling stock and cash.............................................................3
TASK 3....................................................................................................................................... 4
3.3 Process and purpose of budgetary control .........................................................................4
3.4 Analyzing variance of budgeted performance from actual performance and
recommendations.................................................................................................................... 4
TASK 4 ...................................................................................................................................... 5
3.1 Source and structure of trial balance..................................................................................5
3.2 Adjustments in financial statements................................................................................... 6
4.1 & 4.2 Ratio analysis and recommendations.......................................................................8
TASK 5....................................................................................................................................... 9
5.1 Brief notes on fixed, variable and semi-variable costs......................................................9
5.3 Short term management decision based on break even calculation...................................12
CONCLUSION.......................................................................................................................... 12
REFERENCES ....................................................................................................................... 13
1
INTRODUCTION
Finance plays a vital role in the growth of any organization. Along with this, companies
are also required to control their costs. This requires application of various techniques. In this
report, some of the techniques regarding cost evaluation are presented and probable reason for
variance in performance is also explained in detail. Further, ratio analysis is also done in order to
evaluate the business. After that, recommendations are made regarding improvement in business
performance. Along with these, adjustments are also made in P&L account and balance sheet of
the firm. Further, ways in which adjustments are made is also discussed in this report.
TASK 1
1.1
Finance plays a vital role in the growth of an organization. In today’s uncertain business
environment, it is difficult to raise entire amount from a single source of finance. Hence,
business firms collect a specific corpus from various sources of finance in the specific
proportion. Some sources though which Aquapet can raise funds are given below:
External sources
1 Debt/ long term loan – Aquapet can raise loan from banks or NBFC'S at fixed or floating
interest rates.
Advantage- The main advantage of debt is that in this source of finance ownership of owners of
the company does not get diluted. Hence, they are able to maintain full control on firm.
Disadvantages- It depends on the management of Aquapet only that at which interest rate, they
take loan. In past years, it has been seen that firms who raise loan at floating interest rate face a
lot of problems due to frequent change in the interest rates structure by the central bank and
fluctuation in currency in an international market (Mayer, Schoors and Yafeh, 2005). With
increase in interest rate and weakness in domestic currency debt payment liability on firms get
increased. Hence, it is recommended that firms must abstain from taking loan at floating interest
rate.
1 Venture capital- This is an alternative source of finance of equity. Under this system,
there is a firm that provides capital to its client firm and in return, it gets ownership in
2
⊘ This is a preview!⊘
Do you want full access?
Subscribe today to unlock all pages.
Trusted by 1+ million students worldwide
company’s stock. Hence, company does not need to resort to banks for financing their
operations. The other benefit that this source of finance gives is that it also gets legal entitle to
give guidance to the firm regarding business policy and strategy. The main disadvantage of
venture capital is that ownership of existing shareholders gets diluted in the firm. Hence,
decision making power of directors gets reduced. Thus, it is an inverse of debt as a source of
finance and due to this reason; it is quite popular in USA and Europe.
2 Equity- When firms wants to start any project they can approach primary market for
raising capital through IPO or FPO. The main advantage of this source of finance is that like
debt it is not necessary to pay dividend each and every year. But issue of shares dilutes control
of existing shareholders on the company. Hence, this source of finance has both positive and
negative points.
3 Private equity- If firm is not eligible to raise capital from stock market then it can
approach private equity firms for financing their business projects (Galia and Legros, 2004). The
main benefit of this source of finance is that at infant stage firm get a large amount of capital
that it cannot get from banks or NBFC'S. But in this source of finance company have to sell its
stack to private equity firms. Hence, control of existing shareholders on the company gets
reduced which is major disadvantage of this source of finance.
4 Short term loan- This loan is available from banks and NBFC'S for short duration say
one year. The main benefit of this source of finance is that firm can fulfill its working capital
requirements from this source of finance. The main disadvantage is that if loan is taken at
floating rate then finance burden on the company get increased.
5 Debentures- It is a written acknowledgment of debt taken by the company from the
public. In return firm pay interest to the debenture holders. In this source of finance it is
necessary to pay interest in specific time period . If financial condition is not good then payment
of interest may create problem for an organization. This is major limitation of this source of
finance. But control of existing shareholders does not get diluted in case of debentures. So, it has
both positive and negative points.
6 Consortium finance- Consortium finance is taken when single bank cannot finance
entire project and multiple banks are required to finance specific project which will be executed
in the domestic land. Like debenture in case of this source of finance it is necessary to pay
interest on time and this is major limitation of this source of finance. But in this case
3
Paraphrase This Document
Need a fresh take? Get an instant paraphrase of this document with our AI Paraphraser
shareholders control on the company does not get diluted. Hence, this is major advantage of this
source of finance.
Internal sources
Retained earnings- It is a portion of profit that remains after payment of expenses and
debt from company’s revenue (Irwin and Scott, 2011). This is the commonly used source of
finance among all categories of organizations whether they are sole trader, partnership or
company because organization is not liable to pay any sort of finance cost to any institute. This
source of finance does not have any limitation.
Equity, debt and consortium finance are three sources of finance that can be used in order
to finance entire finance requirements. In case of equity 60% stack remains with the company
owners and liability to pay fixed amount periodically also not created. But company power to
take decision get reduced. In case company failed to raise capital from equity then it can issue
capital from debt. But due to poor economic conditions banks are following a cautious approach
and they may deny from financing a project. Hence, consortium finance is suggested to the
mentioned firm in which multiple banks will collectively finance firm. This is selected because
in this source of finance owners will have full control of company and due to sharing of risk
banks will also prepared to finance company project easily.
1.2
There are many things that play an important role in generating revenue for the firm.
Some of them are given below:
1 Sales- Sales is an item in a company’s P&L account that represents money that a firm
earned from sales. For generating sales, large chain of restaurants need to put various sorts of
efforts. This is because; there are numerous hotels in London or in entire UK due to high
inbound tourism in the mentioned nation. As a result, there is a stiff competition among firms in
the relevant industry (Eriksson, Katila and Niskanen, 2009). Therefore, Aquapet requires
formulating and implementing some unique strategies in order to flourish its business in the
relevant industry.
2 Home delivery service- In today’s time period, people is busy and they find it difficult to
cook their food on time. As a result, home delivery service is increasing rapidly in London.
4
Thus, Aquapet by entering in this segment of business can grow at a fast rate in hospitality
industry.
3 Renting place for an occasion- Aquapet can rent a place for specific occasions like
conference on business or social issues and marriage etc. By focusing on this segment, firm can
elevate its revenue (Atkinson, 2005). Normally, hotels charge a very high amount for such kind
of services and due to this reason, their profitability gets increased. Hence, Aquapet must pay
close attention on this segment of business.
Advantages
Only benefit that a restaurant can get from sale of unused asset is that it will not need to
go to bank for financing its operations. By selling assets firm operations will be financed
and it will not need to pay any sort of finance cost. So both have advantages and
disadvantage for Aquapet and it needs to follow cautious approach for making prudent
decision.
Adoption of this method will lead to saving in terms of finance cost. Hence, economies
of scale will be generated and that saved amount will be used for other productive
activity.
Disadvantages
Company may sell its assets to finance its operation due to lack of cash and poor
performance of restaurant. But if restaurant changed its policy and it starts earning profit
then in future it may face problems due to scarcity of resources. Hence, firm will again
need to purchase asset in order to met customer demand. This, this strategy is not good
for the firm.
In future price of these assets may increase and become costly to buy. Hence, sale of
asset may prove disadvantageous for the firm in long term.
In upcoming time period asset of price may increase at higher rate. Means that if these
asset are sold in future then good profit can be earned in comparison to profit that a firm
will earn if assets ares old on current date. Hence, decision to sell asset on current date
may prove disadvantageous for the firm.
5
⊘ This is a preview!⊘
Do you want full access?
Subscribe today to unlock all pages.
Trusted by 1+ million students worldwide
TASK 2
2.1
Cost- It refers to the expenses that we incurred to produce goods and services. For
Aquapet, it includes carrier bags, food waste and staffing costs. On the other hand, indirect costs
include stationery, telephone expenses, security and electricity expenses. These costs are
combined to compute the cost of service for Aquapet. As mentioned in the case study, control of
stock and cash is an important factor for a business. Thus, management of Aquapet is required to
use its cash in an efficient and effective manner. On the other hand, it must also keep stiff
control on stock quantity in order to prevent the blockage of money in stock. It is clear that
enhancement in cost cannot be passed directly to the customers (Andreff, 2007). Hence, firm is
required to make its management very effective in order to reduce its service cost.
There are three elements of cost like material, labor and expenses. These costs are further
divided in to direct and indirect costs. Direct material, labor and expenses are those costs that are
directly related to production of goods and services.
Indirect cost- Indirect cost are those cost that are not related to production process. Employees
that are working in sales and administrative departments and expense regarding same are
example of indirect cost.
Indirect labor cost- It refers to those employees that are not involved in production
process. Cost incurred in respect to this employees is known as direct material cost.
Indirect material cost- It refers to material that are not used in production process. Cost
incurred in packaging is indirect material cost because it is not incurred during production
process.
Indirect expenses- These are those expenses that are not incurred in production process.
Cost of carriage is best example of indirect expenses.
Direct cost- Direct cost are those cost that are directly related to the production of goods and
services. Material used for production and employees working in plant as well as expenses
regarding same are example of direct cost. These costs are then considered to compute final
value of the product.
Direct labor- These are those employees that are directly involved in the production process.
With change in production level direct labor cost may also change.
6
Paraphrase This Document
Need a fresh take? Get an instant paraphrase of this document with our AI Paraphraser
Direct material- It refers to material that is used in the production process. Cost incurred
to purchase direct material is treated as direct material cost. Like direct labor with change in
production direct material cost also get changed.
Direct expenses- Other expenses that are incurred in production process is known as
direct expenses. These may be electricity expenses.
Cost is also divided into fixed and variable cost and both affects cost of production of the
company.
Fixed cost- These are those costs that can not be change with change in production of goods and
services. Investment in plant and machinery is best example of fixed cost.
Variable cost- It is a cost that gt changed with change in level of production of goods and
services. Employee cost and raw material purchase amount are the best examples of variable
cost.
Effects of these costs and way to control
If production of the company declines and sale price remain constant then cost of production get
increased in cost of production and profitability of the firm get declined. Fixed cost cannot be
reduced but its elevation can be controlled. Best example of fixed cost is investment in building.
Its cost cannot be reduced but traction in this cost can be prevented. On other hand variable cost
can be reduced or controlled by adopting cost control techniques. Employee cost is variable cost
and it can be reduced by the company at any time by following employee lay off approach.
Gross profit- Gross profit percentage is calculated by dividing gross profit by net sales
multiplied by hundred. Hence, gross profit and net sales are two main components which are
used while calculating the gross profit percentage. This percentage when compared with the
previous quarter percentage indicates that whether firm successfully controls its cost or not. But
this is only possible to find out only when sales price remains static.
Gross profit percentage= gross profit/ net sales*100
= (19200-16000)/19200*100= 16.66%
Selling price- Sales price is calculated by using the cost of production plus margin on
sales. Thus, cost of goods sold and margin percentage are two components of computing sales
price. Firms by looking at surrounding business conditions determine margin percentage for
sales (Brealey, 2012). With decline in sales margin, percentage also gets changed. Hence, firms
7
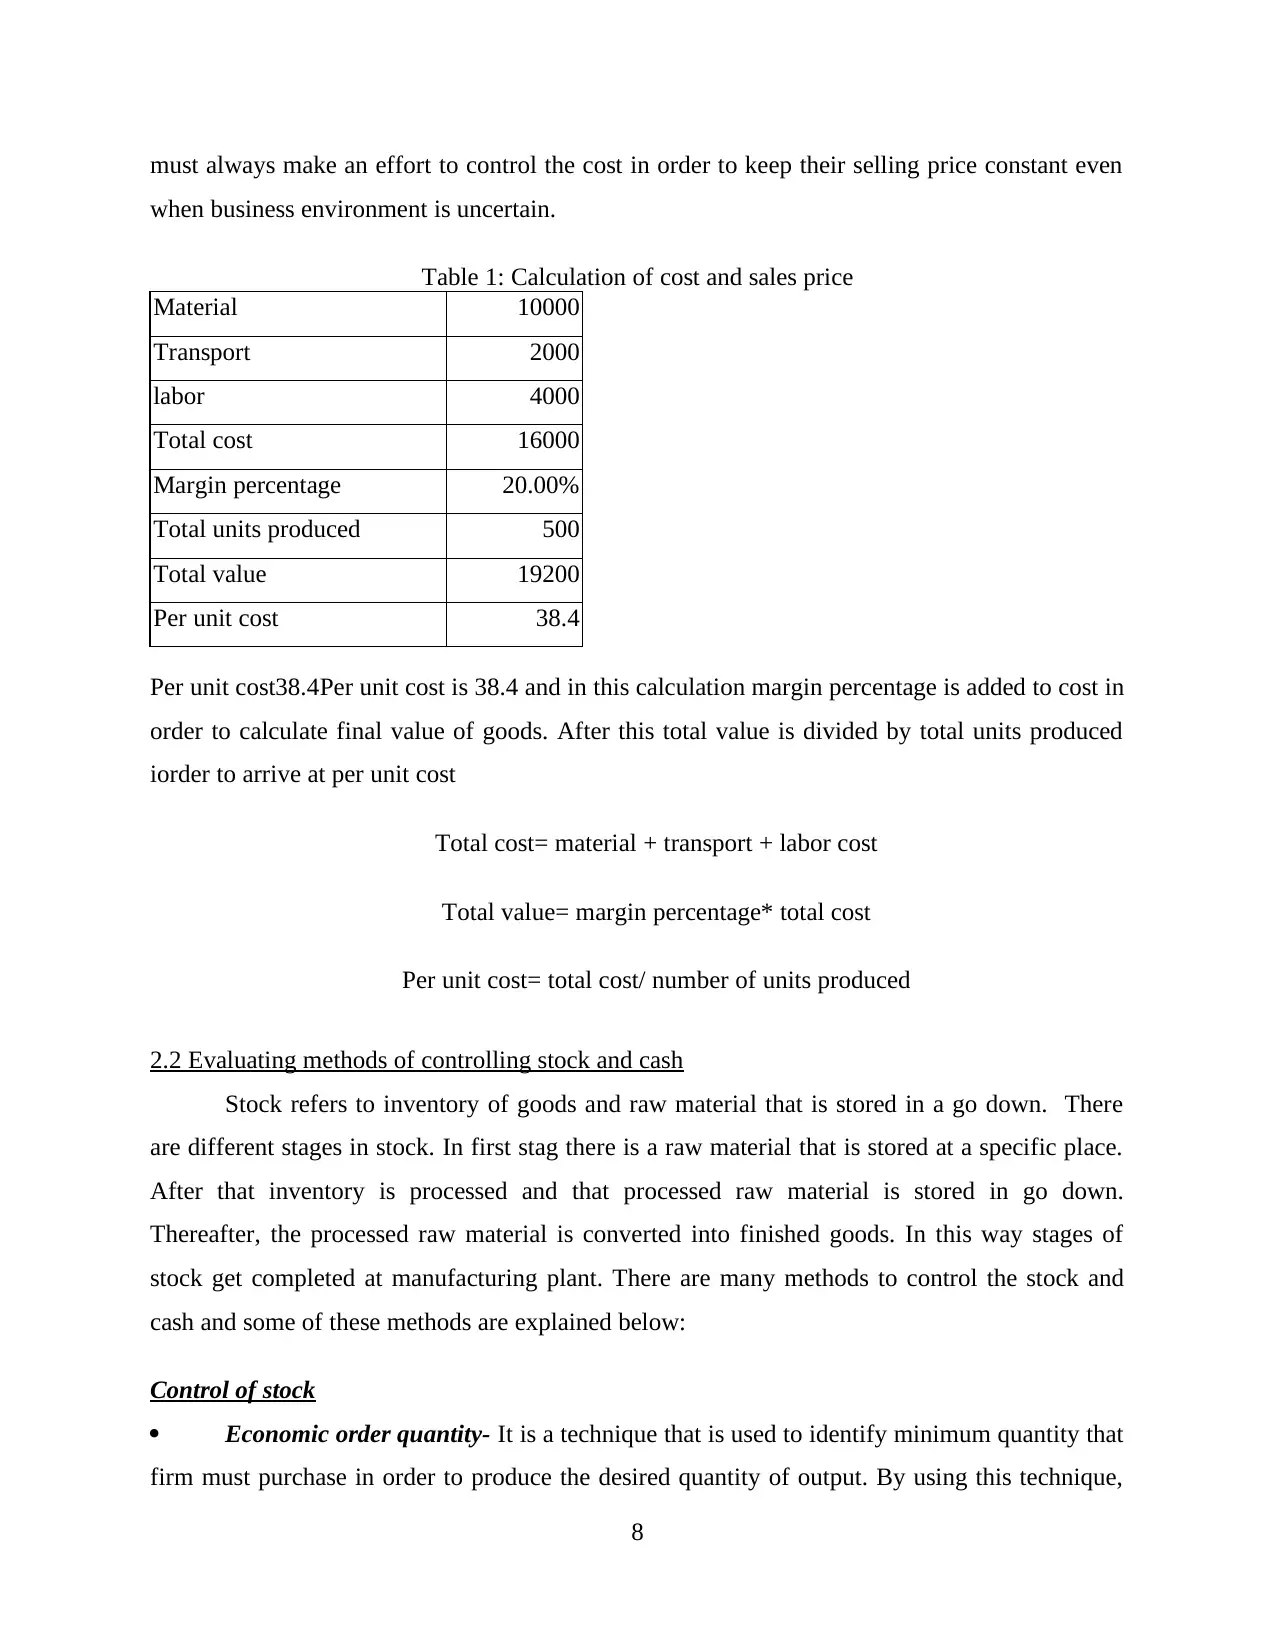
must always make an effort to control the cost in order to keep their selling price constant even
when business environment is uncertain.
Table 1: Calculation of cost and sales price
Material 10000
Transport 2000
labor 4000
Total cost 16000
Margin percentage 20.00%
Total units produced 500
Total value 19200
Per unit cost 38.4
Per unit cost38.4Per unit cost is 38.4 and in this calculation margin percentage is added to cost in
order to calculate final value of goods. After this total value is divided by total units produced
iorder to arrive at per unit cost
Total cost= material + transport + labor cost
Total value= margin percentage* total cost
Per unit cost= total cost/ number of units produced
2.2 Evaluating methods of controlling stock and cash
Stock refers to inventory of goods and raw material that is stored in a go down. There
are different stages in stock. In first stag there is a raw material that is stored at a specific place.
After that inventory is processed and that processed raw material is stored in go down.
Thereafter, the processed raw material is converted into finished goods. In this way stages of
stock get completed at manufacturing plant. There are many methods to control the stock and
cash and some of these methods are explained below:
Control of stock
Economic order quantity- It is a technique that is used to identify minimum quantity that
firm must purchase in order to produce the desired quantity of output. By using this technique,
8
⊘ This is a preview!⊘
Do you want full access?
Subscribe today to unlock all pages.
Trusted by 1+ million students worldwide
company abstains from employing unnecessary amount on the purchase of raw material.
Moreover, cash is also not blocked on unused inventory. Thus, this technique also helps in
managing cash in an appropriate manner.
EOQ= ?2SD/PI
Where
SD= set up cost
D= Demand rate
P= production cost
I= Interest rate
Minimum quantity- By using old data, Aquapet can identify minimum quantity of raw
material that it mostly consumes in specific duration say month or quarter (Petersen, 2009). By
following this technique, firm can manage its cash in a proper manner and also prevents the
blockage of cash in unused stock.
Just in time- It is a technique that is used to control stock. As per this technique raw
material are purchased to meet actual demand. As a result good control is maintained on stock
and amount is prevented from being locked in unused inventory.
Recorder point (ROP) - This method is used for system controlled process and is also
used for controlling manual as well as visual environment. Due to this reason this technique is
widely used by organizations at the manufacturing facility.
LIFO- LIFO means last in first out and it says that units that are produced at end must be
sold first so that its value does not deteriorate.
FIFO – This concept state that inventory of units that is produced first must be sold first.
Hence, inventory that remains at the end of a year is sod at the end of the year.
ANTIPATORY- It is a technique that is used to forecast inventory that will be required in
future. In this way this technique helps in controlling stock in upcoming time period.
RESPONSE- It is a system that is used to control stock when business situation gets
changed. With change in condition by using this system new inventory control targets are
determined.
Control of cash
9
Paraphrase This Document
Need a fresh take? Get an instant paraphrase of this document with our AI Paraphraser
There is a lots of importance of cash and by using this business in run smoothly even
business conditions are uncertain. For controlling cash, firm can use cash management strategy
under which it will control cash inflow and outflow. With respect to this, Aquapet can centralize
its payment system and on the other hand, it can decentralize its receipt system. Along with this,
firm will make all payments by cheques. By doing all these efforts, firm can control its cash
outflow or can extend the time for cash outflow (Ross, Westerfield and Jordan, 2008). However,
due to decentralization in receipt system, cash inflow intensity will get increased. In this way,
firm will be able to control the cash in a proper manner.
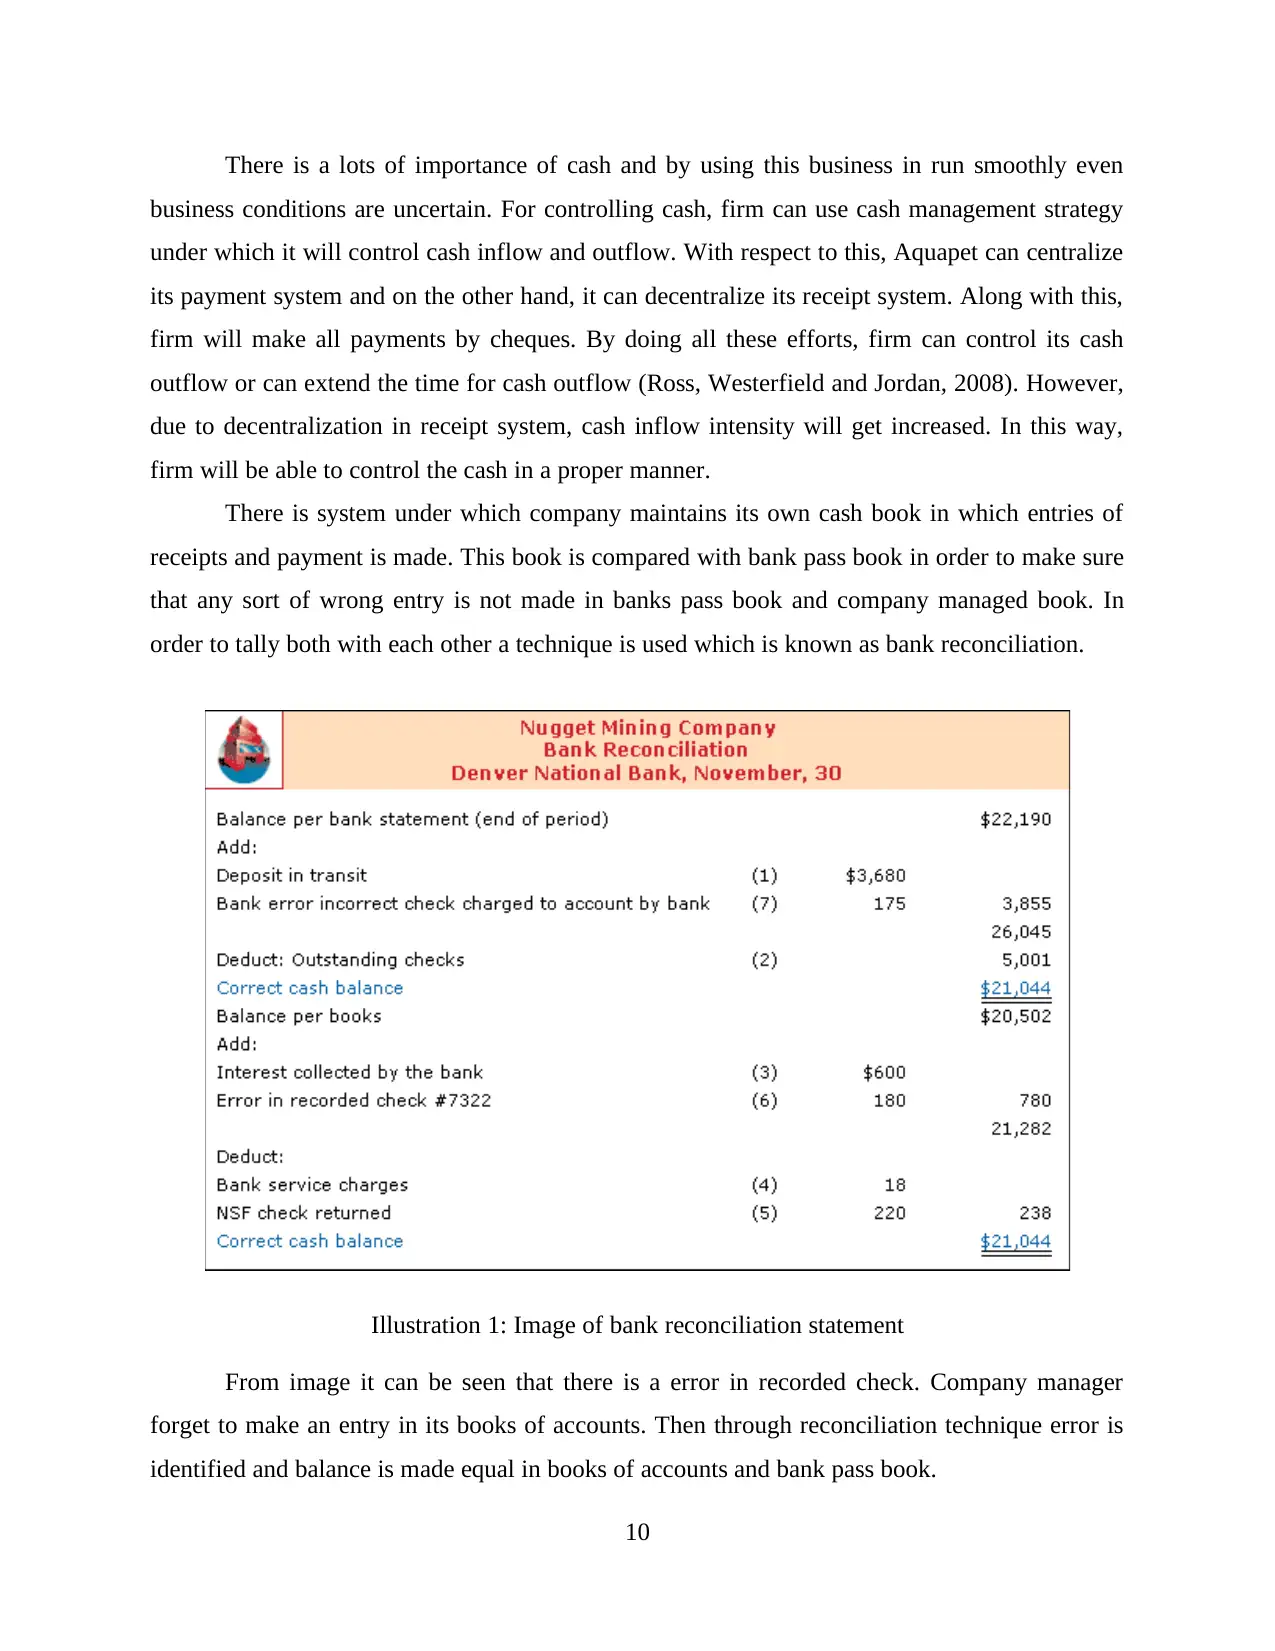
There is system under which company maintains its own cash book in which entries of
receipts and payment is made. This book is compared with bank pass book in order to make sure
that any sort of wrong entry is not made in banks pass book and company managed book. In
order to tally both with each other a technique is used which is known as bank reconciliation.
Illustration 1: Image of bank reconciliation statement
From image it can be seen that there is a error in recorded check. Company manager
forget to make an entry in its books of accounts. Then through reconciliation technique error is
identified and balance is made equal in books of accounts and bank pass book.
10
business conditions are uncertain. For controlling cash, firm can use cash management strategy
under which it will control cash inflow and outflow. With respect to this, Aquapet can centralize
its payment system and on the other hand, it can decentralize its receipt system. Along with this,
firm will make all payments by cheques. By doing all these efforts, firm can control its cash
outflow or can extend the time for cash outflow (Ross, Westerfield and Jordan, 2008). However,
due to decentralization in receipt system, cash inflow intensity will get increased. In this way,
firm will be able to control the cash in a proper manner.
There is system under which company maintains its own cash book in which entries of
receipts and payment is made. This book is compared with bank pass book in order to make sure
that any sort of wrong entry is not made in banks pass book and company managed book. In
order to tally both with each other a technique is used which is known as bank reconciliation.
Illustration 1: Image of bank reconciliation statement
From image it can be seen that there is a error in recorded check. Company manager
forget to make an entry in its books of accounts. Then through reconciliation technique error is
identified and balance is made equal in books of accounts and bank pass book.
10
TASK 3
3.3 Process and purpose of budgetary control
Process of budgetary control
Determine standard- This is the first stage in budgetary control process and in this step,
standards are determined for the cost and revenue. These standards are further used to identify
whether the firm gives good or poor performance (Allen, Qian and Qian, 2005).
Measuring performance- This is the second step and under this stage, performance of
the firm is measured in terms of value.
Comparison of actual performance with determined standards- In the third stage, after
measurement of performance, comparison of same is done with standards in order to identify
positive and negative points of company with respect to budget for specific quarter.
Identify variance/evalauting- By making comparison; managers identify the areas where
company gives a good and poor performance. If variance is positive then it is considered to be
good from company’s point of view (Knudtzon and Schmidling, 2006). But if variance is
negative then firm takes corrective actions in order to ensure that same mistakes will never get
repeated in the upcoming time period.
Corrective action/controlling- After identification of negative factors, managers carries
out discussion with their subordinates. On the basis of discussion, they find out ways that can be
adopted in order to avoid occurrence of such a poor performance again.
The main purpose of budgetary control is to motivate managers to control cost. This is done by
setting targets related to expenses in a budget. The other main purpose of budgetary control is to
ensure that expenses will remain in line that is determined in a budget. In this regard managers
start evaluation process under which actual results are compared with determine standards in
order to check that results are in line to expectation or not.
Budgetary control cycle
Responsibility- In this stage responsibilities of managers and employees are determined who will
play a key role in cost control. Responsibilities indicate expectation of top management from
managers. Hence, managers must makes an attempt to control cost.
11
⊘ This is a preview!⊘
Do you want full access?
Subscribe today to unlock all pages.
Trusted by 1+ million students worldwide
1 out of 26
Related Documents


Your All-in-One AI-Powered Toolkit for Academic Success.
+13062052269
info@desklib.com
Available 24*7 on WhatsApp / Email
![[object Object]](/_next/static/media/star-bottom.7253800d.svg)
Unlock your academic potential
Copyright © 2020–2026 A2Z Services. All Rights Reserved. Developed and managed by ZUCOL.