Financial Analysis and Budgetary Control in Hospitality - Finance
VerifiedAdded on 2019/12/03
|21
|5625
|170
Report
AI Summary
This report provides a comprehensive financial analysis of the hospitality industry, covering various aspects of financial management. It begins with an introduction to the importance of finance in both business and service organizations, highlighting internal and external sources of funding. The report then delves into income generation methods for large chain restaurants, emphasizing customer service, technological advancements, and franchise opportunities. It analyzes cost elements, gross profit percentages, and selling prices, along with methods for controlling stock and cash flow, including techniques like economic order quantity and just-in-time inventory management. Furthermore, the report discusses the process and purpose of budgetary control, variance analysis, and the importance of trial balances. It includes the calculation of financial ratios and strategies to improve profit margins. Finally, the report explores cost classification (fixed, variable, and semi-variable), calculates profit/loss potential, and determines the break-even point, offering valuable insights into short-term decision-making tools in the hospitality sector.
Finance in hospitality
Paraphrase This Document
Need a fresh take? Get an instant paraphrase of this document with our AI Paraphraser
Table of Contents
INTRODUCTION...........................................................................................................................1
TASK 1............................................................................................................................................1
AC 1.1 Sources available to business and service industries......................................................1
AC 1.2 Methods of generating income for large chain restaurant...............................................2
TASK 2............................................................................................................................................3
AC 2.1 Element of cost, gross profit percentage and selling prices............................................3
AC 2.2 Evaluation of methods for controlling stock and cash....................................................3
Task 3...............................................................................................................................................4
3.1Process and purpose of budgetary control..............................................................................4
3.2 Analyze variances from budgeted and actual figures, offering suggestions for appropriate
future management action............................................................................................................5
Task 4...............................................................................................................................................7
3.1 Structure of trial balance........................................................................................................7
3.2 Journal entries of R.Riggs with adjustments.........................................................................7
4.1 Calculation of following ratio for R. Riggs.........................................................................10
4.2 Appropriate measures which company need to take into consideration in order to improve
its profit margin are as follow....................................................................................................10
TASK 5..........................................................................................................................................11
AC 5.1 Fixed, variable and semi variable cost..........................................................................11
AC 5.2, 5.3Calculation of profit/loss potential and break-even point.......................................12
Conclusion.....................................................................................................................................15
INTRODUCTION
The need for finance sources is arises for both business and service organization. Every
business can collect its finance sources from two kinds of sources. It includes both internal and
external finance sources. In this reports different kind of available internal and external finance
sources are identified (Mina, Lahr and Hughes, 2013). Moreover, the company has to take
different kind of decisions for deciding the sales prices, inventory control and cash control. This
report aims at identifying different cost factors and methods for controlling stock and cash. In
addition to it, the importance of budgetary process is also discussed in the report. It aims at
determining the variances by comparing the budgeted and actual figures. At last, the report
discuss that how short term decisions can be taken by using different tools such as breakeven
point, contribution and profitability.
TASK 1
AC 1.1 Sources available to business and service industries
Every business required to have adequate amount of capital to fulfill their requirement
and run business operations in an effective manner. The organization can fulfill its capital
requirement amount to 50000£ using the following sources;
Internal sources: Every business and industries have some internal finance sources that are
available within the organization.
Retained earnings: The proportion of business profitability that is not distributed among
shareholders is known as retained earnings (Peirson and et. al., 2014). All the industries whether
business and service can use this earning to raise finance availability.
Cash Squeezed from daily operations: It is very short term finance sources available to
both service and business sectors. Cash can be squeezed by making delayed payments to the
creditors and earlier receipts from debtors. Debtors are the persons to whom business made sales
on credit whereas the persons who provide service to the business for purchasing the goods on
credit are known as creditors. Business can negotiate their creditors by making lated payments
and receive earlier from the debtors business can avail higher the cash balance helps to fulfill the
financial requirement.
1 | P a g e
⊘ This is a preview!⊘
Do you want full access?
Subscribe today to unlock all pages.
Trusted by 1+ million students worldwide
Sale of scrap and assets: The business and service organizations can sale its waste and
disposable assets which are not using in the operations. The assets that are not using in
productive purpose and unusable for the business can be sold in the market. The amount received
from such sales can be used to fulfill its financial requirements.
External sources: These sources are available outside available in the market that is
explained below:
Share capital: The organizations can raise its finance availability by issuing the share
capital (Farre-Mensa, Nanda and Jain, 2013). It is widely used by the companies to increase its
finance sources by issuing both equity and preference capital. Company need to pay dividend to
the shareholders on their respective investment. The rate of dividend is not fixed on equity share
capital while it is fixed on the preference share capital. Another, the equity shareholders have
right to control the business operating functions.
Loan capital: Both the business and service sector organizations can take loans from
banks and other creditors. The bank loan is available for different time duration short term,
medium term and long term. It widely used by all the corporations that fulfill the funds
requirement to a great extent. Bank provides loans at an interest rate with demanding for the
collateral security.
Government grant and subsidy: Each country's government provides subsidies and
grants to the industries in order to make economic growth. It is mostly available to the service
sector organizations (Kalamova, Kaminker and Johnstone, 2011). Government grants helps to
make economic development by making industrial growth.
Debentures capital: Business can issue debentures to the debenture holders. It is a debt
acknowledgment on which debenture holders have right to receive a fixed rate of interest
periodically. Through issuing the debentures in the market, company can fulfill their long term
financial need.
Overdraft: It is a facility that helps to withdraw higher the amount than the existed
account balance. Bank charges an interest on such facilities which is comparatively higher than
interest rates on loans. Further, the overdraft is available up to a fixed amount of capital.
Immediate finance requirements can be mitigate through this source.
Paraphrase This Document
Need a fresh take? Get an instant paraphrase of this document with our AI Paraphraser
AC 1.2 Methods of generating income for large chain restaurant
A large chain restaurant can generate income from different sources in order to increase
its revenue. This in turn, the company can get high amount of profitability.
Qualified customer services: Every restaurant need to provide qualified and better
customer services so as to increase its profits. It has to provide better food taste and food services
to the customers by providing proper training to the staff (Brealey, 2012).
Technological improvement: Restaurant business can lead to success in the market by
using improved technology. It can avail different services like wi-fi facilities and online
marketing using web technology.
Creativity: The restaurant can increase its return by making creatively design its menu
and infrastructure, new dishes and drinks. Moreover, it can use creativity in the way of
presenting the meal to customers. It also includes the entertainment facility that is provided to the
customers based on the consumer’s choices.
Franchise: It is another source of income available to the large restaurant chain. It can
give the rights to use its franchise to the other restaurants. It helps the organization by increased
revenue and profitability.
Branches: Large restaurant chain can also generate revenues by establishing its branches
in different countries. By doing this, the organization can improve its brand image, occupy large
market share and increase profitability.
TASK 2
AC 2.1 Element of cost, gross profit percentage and selling prices
It is important for every organization to determine the element of cost, gross profit
percentage and selling price.
Element of cost: As per the given case, there are two elements of cost in Marks &
Spencer. It includes both direct cost and indirect costs that are described below:
Direct cost: These costs are directly attributed to the production of the company. It is
variable in nature and includes material, wages and overhead cost. It includes the cost of material
consumed, labor’s wages and overhead cost such as carriage inward, octroi and excise duty.
Material cost: Material cost involves cost of purchasing raw material for production
purpose. Marks and Spencer Company need to purchase raw material for producing the goods
and services.
Labor cost: Labor are the persons who make their efforts to transferring the raw material
into finished goods. The cost of the labor is labor wages includes in cost of goods sold.
Overheads: Along with the material and labor charges, business also have different kind
of overheads. It includes both direct and indirect overheads. Direct overheads directly can be
attributed to the production expenditures. It includes octroi, carriage inward, productive
expenses, factory lighting and so on. However, indirect expenses are unrelated to the
manufacturing. It includes salary, rent and rates, insurance and tax payments.
Indirect cost: Indirect costs cannot be related to a specific cost object (Datar and et. al.,
2013). Moreover, it cannot be attributed to the particular department of the organization. It
includes power consumption, depreciation of assets, supervisor and watchman salary, manager's
remuneration, telephone expenditure, stationery and amount of taxes.
Element of gross profit: The gross profit is the difference between gross sales and cost of
goods sold. Therefore, the gross profit percentage has two elements that are sales and total cost.
In addition to it, the opening and closing stock are the other elements. Higher the sales and lower
the cost contributes to higher the gross profit percentage and vice versa.
Elements of selling price: selling price is decided by considering cost and required profit
percentage. In addition to it, advertising, marketing, customer preferences, demand and supply
and their purchasing power are the other factors that affect the selling price decisions.
AC 2.2 Evaluation of methods for controlling stock and cash
It is very important for every organization to control its inventory and cash. Effective
control over both the factors contributes to higher the revenue and return.
Methods for controlling stock:
Deciding various stock levels: It is the most common technique and widely used by the
companies. In these techniques, the business can decide reorder level, minimum stock level,
maximum stock level, average stock level and danger level. Moreover, economic order quantity
can also be decided by the companies that help in purchasing the required quantities at lower
cost.
⊘ This is a preview!⊘
Do you want full access?
Subscribe today to unlock all pages.
Trusted by 1+ million students worldwide
Just in time: The method helps to mitigate the waiting time of customers to receive the
goods. The technique is designed to fulfill the customer demands on right time by providing
goods and service quickly. Under this technique business make effective research analysis to
predict the customer demands takes a lot of time.
Economic order quantity: Inventory involves cost of ordering the inventory and holding
it in the business. The methods help to minimize the inventory holding cost and the ordering
cost. The techniques can be applied when the product demand does not get changes over the
time period.
Last in and first out: - this means that the goods added to the stock are assumed to be the first
good that is removed from the sale of inventory.
First in, first out: - This method indicates that oldest inventory items are recorded first as and
when they are sold out. But it does not mean that the exact oldest item are recorded and sold out
first.
Inventory Budgets: In it, both the purchase and sales budgets can be prepared by the
companies (Muller, 2011). Purchase budget indicate that how much quantity of goods is required
to be purchase at different time. However, sales budget provide estimation for required quantity
of production for goods and sold.
Maintaining proper inventory system: This system aims to control over stock of material
using different methods. It includes last in first out method and first in first out method. It
ensures proper analysis of stock inflow and outflow at different time durations.
Methods for controlling cash: Along with the inventory control mechanism, business also
has to control its cash as it affects the operating activities to a great extent. The allocation of cash
to different operations should properly managed by the company. It can be done by preparing the
cash budget. Moreover, proper documentation also helps for cash control purpose. It ensures
proper evidence regarding cash receipts and cash payments. In addition, the company has to
implement effective internal control system in which each operating activities is checked by
another. Thus, it helps in identifying the cash embezzlement done by workers or others.
Paraphrase This Document
Need a fresh take? Get an instant paraphrase of this document with our AI Paraphraser
Task 3
3.1Process and purpose of budgetary control
Budgetary control is the process which assists the company to compare its actual position with
that of its budgetary figures. Comparison between actual and budgeted figures aids the company
to identify the difference and take necessary measure to overcome various problems
(Longnecker, 2011). Therefore, some of the purpose of budgetary control is as follows:-
1. To secure the future by anticipating various budgets in advance: Budgetary control
system assists the company to secure its market position by anticipating various budgets
in advance.
2. To know the actual position of the company: Another purpose of budgetary control is
to know its actual position in the market. Therefore, in order to know the actual position
of the company, the firm compares its actual figures with that of its budgeted figures.
3. To reduce wastage and increase the level of profitability: - Another purpose of the
organization is to conduct budgetary control is that company wants to increase its level of
sales by reducing waste of the various products (Roger, 2010).
4. To operate the cost of various departments: - One of the major purposes of the
organization to follow the budgetary control is to monitor the cost of various departments
in advance so that at the end of every financial year no problem arises.
Process of conducting budgetary control is as follows:-
Preparation of budget for the definite period: - T First step in the process of budgetary
control is that company is required to prepare various budgets for definite period of time.
Various budgets which can be prepared by the company are income budget, cash budgets
and so on.
Actual performance has to be recorded: - another step is to collect all the necessary
data and information by the company in order to perform and prepare the budget.
Comparison between actual and budget figures: - once actual data is collected that it is
compared with budgetary figures in order to find out actual position of the business in the
market.
Revision of the budget: - at last, when data are compared to know the actual position of
the business than, the firm needs to revise its budget once again in order to find out
whether any drawbacks are there or not (Datar and et. al., 2013).
3.2 Analyze variances from budgeted and actual figures, offering suggestions for appropriate
future management action
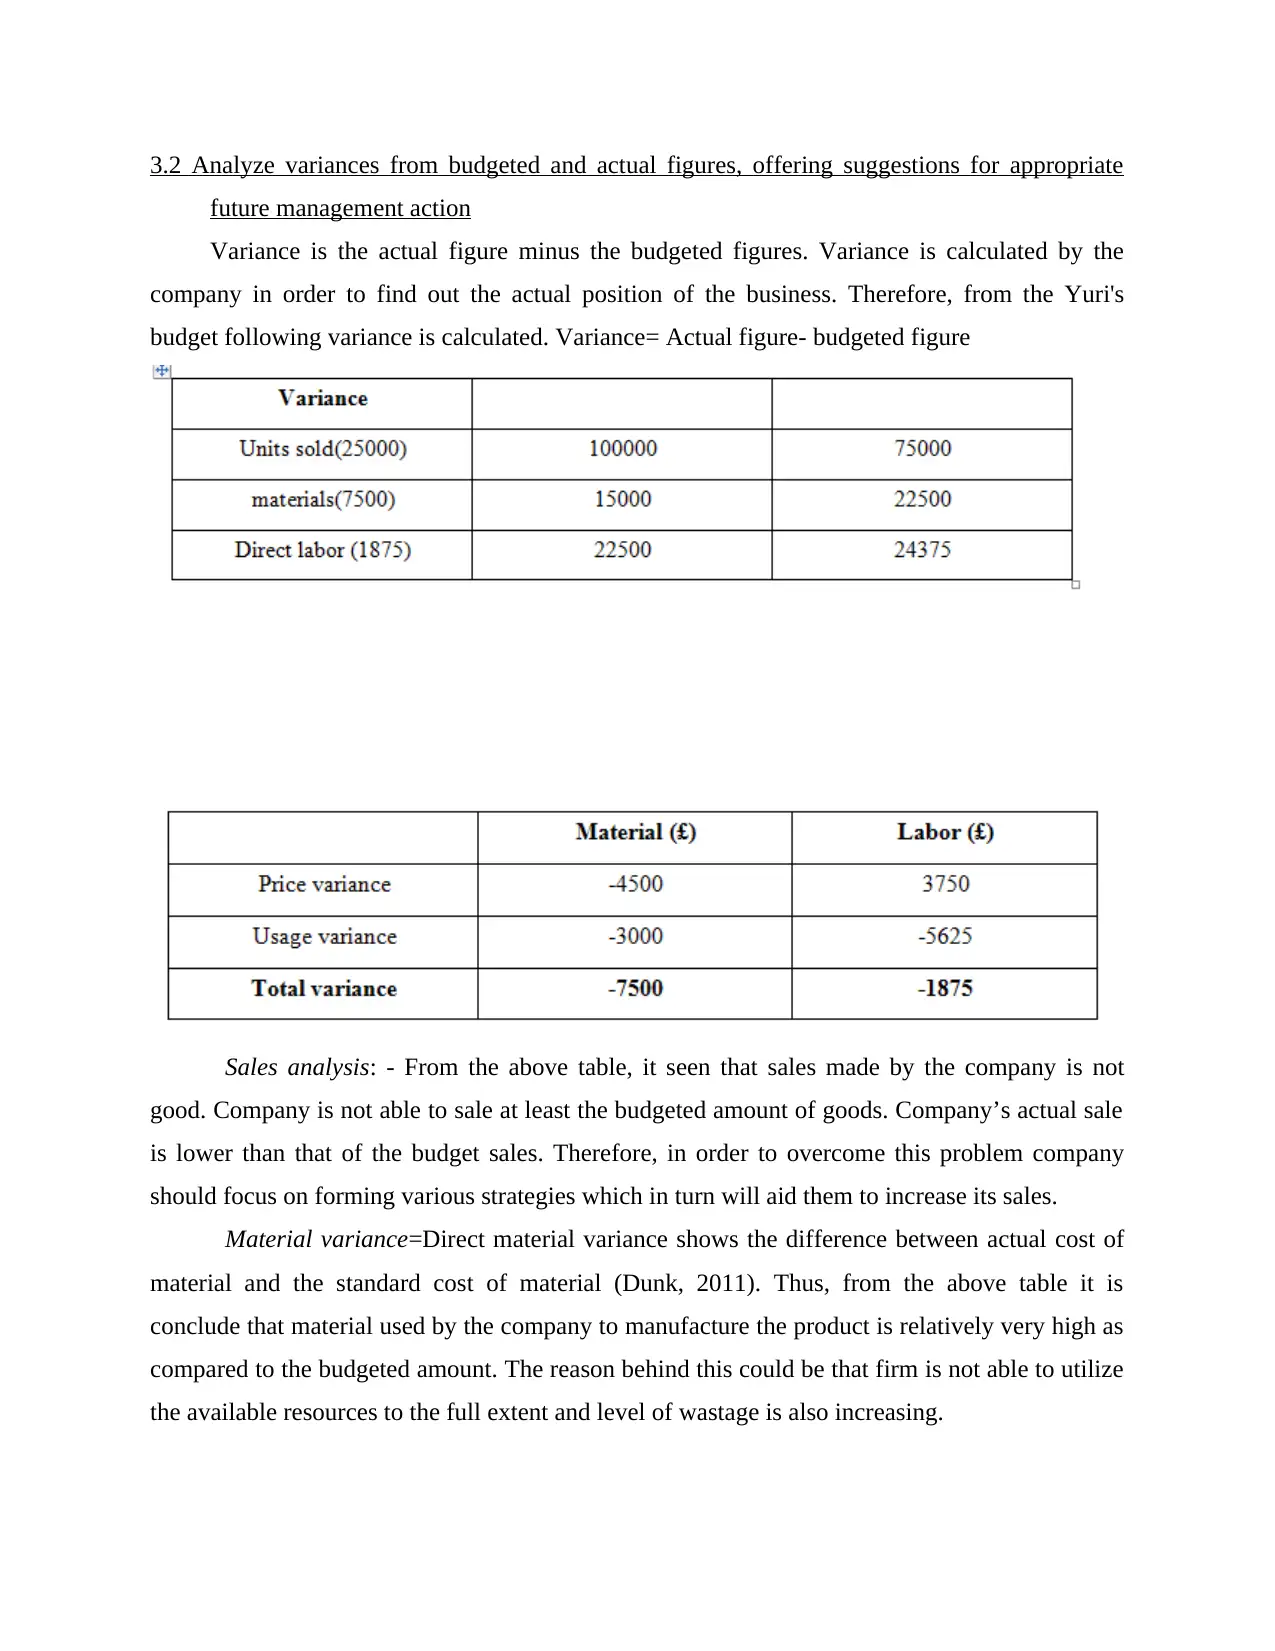
Variance is the actual figure minus the budgeted figures. Variance is calculated by the
company in order to find out the actual position of the business. Therefore, from the Yuri's
budget following variance is calculated. Variance= Actual figure- budgeted figure
Sales analysis: - From the above table, it seen that sales made by the company is not
good. Company is not able to sale at least the budgeted amount of goods. Company’s actual sale
is lower than that of the budget sales. Therefore, in order to overcome this problem company
should focus on forming various strategies which in turn will aid them to increase its sales.
Material variance=Direct material variance shows the difference between actual cost of
material and the standard cost of material (Dunk, 2011). Thus, from the above table it is
conclude that material used by the company to manufacture the product is relatively very high as
compared to the budgeted amount. The reason behind this could be that firm is not able to utilize
the available resources to the full extent and level of wastage is also increasing.
future management action
Variance is the actual figure minus the budgeted figures. Variance is calculated by the
company in order to find out the actual position of the business. Therefore, from the Yuri's
budget following variance is calculated. Variance= Actual figure- budgeted figure
Sales analysis: - From the above table, it seen that sales made by the company is not
good. Company is not able to sale at least the budgeted amount of goods. Company’s actual sale
is lower than that of the budget sales. Therefore, in order to overcome this problem company
should focus on forming various strategies which in turn will aid them to increase its sales.
Material variance=Direct material variance shows the difference between actual cost of
material and the standard cost of material (Dunk, 2011). Thus, from the above table it is
conclude that material used by the company to manufacture the product is relatively very high as
compared to the budgeted amount. The reason behind this could be that firm is not able to utilize
the available resources to the full extent and level of wastage is also increasing.
⊘ This is a preview!⊘
Do you want full access?
Subscribe today to unlock all pages.
Trusted by 1+ million students worldwide
Labor variance: - Labor variance shows the variance of labor cost. It shows the
difference between actual cost of labor and standard cost of labor (Otley and Emmanuel, 2013).
Therefore, from the above table it can be concluded that direct labor cost has also increased as
compared to the budgetary figures. The reason behind this could be that company is not able to
utilize the human resource to the full extent. This in turn results in increasing the cost of direct
labor.
Price variance: - From the above table it is seen that price variance of the firm is also
changing at the rapid rate. The reason behind this could be that company is able to generate more
income from the material available to them and its expenses are increasing by paying wages to
its workers (Hofstede, 2012).
Usage variance: - From the above table it can be concluded that efficiency variance of the
company is relatively good. Company is able to reduce the cost of its usage which in turn will
assist the company to increase its sales and probability.
Task 4
3.1 Structure of trial balance
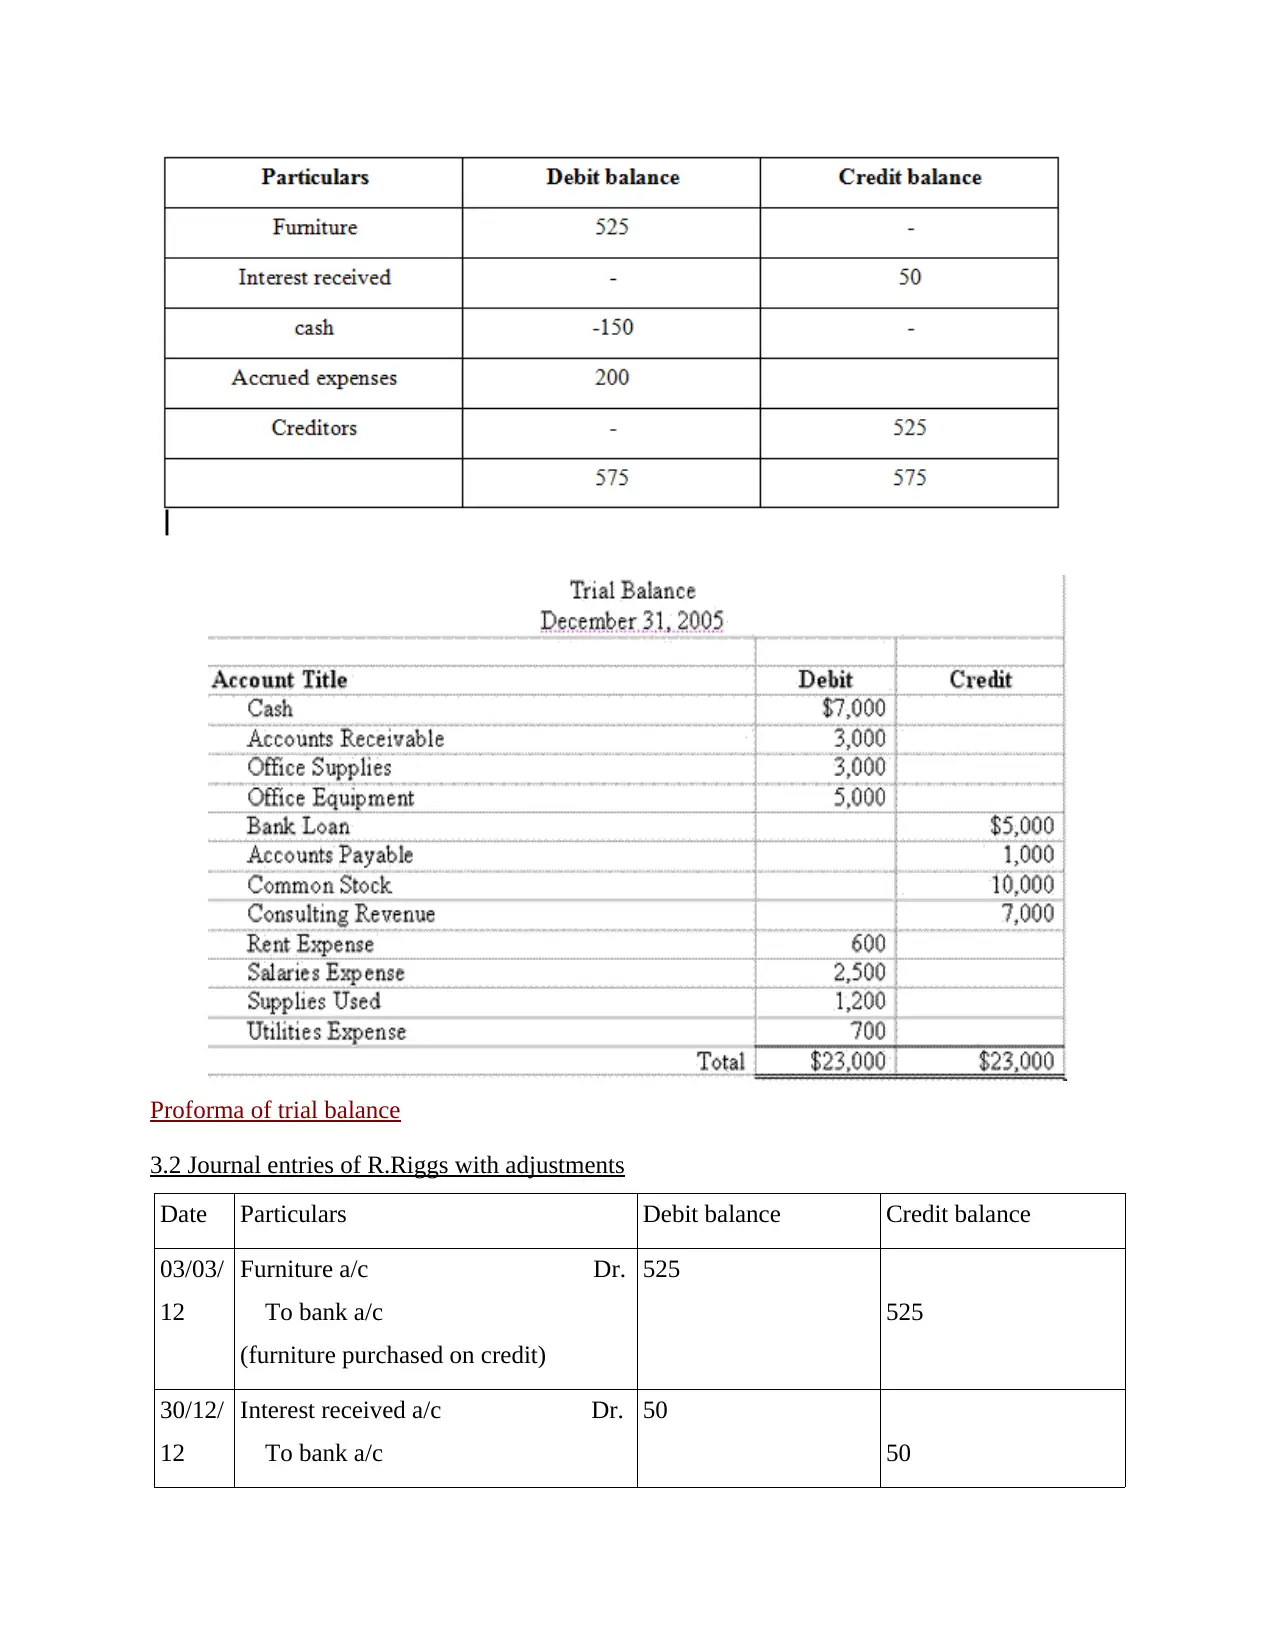
Trial balance is a type of worksheet in which all the ledgers account are complied into
debit and credit columns (Gibson, 2012). It is prepared by the company at the end of every final
year. Trial balance is normally used by the company to prepare financial statements like profit
and loss account, balance sheet and cash flow statements. It is also prepared by the company in
order to known whether any difference occurs between debit and credit balance and they are
mathematically correct or not.
Structure of trial balance according to the Journal entries done below:-
difference between actual cost of labor and standard cost of labor (Otley and Emmanuel, 2013).
Therefore, from the above table it can be concluded that direct labor cost has also increased as
compared to the budgetary figures. The reason behind this could be that company is not able to
utilize the human resource to the full extent. This in turn results in increasing the cost of direct
labor.
Price variance: - From the above table it is seen that price variance of the firm is also
changing at the rapid rate. The reason behind this could be that company is able to generate more
income from the material available to them and its expenses are increasing by paying wages to
its workers (Hofstede, 2012).
Usage variance: - From the above table it can be concluded that efficiency variance of the
company is relatively good. Company is able to reduce the cost of its usage which in turn will
assist the company to increase its sales and probability.
Task 4
3.1 Structure of trial balance
Trial balance is a type of worksheet in which all the ledgers account are complied into
debit and credit columns (Gibson, 2012). It is prepared by the company at the end of every final
year. Trial balance is normally used by the company to prepare financial statements like profit
and loss account, balance sheet and cash flow statements. It is also prepared by the company in
order to known whether any difference occurs between debit and credit balance and they are
mathematically correct or not.
Structure of trial balance according to the Journal entries done below:-
Paraphrase This Document
Need a fresh take? Get an instant paraphrase of this document with our AI Paraphraser
Proforma of trial balance
3.2 Journal entries of R.Riggs with adjustments
Date Particulars Debit balance Credit balance
03/03/
12
Furniture a/c Dr.
To bank a/c
(furniture purchased on credit)
525
525
30/12/
12
Interest received a/c Dr.
To bank a/c
50
50
3.2 Journal entries of R.Riggs with adjustments
Date Particulars Debit balance Credit balance
03/03/
12
Furniture a/c Dr.
To bank a/c
(furniture purchased on credit)
525
525
30/12/
12
Interest received a/c Dr.
To bank a/c
50
50
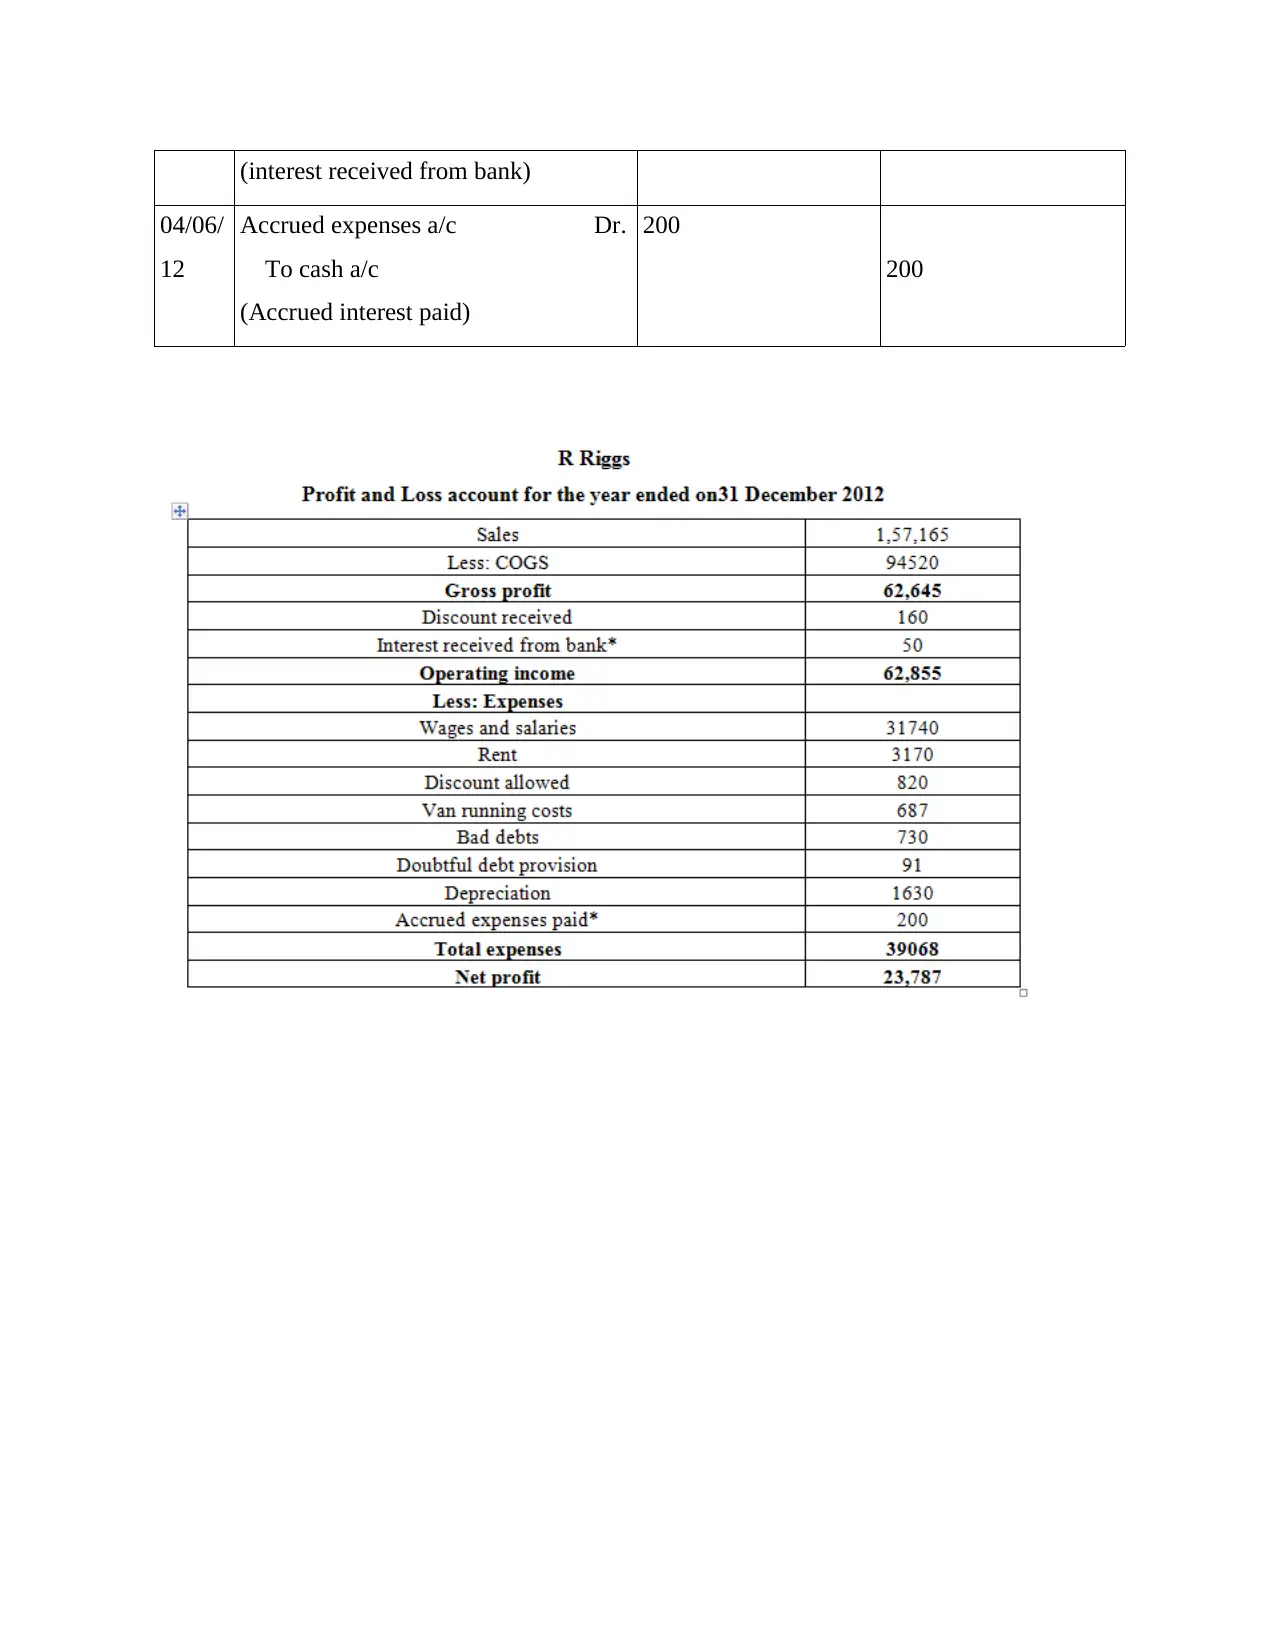
(interest received from bank)
04/06/
12
Accrued expenses a/c Dr.
To cash a/c
(Accrued interest paid)
200
200
04/06/
12
Accrued expenses a/c Dr.
To cash a/c
(Accrued interest paid)
200
200
⊘ This is a preview!⊘
Do you want full access?
Subscribe today to unlock all pages.
Trusted by 1+ million students worldwide
1 out of 21
Related Documents


Your All-in-One AI-Powered Toolkit for Academic Success.
+13062052269
info@desklib.com
Available 24*7 on WhatsApp / Email
![[object Object]](/_next/static/media/star-bottom.7253800d.svg)
Unlock your academic potential
Copyright © 2020–2026 A2Z Services. All Rights Reserved. Developed and managed by ZUCOL.