Hot Drip Galvanizing Ltd: Problem Analysis and Improvement Report

Verified

Added on  2021/04/21

|21
|4414
|30
Report
AI Summary
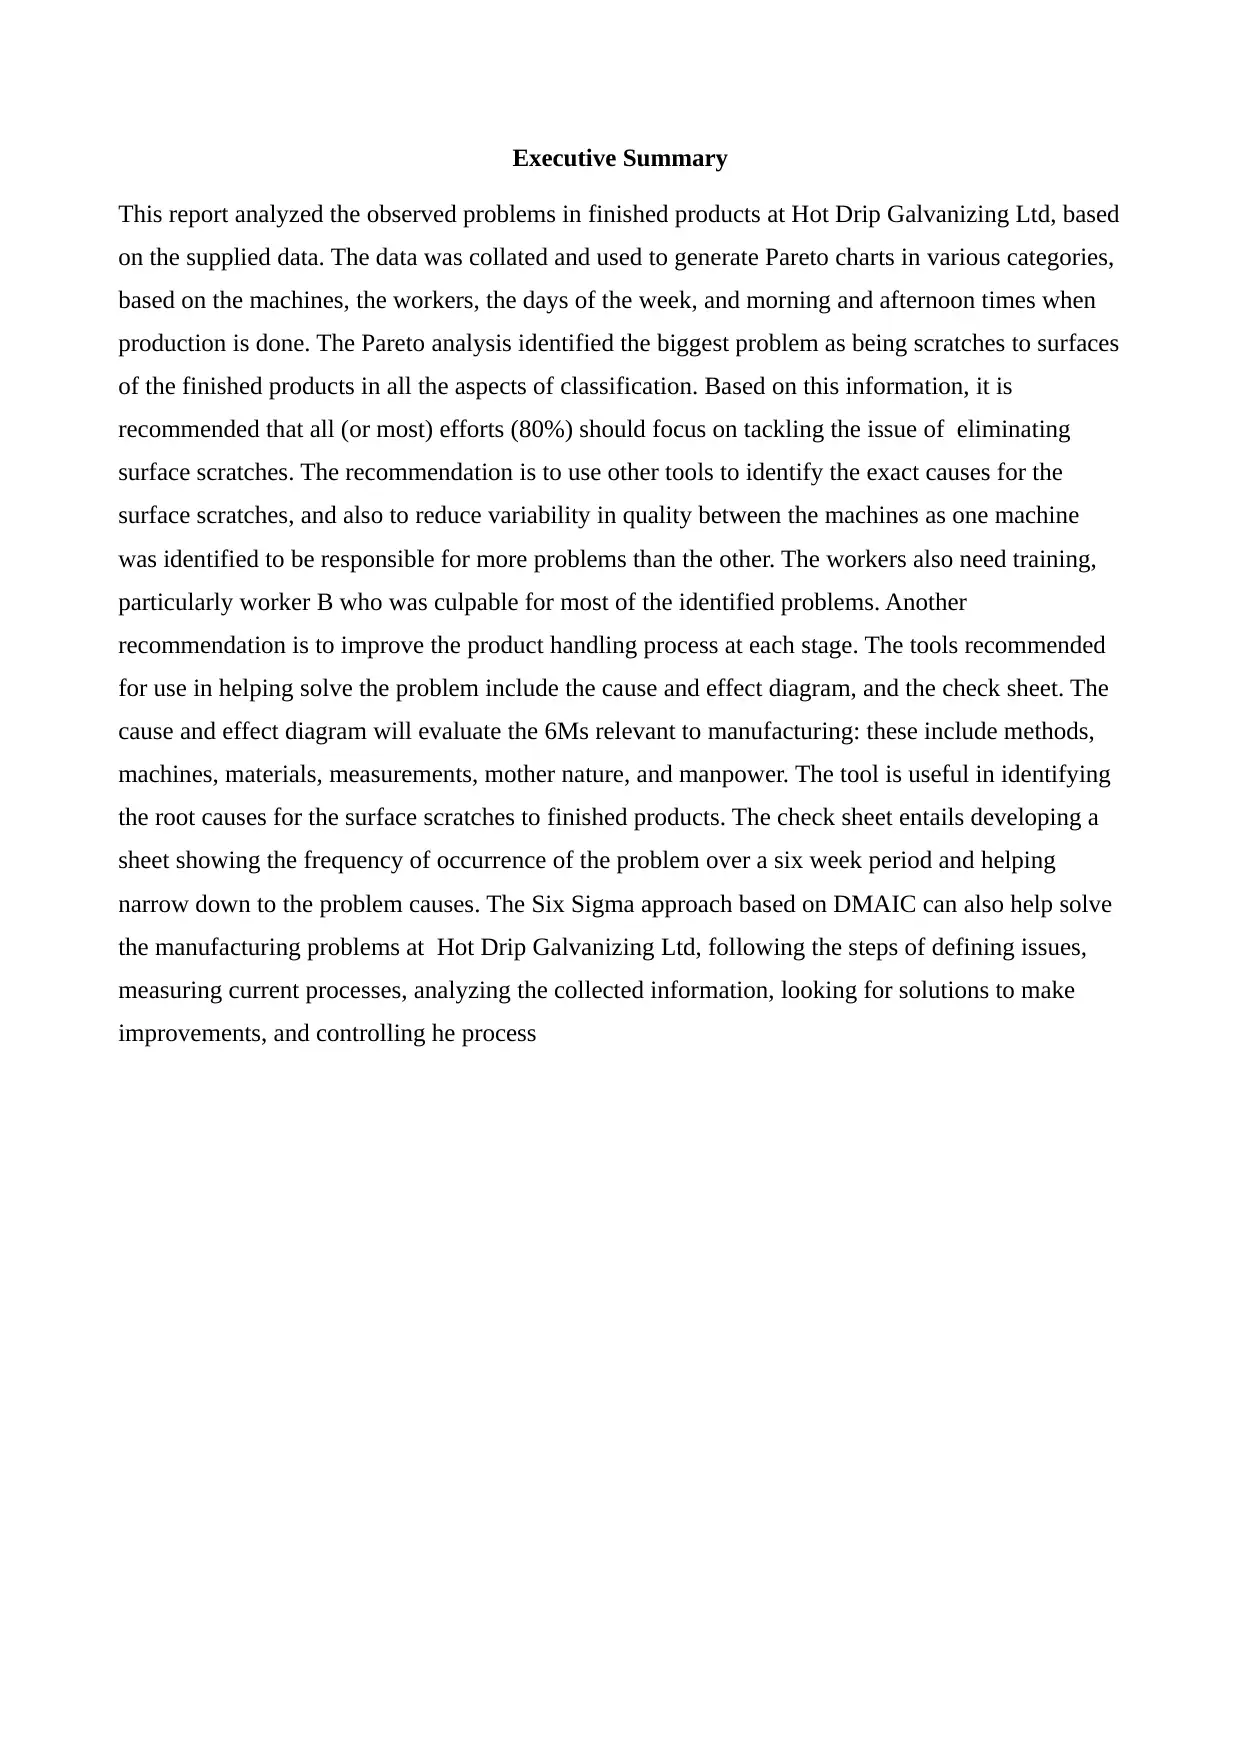
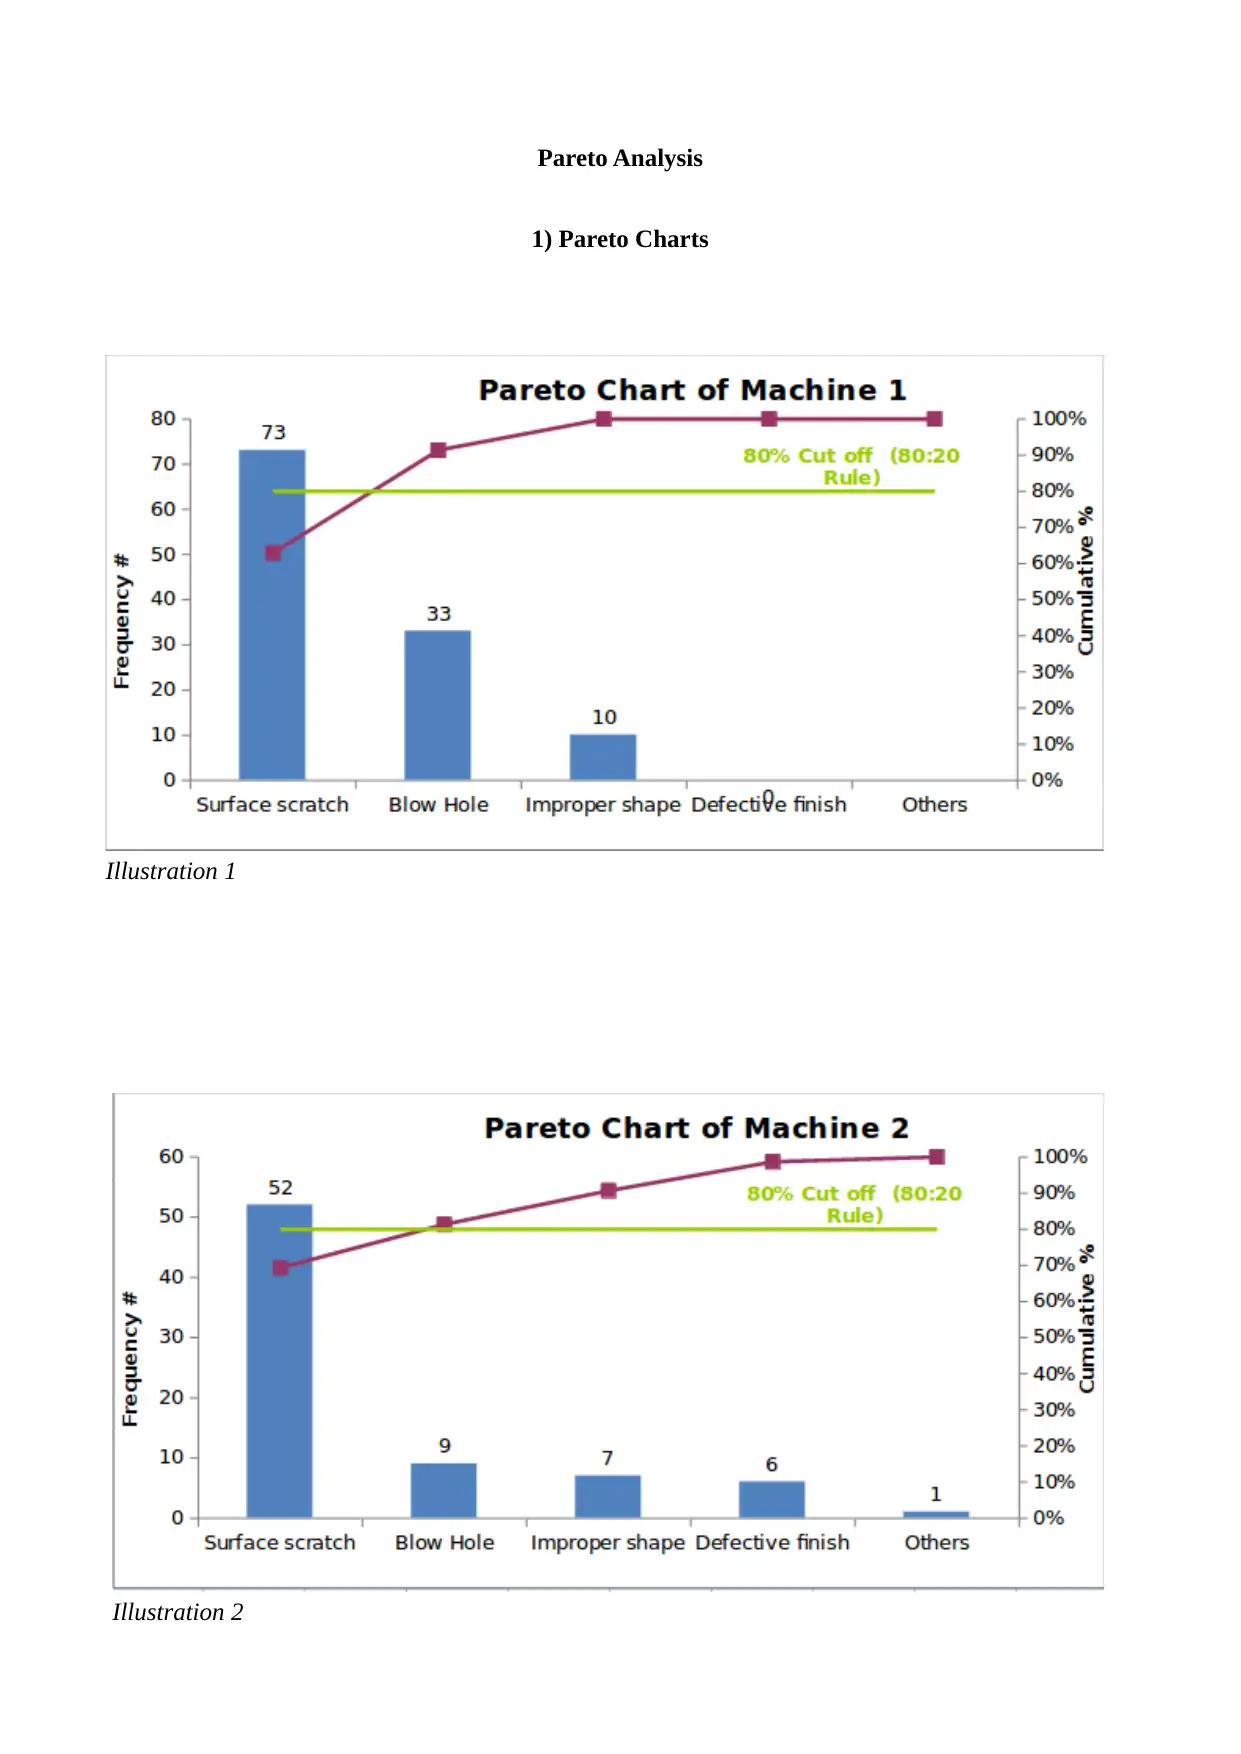
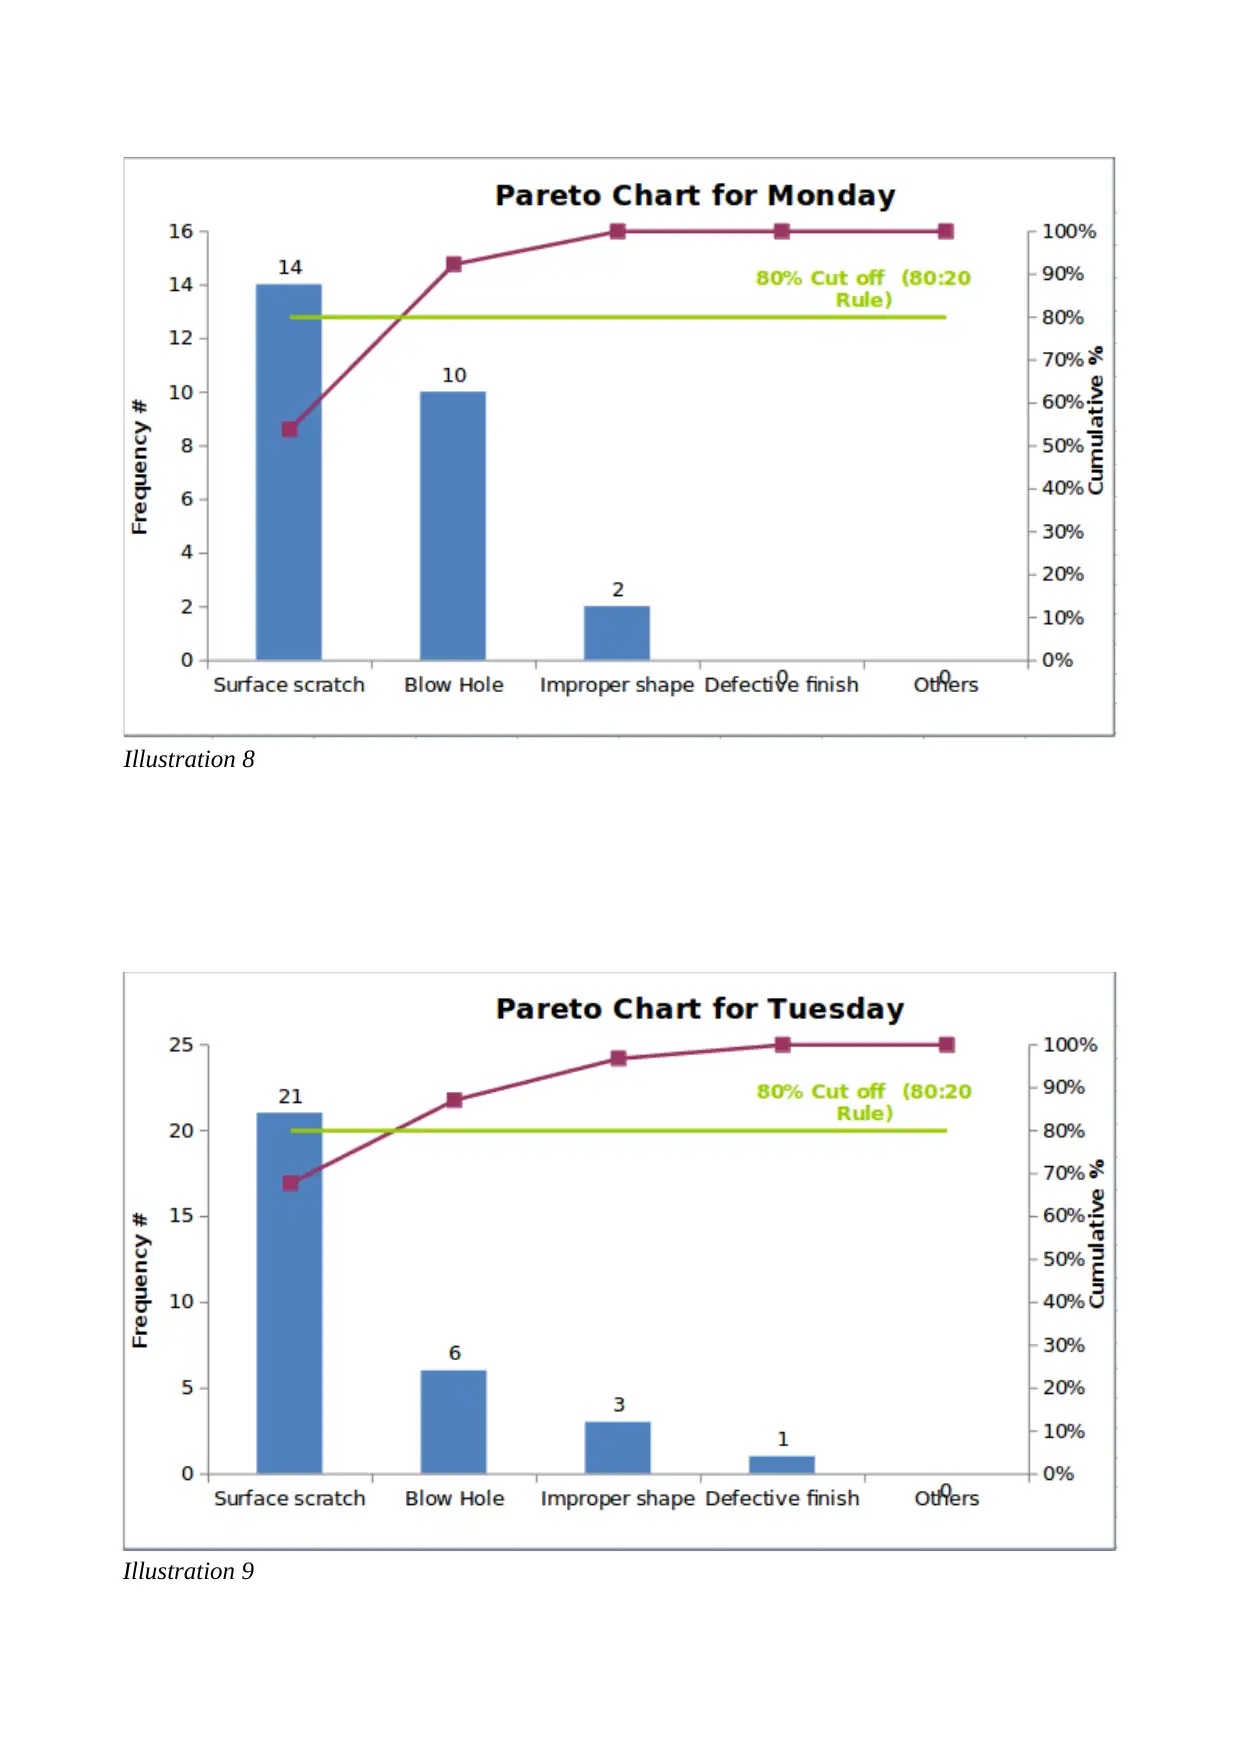
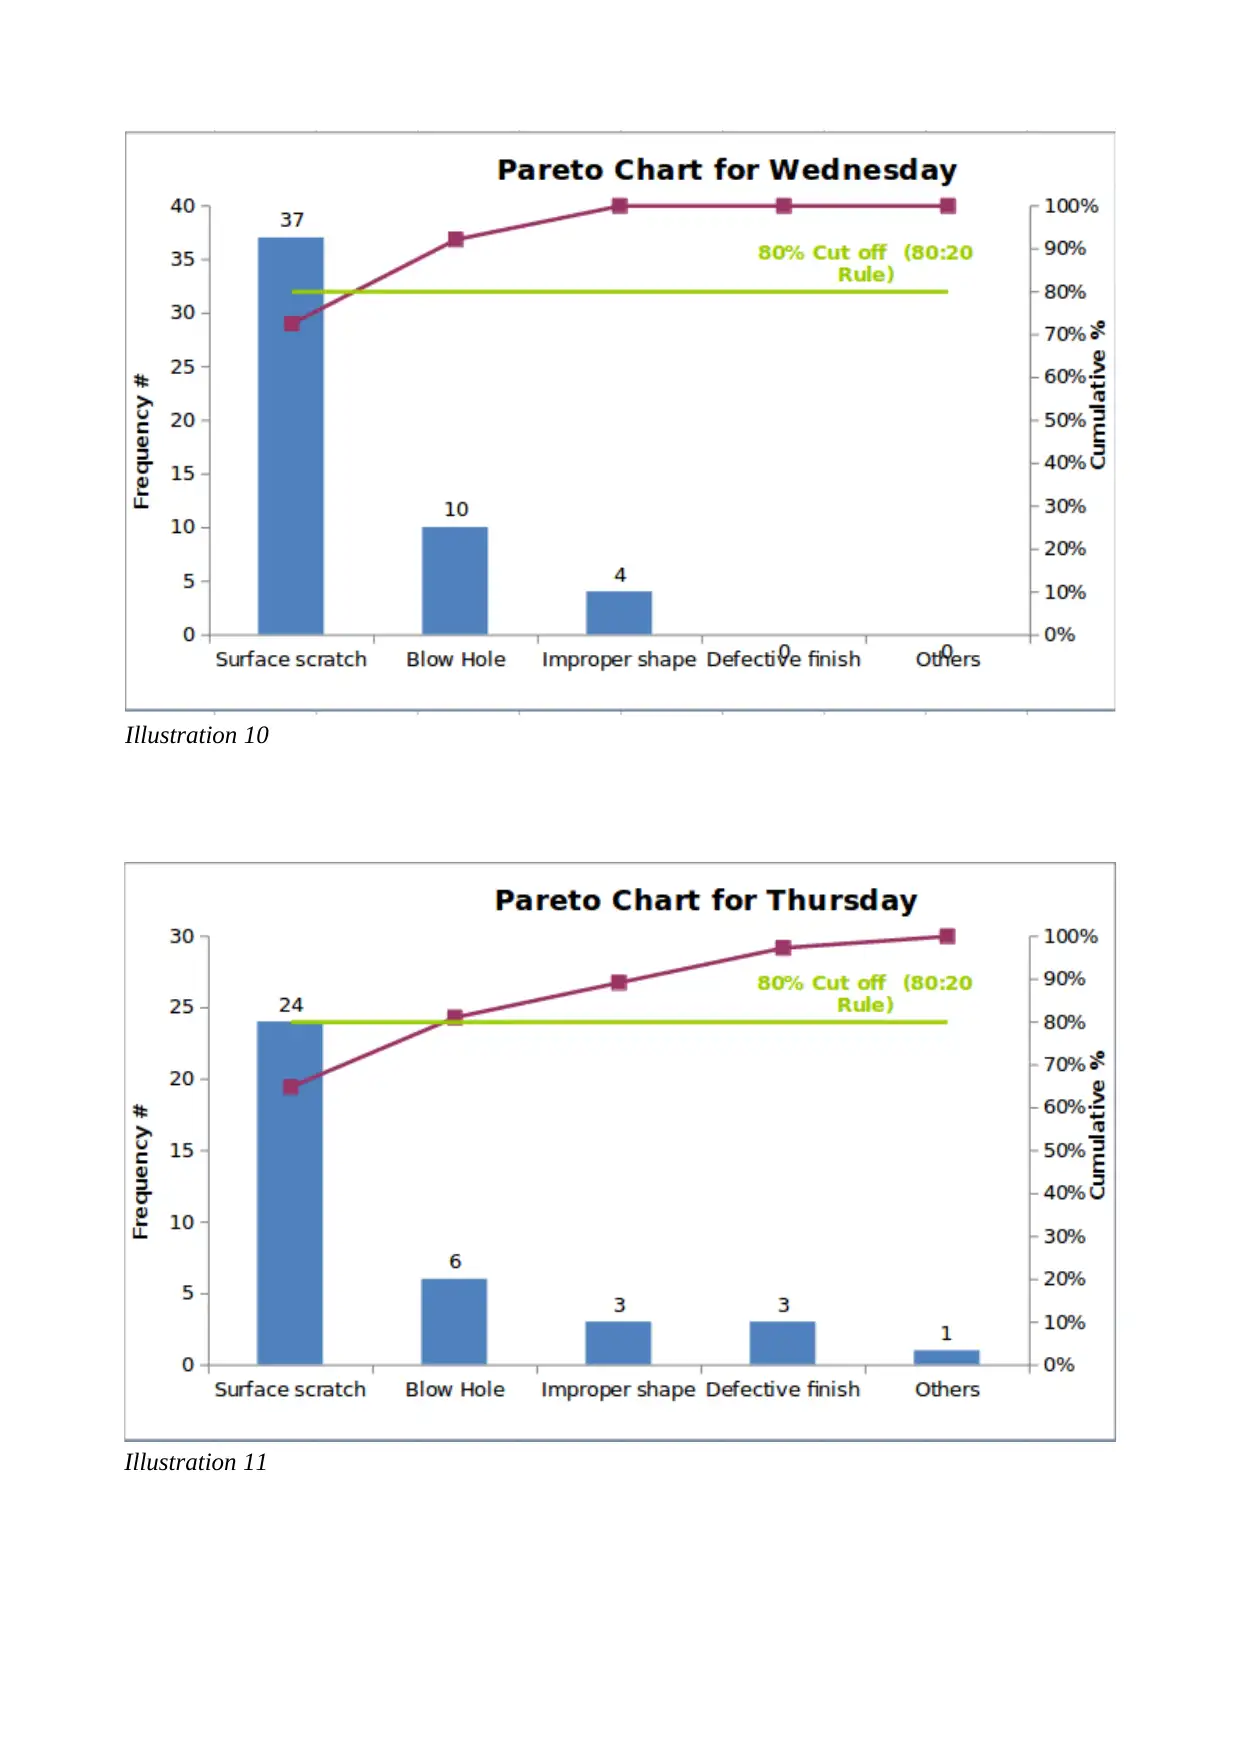
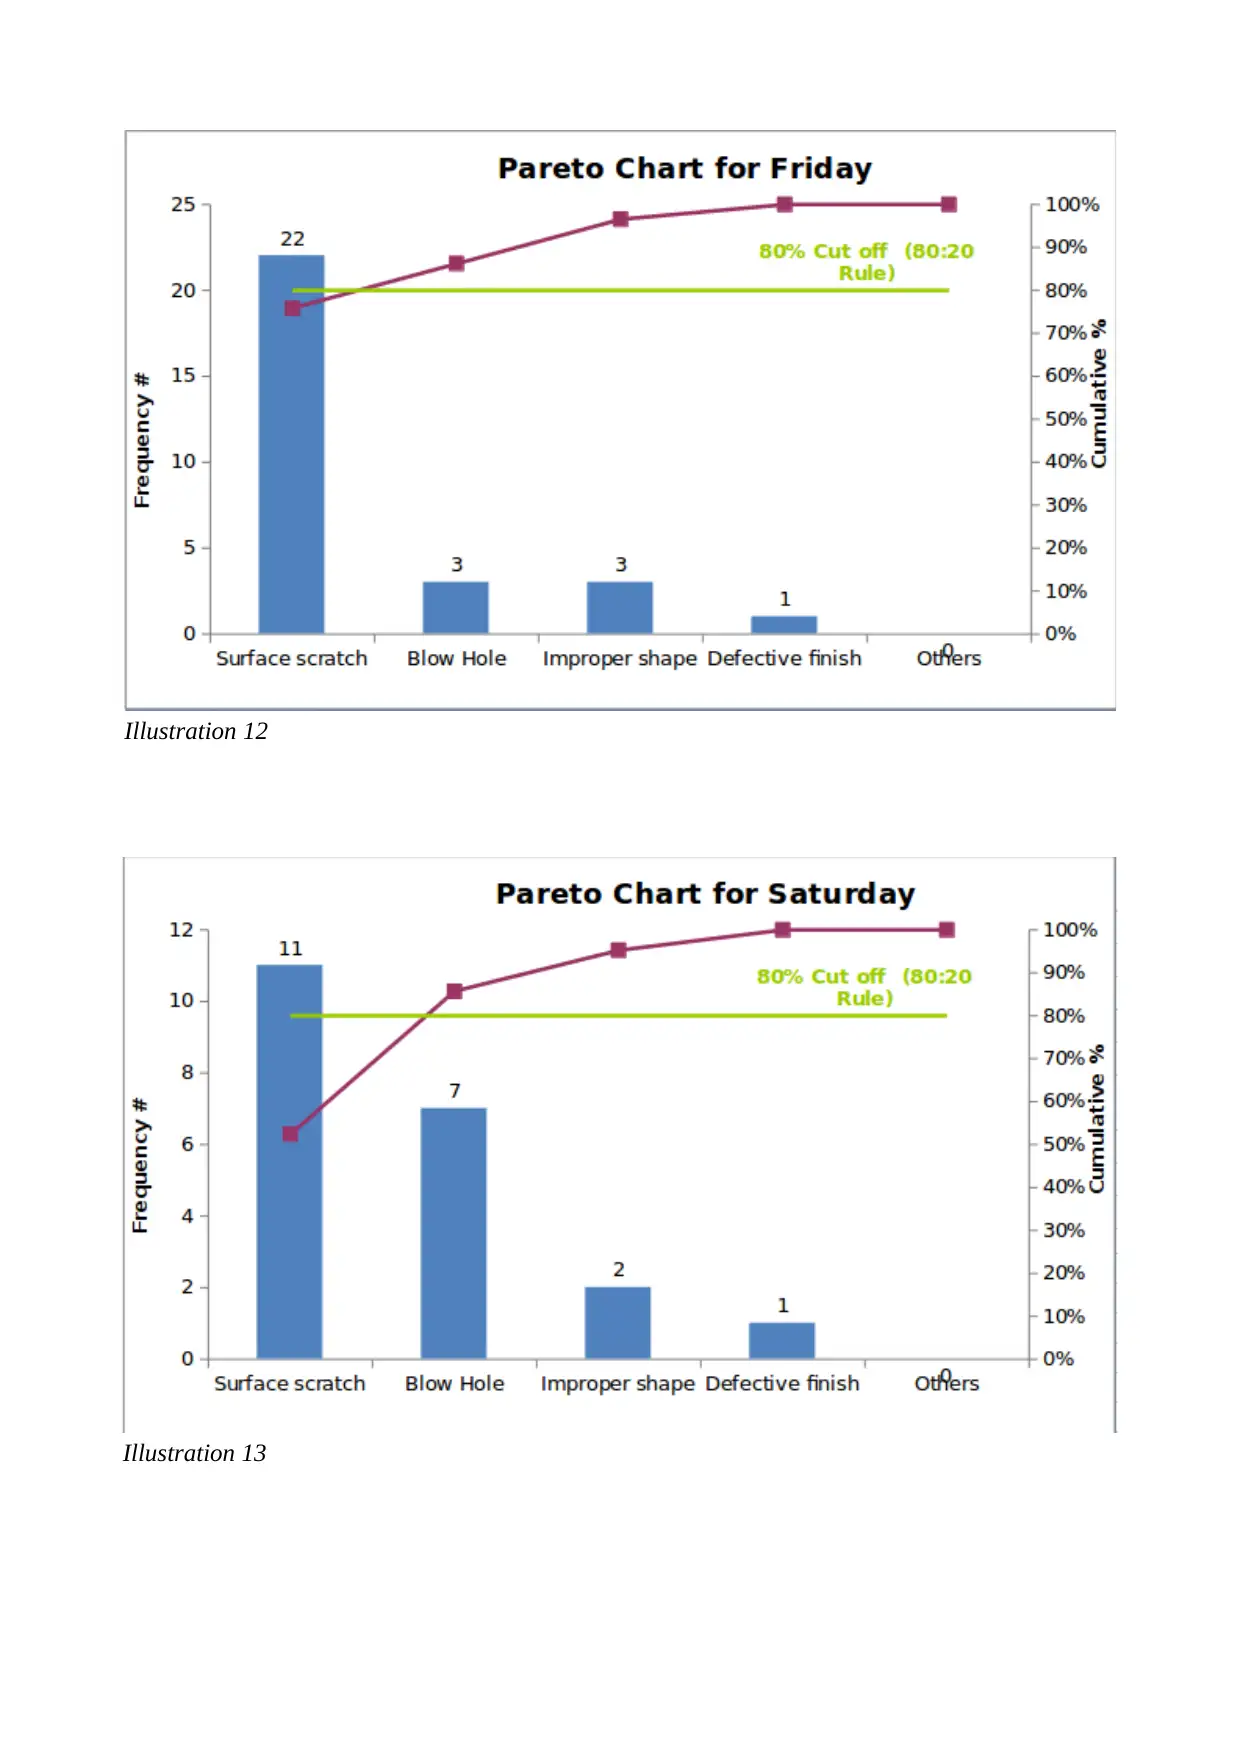
This report provides a comprehensive analysis of manufacturing problems at Hot Drip Galvanizing Ltd, focusing on data-driven insights and practical recommendations. The study uses Pareto analysis to identify the primary issue: surface scratches on finished products, which is found to be the main problem across all classifications, including machines, workers, and time periods. The report recommends focusing efforts on eliminating these scratches, suggesting the use of cause and effect diagrams and check sheets to pinpoint root causes. Furthermore, the report advocates for worker training, especially for worker B, and process improvements to reduce variability and enhance product handling. It also suggests the Six Sigma DMAIC approach to define, measure, analyze, improve, and control the manufacturing process, thereby enhancing quality control and customer satisfaction. The analysis emphasizes the importance of machine maintenance and setting up the machines correctly, especially in the morning to minimize defects. Overall, the report aims to provide actionable strategies for Hot Drip Galvanizing Ltd to improve its manufacturing processes and product quality.
Document Page
MSC LEAN AND MANUFACTURING & MSC ENGINEERING PROJECT
MANAGEMENT
Name
Date
tabler-icon-diamond-filled.svg

Secure Best Marks with AI Grader

Need help grading? Try our AI Grader for instant feedback on your assignments.
Document Page
Executive Summary
This report analyzed the observed problems in finished products at Hot Drip Galvanizing Ltd, based
on the supplied data. The data was collated and used to generate Pareto charts in various categories,
based on the machines, the workers, the days of the week, and morning and afternoon times when
production is done. The Pareto analysis identified the biggest problem as being scratches to surfaces
of the finished products in all the aspects of classification. Based on this information, it is
recommended that all (or most) efforts (80%) should focus on tackling the issue of eliminating
surface scratches. The recommendation is to use other tools to identify the exact causes for the
surface scratches, and also to reduce variability in quality between the machines as one machine
was identified to be responsible for more problems than the other. The workers also need training,
particularly worker B who was culpable for most of the identified problems. Another
recommendation is to improve the product handling process at each stage. The tools recommended
for use in helping solve the problem include the cause and effect diagram, and the check sheet. The
cause and effect diagram will evaluate the 6Ms relevant to manufacturing: these include methods,
machines, materials, measurements, mother nature, and manpower. The tool is useful in identifying
the root causes for the surface scratches to finished products. The check sheet entails developing a
sheet showing the frequency of occurrence of the problem over a six week period and helping
narrow down to the problem causes. The Six Sigma approach based on DMAIC can also help solve
the manufacturing problems at Hot Drip Galvanizing Ltd, following the steps of defining issues,
measuring current processes, analyzing the collected information, looking for solutions to make
improvements, and controlling he process
Document Page
Table of Contents
Executive Summary..............................................................................................................................2
Introduction..........................................................................................................................................4
Pareto Analysis.....................................................................................................................................5
1) Pareto Charts....................................................................................................................................5
1) Analysis of Findings.......................................................................................................................17
3). Suggested Tools to Solve the Problems at Hot Dip Galvanizing Ltd...........................................17
4). Six Sigma DMAIC Approach in the Hot Dip Galvanizing Ltd Case...........................................20
References…………………………………………………………………………………………..23
Illustration Index
Illustration 1.........................................................................................................................................5
Illustration 2.........................................................................................................................................5
Illustration 3.........................................................................................................................................6
Illustration 4.........................................................................................................................................7
Illustration 5.........................................................................................................................................8
Illustration 6.........................................................................................................................................9
Illustration 7.........................................................................................................................................9
Illustration 8.......................................................................................................................................10
Illustration 9.......................................................................................................................................11
Illustration 10.....................................................................................................................................12
Illustration 11.....................................................................................................................................12
Illustration 12.....................................................................................................................................13
Illustration 13.....................................................................................................................................14
Illustration 14.....................................................................................................................................15
Illustration 15.....................................................................................................................................16
Illustration 16.....................................................................................................................................16
Document Page
Introduction
The goal of manufacturing processes is to provide products and solutions that add value to the
customer, and in the process, make a profit. For many organizations involved in manufacturing, the
goal is to have zero defects and fully satisfy customer needs. However, this is usually not the case,
there are variabilities in finished products, that due to quality control measures, are considered
rejects or wastes (Badiru & Thomas, 2009). Such wastes increase costs and reduce margins for
organizations. Various tools are available with which manufacturers can reduce and eliminate
problems, and constantly monitor the processes to attain continuous improvements and customer
satisfaction. This paper evaluates Hot Drip Galvanizing Ltd, a company experiencing some
problems in its finished products. The paper uses the Pareto analysis method to evaluate the
provided data and identify the main problems and then makes recommendations on how to make
improvements. Further, the paper proposes additional methods of using the cause and Effect
diagram and a check sheet to help eliminate problems in finished products. The paper ends by a
discussion of how Six Sigma can be applied, based on DMAIC, to solve the problems faced by the
company.
tabler-icon-diamond-filled.svg

Secure Best Marks with AI Grader

Need help grading? Try our AI Grader for instant feedback on your assignments.
Document Page
Pareto Analysis
1) Pareto Charts
Illustration 1
Illustration 2
Document Page
Overall, machine 1 contributes most of the problems experienced at the facility, with the highest
count of the total experienced problems at 116 for 60.75 of the problems, while machine 2
contributes a total count of 75 of the problems, representing 39.3% of the total. For both machines,
the biggest problem area is surface scratches to the finished product, which account for more than
80% of the problems in all machines (88%). Blow holes is the next major problem, at 40% for
machine 1 and just 14% for machine 2. The rest of the problems (improper shapes and defective
finish, and others are not significant problems, being below 20% for both machines. Looking at the
charts, the graphs show that surface scratches are the biggest contributors to the manufacturing
problems: the cumulative line is also rising steeply towards the right, showing that the problems
represented by bars on the left side are the biggest contributors to problems incrementally. 80% of
the problems are thus caused by surface scratches to the finished products for both machines, ad
machine 1 has the highest count of problems.
The cumulative problems due to workers show that Worker B is the biggest contributor to problems
in the finished products, accounting for more than 85% of all problems. The cumulative line is also
steep, showing that Worker B and A contribute to most of the problems. However, Workers A, C,
Illustration 3
Document Page
and D are also contributing to problems, though Worker A is the biggest cause of problems in
finished products.
Illustration 4
Illustration 5
tabler-icon-diamond-filled.svg

Paraphrase This Document

Need a fresh take? Get an instant paraphrase of this document with our AI Paraphraser
Document Page
Illustration 6
Document Page
Looking at each individual problem for each of the workers, the data shows that the biggest
problem for all the workers is surface scratches to the finished products, contributing to over 80 of
all the problems, so this is the main problem area.
Illustration 7
Document Page
Illustration 8
Illustration 9
tabler-icon-diamond-filled.svg

Secure Best Marks with AI Grader

Need help grading? Try our AI Grader for instant feedback on your assignments.
Document Page
Illustration 10
Illustration 11
Document Page
Illustration 12
Illustration 13
Document Page
For the days of the week, the surface scratch problem is the biggest contributor to faulty finished
products for all the days, contributing more than 80% of problems for problems experienced each
and every day. Cumulatively for all the days though, Tuesday is when most problems are
experienced with 86% of all the manufacturing problems.
Illustration 14
tabler-icon-diamond-filled.svg

Paraphrase This Document

Need a fresh take? Get an instant paraphrase of this document with our AI Paraphraser
Document Page
Illustration 15
Illustration 16
Document Page
1) Analysis of Findings
Cumulatively, more problems are experienced during the morning hours, accounting for 67% of all
the problems, while fewer problems are experienced during the afternoons, accounting for 33% of
all problems. Based on the analyses and the shapes of the bars and the curves, the Pareto charts give
a clear indicator of what the problem areas are, with surface scratches being the biggest cause of
problems for finished products in the context of the time of work, the days, the machines, and the
workers. Further, the worker B is the biggest contributor for the problems. With this information,
the problems at the Hot Dip Galvanizing company can be solved by placing a greater focus on the
80% of the causes of the problems (Almagro, 2013). That is, 80% of the effort should be focused on
the cause of 80% of the problems (Rathore, 2012). The solutions should focus on how to improve
the surface scratch problem, which are likely caused by poor handling where the zinc galvanizing is
not sufficiently dry and fixed on the steel, leading to the scratches. The company should therefore
use a production methodology in which the entire galvanization process is done according to
standards. For instance, the pickling phase should be done throughly to remove all mil scale from
the steel bars.
The next process should entail applying sufficient flux to prevent oxidation of the steel surfaces
after cleaning. The process of handling and cooling the steel in the quench bath should be controlled
strictly and with the greatest care to ensure the zinc and metal cool at the required pace and
temperature, and for a sufficient time duration, before being removed and be ready for use/ shipping
(Pernicova, Dobias and Pokorny, 2017). This is because it is possible the zinc coating and the steel
is not allowed to cool sufficiently, and is further handled carelessly, resulting in the scratches (Hou
et al., 2008). Given that machine A is causing most of the problems, efforts should be placed at
servicing it as required, with repairs and parts replaced to ensure it is working optimally (Hossen,
Ahmad and Ali, 2017). Worker B is a significant contributor to the problems with the finished
products, and some additional training on how to handle the materials during the galvanization
process will help reduce the total number of defects. Further, most of the problems are experienced
during morning hours, implying that either the machines are set up in a hurry or they are not set up
properly; for instance, the reagents need to be heated for a longer period as the data shows that in
the afternoons, fewer problems are experienced, possibly because the machines are hot enough and
work optimally. Setting the machines up properly such as turning the haters much earlier can help
reduce the main problem, mainly the surface scratch problem.
3). Suggested Tools to Solve the Problems at Hot Dip Galvanizing Ltd
The tools to use are chosen form the 7 basic Tools of Quality management; for this case, there is
need to know the cause and the effects of the problems and have a checklist (Kang and Kvam,
Document Page
2012). As such the two quality control tools to be used include the cause and Effect Diagrams and
the Check-sheet
Cause and Effect Diagram
The Cause an Effect Diagram (also known as the Ishikawa Diagram) is a quality management tool
used to examine the cause of problems or issues or what may happen and it works by having the
causes organized into smaller categories. The tool is also effective in identifying the relationships
between factors contributing to the problems (Saeger, Feys and Probert, 2015). In the Hot Dip
Galvanizing case, the Ishikawa diagram will be particularly useful in helping identifying the causes
of the problems, particularly that of surface scratches in the finished products. To use the tool, the
main problem (in this case the surface scratches) is written on the right edge of a page (at the
halfway mark). A line is then drawn towards the left, starting from the edge to form the backbone of
the diagram. Next, angles lines are drawn from both sides of the spine to create a somewhat ‘fish
bone’ diagram. After drawing the diagram, the possible causes for the problems are then analyzed;
in the manufacturing sector such as for the case under study, the 6Ms are considered to determine
the cause of the main problem (Simon, 2018). The 6Ms include methods, machines, materials,
measurements, mother nature, and manpower.
Methods: In evaluating the methods, the process (Lau, 2018)s will be checked to establish if
appropriate and well written training materials and guidelines are in place. Regulations will also be
evaluated to see if any cause unnecessary steps or slow downs. The methodology in manufacturing
should be standardized and all employees trained to be able to apply the methods effectively
(Paladno, 2013).
Machines: The machines used in production should be evaluated to establish if they have any issues
to do with operation, functionality, and requirements for servicing or spare parts. Further, the
capacity of the machine will be evaluated to establish if its suitable for its workload, or is there are
problems with its operation. As the analysis, shows, one machine is responsible for significantly
more problems (machine 1) compared to the other machine (Paladno, 2013)
Materials: The materials used in the galvanizing will also be evaluated to ensure they meet the right
standards, are used properly and appropriately: a major problem at the company is scratches on the
surfaces of the finished products. It should be evaluated is these are caused by inappropriate
materials use, such as not heating the zinc solution to the required temperatures, wrong procedures
during colling, or if the materials are not handled as required (Douglas, 2009).
Measurements: The measurements for the materials, including the chemical quantities will be
evaluated, as well as time measurements and temperature measurements to ensure there are no
errors causing the observed problems. For instance, the measurements may be inconsistent as there
are periods when there are significantly more problems (in the morning) than in the evening.
tabler-icon-diamond-filled.svg

Secure Best Marks with AI Grader

Need help grading? Try our AI Grader for instant feedback on your assignments.
Document Page
Mother nature (environment): This relates to the operating environment, such as the level of
moisture, humidity levels, or temperatures, because the results show, for instance, that the mornings
experience more defects in the products compared to the afternoons. Usually it is colder and humid
during mornings than afternoons, so this area will have to be evaluated.
Manpower: Some workers, for instance, worker B, is responsible for most of the problems with the
finished products. Issues to be checked will include whether the manpower is sufficient for the tasks
they have been allocated. Issues such as worker training and competence will be evaluated, as well
as their motivation levels and whether a specific position is creating bottlenecks observed at the
workplace (Douglas, 2009).
The cause and Effect Diagram, when complete, using the parameters discussed above will look like
what is shown below;
Further, other factors can also be investigated to ensure problem causes are identified and dealt
with. The other categories that will be evaluated include maintenance and management. Once the
causes have been identified, the lateral branches wit details can be extended further with horizontal
running lines to get to the root cause of the problems. Based on these, then suitable solutions are
developed, for instance, is the mother earth is causing the observed variations in defects between
morning and afternoon hours, then the environment at the factory can be adjusted. If handling and
training is the problem, then these can be focused on to solve the major problem (surface defects0
causing 80% of the total problems (Antony, Gijo and Childe, 2011).
Check Sheet
This is a quality management document that is used for data collection in real time at the location
from where the data is generated. The check sheet can capture either quantitative of qualitative data/
Document Page
information (Dhillon, 2008). For quantitative data, the resulting document is called a tally sheet.
The check sheet is suitable for this case because the data can be collected by the same person
repeatedly and from the same location. Data should be collected at all the steps in the galvanizing of
the steel materials. The check sheet is also suitable because the data on the defects need to be based
on frequency of occurrence and their patterns. Given this is a production process, the check sheet is
a particularly suitable tool to use. In using the check sheet to improve the problems experienced at
Hot Dip Galvanizing, the following procedure will be followed;
A decision will be made on the time to observe the event/ problem; or instance, for the surface
scratches, it is important to follow and record the particular point in the manufacturing process
where the process is experienced.
A decision will be made on when to collect the data and the duration; for instance, the data can be
collected hourly every data and for a period of six weeks.
The form is then designed and set up in a way that data can be collected end entered into the
document easily.
The check sheet is then labeled and tested and data recored on it (Duffy, 2013).
On the check sheet, the number of finished products with surface scratches will be recorded in the
check sheet and the location of the defects identified. For instance, for the company in question, do
the defects occur in a specific machine mostly? Where during the production process do the defects
occur. Knowing the physical location is located is important in knowing where the problems are
likely to occur. The check sheet will then be used to determine the number of defects identified for
each production run, each time of production, and the location of production. Once the area where
most defects are seen is located, then it is easy to identify the problem. The frequency of the
observed defects will then be identified for each location and stage during the production, then the
causes of the problems will be zeroed in on. For instance, the surface scratches may be common at a
specific hour or due to a specific worker, or even at a specific machine. The frequency check sheet
will determine the area where most problems are experienced and then make it easy to identify and
solve the problem.
4). Six Sigma DMAIC Approach in the Hot Dip Galvanizing Ltd Case
Six Sigma refers to a set of techniques and practices used to improve processes: it is useful in
improving the finished products quality by identifying and removing the causes for defects and
errors. It also helps to improve the finished product quality by reducing variances in the process of
production (manufacturing). The goal of Six Sigma is to reduce defects during manufacturing to
3.4 or less defects for every million products. Six Sigma involves five main activities namely:
define, measure, analyze, improve, and control (Basu, 2011). The Six Sigma using the DMAIC
Document Page
approach is a tool that uses statistical analyses to identify issues causes quality problems and slow
down the process of manufacturing. Six Sigma is primarily used in the manufacturing field and is
mainly used to identify problem causes. Six Sigma identifies problems and issues within the
manufacturing process based on the DMAIC framework (identify, measure, analyze, improve, and
control). The first step in using Six Sigma entails defining goals. For the case study, the goal can be
defined as reducing surface scratches problems to less than 3.4 parts for every million steel rods
produced. The identify phase also helps in identifying the key stakeholders in the production
process as well as identifying the design and process goals to meet the needs of stakeholders. The
stakeholders must be clearly identified and defined: for instance, these could be the end users of the
products (the customers), the workers, the process owners, suppliers, and managers (Carrol, 2016).
The definition also entails (in this case) reducing variability in the finished products between the
machines and employees and attain uniformity in production. Specif goals are then set, such as the
accepted number of defective parts, reducing costs, reducing machine variability, and reducing
errors by workers. When this is done, the objectives will help guide on what information is to be
gathered: information gathering is the second step in applying Six Sigma based on the DMAIC
approach. The gathering of data can be aided by using the previously discussed tools such as the
cause and effect diagram and the check sheets. This will help collect as much useful information as
is necessary to help develop solutions. Te gathered data is then analyzed using various tools in oder
to identify where interventions are needed. The Pareto charts, for instance, helped identify the
biggest contributors to problems in finished products so the analysis can be started from this point
and from data collected about the manufacturing process. The measurement process entails
evaluating present processes relating to the defects and problems in the finished products at the
factory. After the analysis suitable solutions are formulated, such as better maintenance for the
machines, training the workers better, using the right materials and procedure during the
galvanization process, making accurate measurements for materials, and improving handling
practices. The improvement process focuses on finding suitable solutions and actions that can lead
to improvements and eliminate the identified root causes for problems. Once the interventions are
put in place and improvements observed, the next phase is to control the entire production system
and constantly monitoring the situation, while making modifications to the solutions as necessary.
Apart from improving the manufacturing problems at the company, applying the Six Sigma
approach can also help achieve other benefits, including lean manufacturing, waste reduction, and
achieving improvements in environmental factors, such as better control of the working
environment and reduced emissions.
tabler-icon-diamond-filled.svg

Paraphrase This Document

Need a fresh take? Get an instant paraphrase of this document with our AI Paraphraser
Document Page
References
Almagro, L., Llabres, X. and Cintas, P. (2013). Industrial statistics with minitab. Hoboken, N.J.:
Wiley.
Antony, J., Gijo, E. and Childe, S. (2011). Case study in Six Sigma methodology: manufacturing
quality improvement and guidance for managers. Production Planning & Control, 23(8), pp.624-
640.
Badiru, A. and Thomas, M. (2009). Handbook of military industrial engineering. Boca Raton: CRC
Press.
Basu, R. (2011). Fit sigma: a lean approach to building sustainable quality beyond Six Sigma.
Chichester, UK, Wiley
Carroll, C. T. (2016). Six Sigma for Powerful Improvement: A Green Belt DMAIC Training System
with Software Tools and a 25-Lesson Course. Boca Raton, Florida. Productivity Press
Dhillon, B. S. (2008). Reliability technology, human error, and quality in health care. Boca Raton,
CRC Press.
Douglas, A., Middleton, S., Antony, J. and Coleman, S. (2009). Enhancing the Six Sigma problem-
solving methodology using the systems thinking methodologies. International Journal of Six Sigma
and Competitive Advantage, 5(2), p.144.
Duffy, G. L. (2013). The ASQ quality improvement pocket guide basic history, concepts, tools, and
relationships. Milwaukee, Wisconsin, ASQ Quality Press.
Furterer, S. L. (2016). Lean Six Sigma in Service: Applications and Case Studies. Boca Raton,
Florida. CRC Press
Hossen, J., Ahmad, N. and Ali, S. (2017). An application of Pareto analysis and cause-and-effect
diagram (CED) to examine stoppage losses: a textile case from Bangladesh. The Journal of The
Textile Institute, [online] 108(11), pp.2013-2020. Available at:
http://www.ijmer.com/papers/Vol3_Issue6/CE3637003715.pdf.
Hou, Y., Zhang, W., Yu, Z. and Li, S. (2008). Selection of tool materials and surface treatments for
improved galling performance in sheet metal forming. The International Journal of Advanced
Manufacturing Technology, 43(9-10), pp.1010-1017.
Kang, C. and Kvam, P. (2012). Basic Statistical Tools for Improving Quality. Chicester: Wiley.
Lau, J. Y. F. (2015). An introduction to critical thinking and creativity: think more, think better.
Hoboken, N.J., John Wiley & Sons.
Paladino, B. (2013). Corporate performance management best practices: a case study approach to
accelerating CPM results. Hoboken, N.J, Wiley.
Document Page
Pernicova, R., Dobias, D. and Pokorny, P. (2017). Problems Connected with use of Hot-dip
Galvanized Reinforcement in Concrete Elements. Procedia Engineering, [online] 172, pp.859-866.
Available at: https://ac.els-cdn.com/S1877705817305921/1-s2.0-S1877705817305921-main.pdf?
_tid=378cf97c-6f19-429f-812a-
67d30c3f916e&acdnat=1522151967_12d143d23b7876042e25087108542b65 [Accessed 27 Mar.
2018].
Rathore, A. (2012). Process validation in manufacturing of biopharmaceuticals. 3rd ed. Boca
Raton, Fla: CRC.
Saeger, A., Feys, B. and Probert, C. (2015). The Ishikawa diagram. [Place of publication not
identified]: 50Minutes.
Simon, K. (2018). The Cause and Effect (a.k.a. Fishbone) Diagram. [online] Isixsigma.com.
Available at: https://www.isixsigma.com/tools-templates/cause-effect/cause-and-effect-aka-
fishbone-diagram/ [Accessed 27 Mar. 2018].
chevron_up_icon
1 out of 21
circle_padding
hide_on_mobile
zoom_out_icon
[object Object]