Developing a Business Intelligence System for Lancaster Hotel
VerifiedAdded on 2023/04/24
|12
|3171
|99
Report
AI Summary
This report details the design of a business intelligence (BI) system for decision support at Lancaster Hotel & Spa, focusing on leveraging information and communication technology for competitive advantage. It explores the information value chain and how BI tools can enhance decision-making across various organizational levels. The report includes a data flow diagram (DFD) illustrating system processes like customer information and reservation management, and an entity-relationship diagram (ERD) for data management, showcasing relationships between entities like rooms, guests, and bookings. Additionally, time series analysis is applied to forecast hotel occupancy and revenue, particularly during peak seasons, using historical data. RapidMiner is mentioned as a tool for uncovering patterns in large datasets, ultimately aiming to improve hotel operations and revenue management through informed, data-driven strategies.

Introduction
Information and communication technology and information science are becoming increasingly
important and prevalent in business because of the age of digitalization and digital transformation.
Picot and Loebbecke (2015).
Companies must have access to timely, high-quality information to gain a competitive edge in the
modern business environment. To achieve well-informed tactical and strategic decisions, managers
require precise information. According to Alzghoul et al. (2022), companies all over the world invest
in and use business intelligence systems to meet their knowledge demands. Alzghoul et.al (2022)
Technology capabilities to assist decision-making with trustworthy information and analytical insights
are provided by business intelligence. Buxmann and Kowalczyk (2015)
Organizations may use information to grow better, perform wiser, and make better choices. The
information value chain, which is the method used to extract value from information and information
from data, is at the centre of business intelligence. Top management in organisations of all sizes may
use BI to make well-informed decisions concerning everything from long-term company plans to
marketing, research and development, and/or financing. Data may be used in business intelligence to
generate worth. It focuses on data discovery and the potential applications of information. .Bhatiasevi
(2018)
BI tools are programmes and other products that enable users to build queries, carry out data analysis
using techniques including online analytical processing (OLAP), data mining, statistical analysis, and
forecasting. Bhatiasevi (2018). As well as connecting BI with specialised databases that already exist
in the form of data warehouses and data marts, many types of reports may also be produced using BI.
Elbashir et.al (2008).
Along with a competition, BI offers businesses several additional advantages, like precise and timely
data reporting, improved decision-making skills, improved customer service, higher revenue, and cost
reductions in non-IT sectors. Many companies, including SAS, IBM, Microsoft, Qlik, Oracle, Tableau,
and Hadoop, offer business intelligence (BI) technologies. Bhatiasevi (2018)
Here we are going to design the business intelligence system for decision support for Lancaster
hotel and spa.
Lancaster hotel and spa meeting a point of modern design which is situated on the site of
Brunel University. It is located just 20 minutes from Uxbridge station and 5 mile from
Heathrow airport. It consist of 70 high en-suits and 30 twin double rooms and 40 single
rooms. Each rooms have free view TV ,Tea and coffee making , free Wi-Fi ,Gym, 24hrs check
in .Lancaster also have La carte restaurant and modern bar & lounge .There are 3 fully
equipped luxury boardroom .There are spa which consists of steam room, sauna, plunge
pool and spa pool . In the present time there is a great rush in hotels, as these have become
the necessity for accommodation in new place. People stay or go to Lancaster hotel for
function ,meeting, and refreshments .
Paraphrase This Document
Need a fresh take? Get an instant paraphrase of this document with our AI Paraphraser

DATA FLOW DIAGRAM
Visually map your system or process so you can find areas for increased efficiency and
effectiveness. A data flow diagram will simplify any work, including system improvement and
new process implementation. Nym, (2022)
DFD Level 0
DFD Level 0DFD Level 0
An alternative term for it is a context diagram. It will be an abstract view with the system portrayed
as a single operation and external parties. Using incoming/outgoing indicators that display input and
output data, the whole structure is shown as a single bubble. Nym, (2022)
The system's contact with external entities is highlighted in the data flow diagram level 0 and the
diagram also views the entire system as a single operation. The rest of the system is shown as a
single process in the context diagram (level 0 DFD). Level 0 data flow diagrams show a single process
node and its connections to external entities. In DFD Level 0, we may register a hotel in Lancaster,
where the administrator has full client information as well as confirmation of the reservation,
making their duty easier because they know who made the reservation for which day. Nym, (2022)
DFD Level 1

The key sub-processes that make up the whole system are all listed in the System level 1 DFD. One
way to conceptualise a level 1 DFD is as a "detonated perspective" of the context diagram. Level 0
data flow diagrams show a single production node and the relationships between it and outside
entities. While level 1 DFDs are more in-depth than context diagrams, they nevertheless offer a
general perspective. In a level 1 data flow diagram, the context diagram's single process node is
divided into sub processes. Nym, (2022)
It is quite apparent and simple to see how Lancaster may utilise customer information management,
reservation records management, reservation status monitoring, and transaction management
between user and admin as shown in DFD Level 1. And it was simple for the consumer to get all the
booking information. Nym, (2022)
The created graphic depicts four distinct situations. The first source of data is the hotel staff, guests,
and administration. The system then accommodates the transaction. This concept was inspired by the
Lancaster hotel booking procedures. Nym, (2022)
Here we are going to do essential data management of Lancaster hotel and spa using ENTITY
RELATIONSHIP DIAGRAM
In Lancaster hotel entities can be consider room , room type , guest , booking bill , employee.
To create ERD we can consider following fact:
Number of rooms hotel have
How many rooms customers can reserve
How many beds each room contain what are the prices for room with extra beds .
Hotel consist of 70 high specification en-suite bedrooms, 30 twin double rooms and 40 single rooms.
ROOMS
RESERVATION
GUEST
DATE
CHECK IN
GUEST NAME
ROOM TYPE
PRICE
VIEW NAME
PHONE NO
EMAIL
ADDRESS
way to conceptualise a level 1 DFD is as a "detonated perspective" of the context diagram. Level 0
data flow diagrams show a single production node and the relationships between it and outside
entities. While level 1 DFDs are more in-depth than context diagrams, they nevertheless offer a
general perspective. In a level 1 data flow diagram, the context diagram's single process node is
divided into sub processes. Nym, (2022)
It is quite apparent and simple to see how Lancaster may utilise customer information management,
reservation records management, reservation status monitoring, and transaction management
between user and admin as shown in DFD Level 1. And it was simple for the consumer to get all the
booking information. Nym, (2022)
The created graphic depicts four distinct situations. The first source of data is the hotel staff, guests,
and administration. The system then accommodates the transaction. This concept was inspired by the
Lancaster hotel booking procedures. Nym, (2022)
Here we are going to do essential data management of Lancaster hotel and spa using ENTITY
RELATIONSHIP DIAGRAM
In Lancaster hotel entities can be consider room , room type , guest , booking bill , employee.
To create ERD we can consider following fact:
Number of rooms hotel have
How many rooms customers can reserve
How many beds each room contain what are the prices for room with extra beds .
Hotel consist of 70 high specification en-suite bedrooms, 30 twin double rooms and 40 single rooms.
ROOMS
RESERVATION
GUEST
DATE
CHECK IN
GUEST NAME
ROOM TYPE
PRICE
VIEW NAME
PHONE NO
ADDRESS
⊘ This is a preview!⊘
Do you want full access?
Subscribe today to unlock all pages.
Trusted by 1+ million students worldwide

To create a very well database, data needs may be carefully analysed using the ER model. The ER
Model depicts actual people, things, and the connections among them. Before deploying your
database, it is recommended that you create an ER Model in a DBMS. Peterson, R. (2022)
ERD will assist the Lancaster Hotel in showcasing the entity model for the hotel management system.
The hotel management system's entity relationship diagram displays all the visual components of the
database table as well as the relationships between the rooms, payments, hotel, and customers,
among other things. The link between the structured data group of Lancaster hotel management
system features was defined using structure data. The hotel, rooms, services, payments, bookings,
and clients are the essential components of the hotel management system. Peterson (2022)
ACCESS
Paraphrase This Document
Need a fresh take? Get an instant paraphrase of this document with our AI Paraphraser
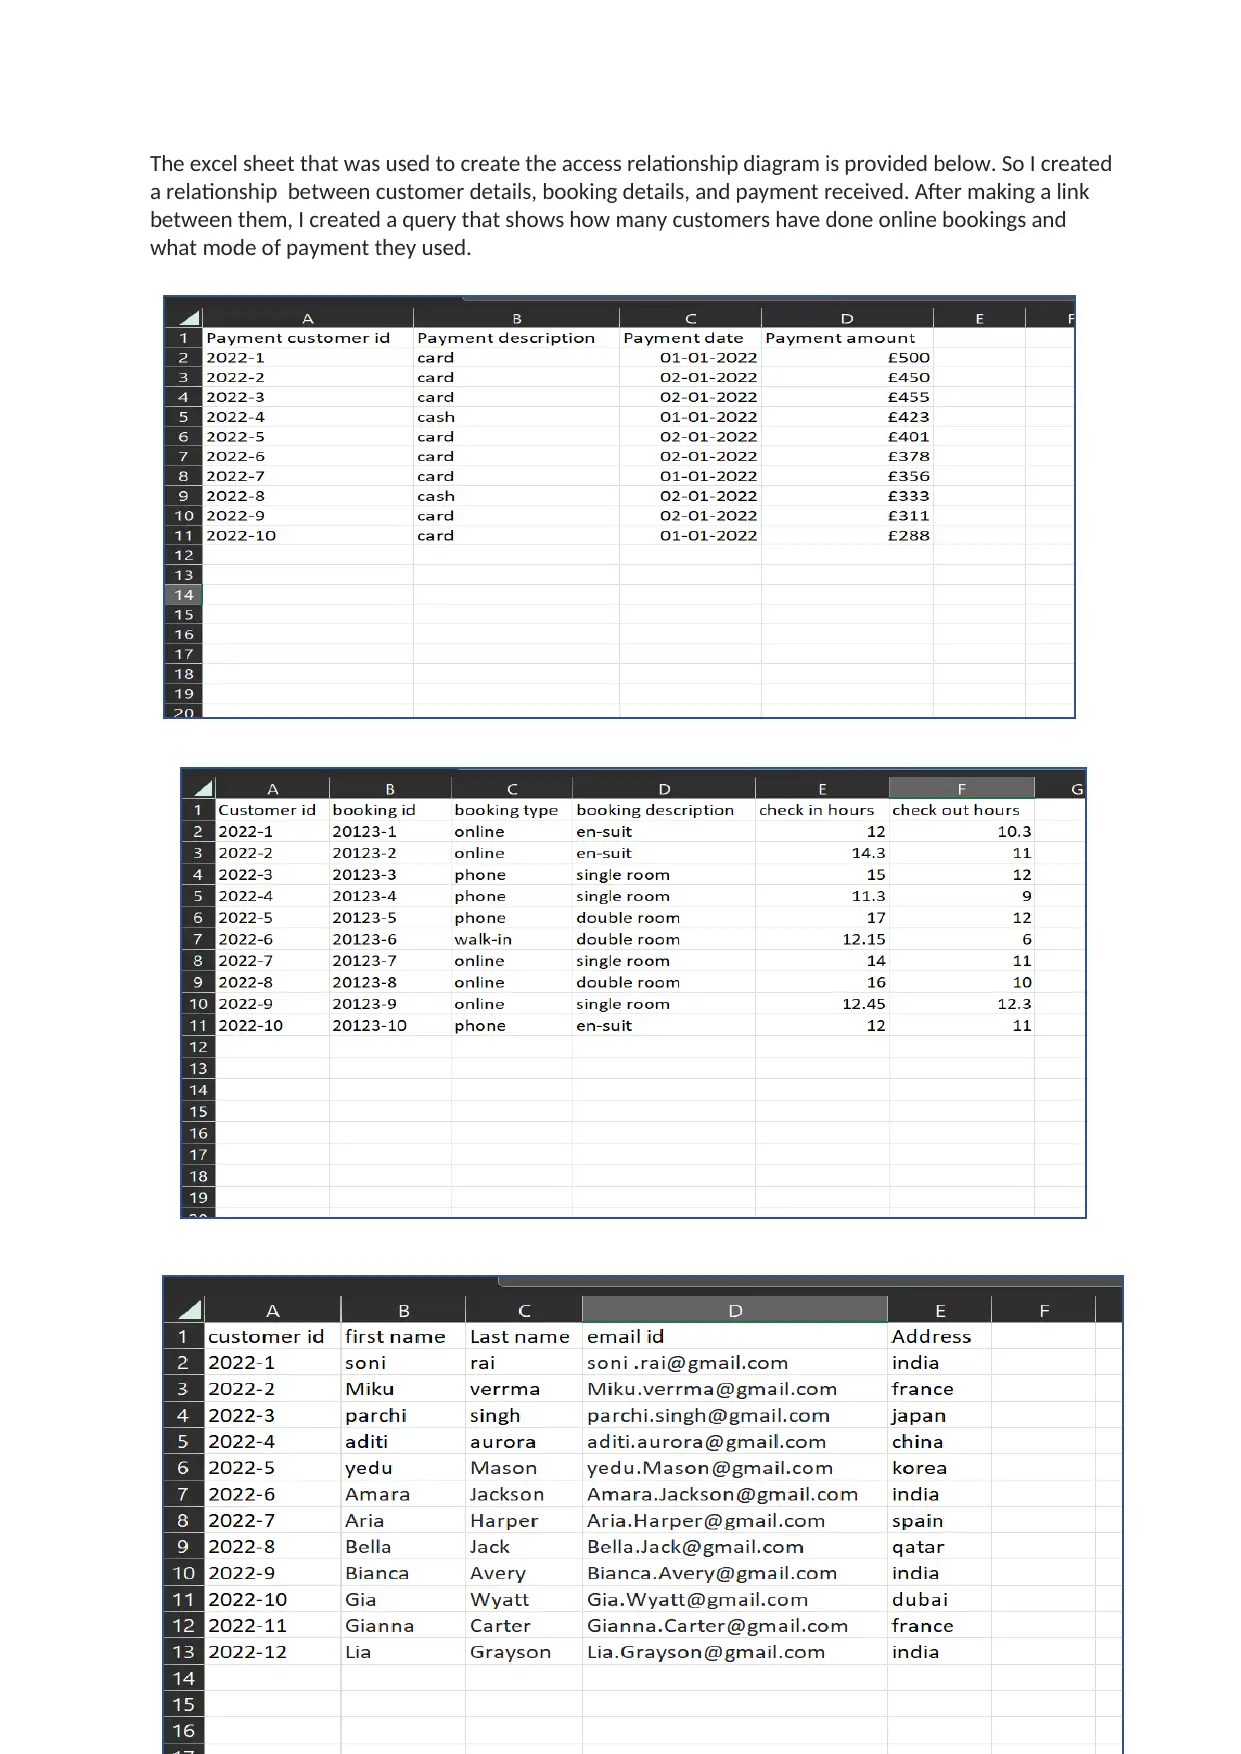
The excel sheet that was used to create the access relationship diagram is provided below. So I created
a relationship between customer details, booking details, and payment received. After making a link
between them, I created a query that shows how many customers have done online bookings and
what mode of payment they used.
76
a relationship between customer details, booking details, and payment received. After making a link
between them, I created a query that shows how many customers have done online bookings and
what mode of payment they used.
76

TIME SERIES ANALYSIS
Analytics based on time series use data observations that have been made throughout time at periodic
intervals. Time-ordered data's future values usually rely on previous findings. Therefore, methods that
may examine this reliance are of importance to time series analytics Box et al. (2015). Analytics based
on time series use data observations that have been made throughout time at regular intervals. Time-
ordered data's future values frequently depend on previous findings. In order to study this reliance,
time series analytics is engaged in certain methodologies Box et al. (2015)
Time series are prevalent both in data science and in daily life. Data that is accumulated over a
consistent course of time is, at its core, a time series. A time series can consist of any non-stationary
number that is reliant on time. We utilise time series data to identify fundamental patterns or trends
across time. No, M. (2022)
Any time series dataset can include one or more of the following four components:
1. Trend: An upward or downward movement in a series that is long-term and constant is
referred to be a trend. A trend, in contrast to seasonal fluctuation, is unanticipated and
difficult to spot. Predetermined trends are those for which we can identify the root reason,
whereas random trends are those for which we are unable to do so. Such a tendency would
be predictable, for instance, if a new author publishes a book and the book has astronomical
sales. No, M. (2022)
2. Cycle : A cycle is an upward and downward motion that surrounds a trend. A cycle is
unpredictable because it lacks an exact and equal amount of time between time periods,
unlike seasonal variance. No, M. (2022)
3. Seasonality: In contrast to a trend, seasonality describes fluctuations that happen with a set
and predictable regularity. For instance, ice cream sales increase in the summer since more
people are in the mood for a refreshing, sweet dessert when the weather is warmer. No, M.
(2022)
4. Irregularity: Also known as noise, irregularity is what remains after seasonality and patterns
have been removed from the dataset. Unpredictable and random phenomena are
irregularities. Price movements in stocks are a classic illustration of erratic variations. No, M.
(2022)
Time series analysis often entails tracking data points together with all of their fluctuations over a time
frame. Researchers may utilise historical data to draw informed conclusions about activity across
industries, such as business, banking, real estate, and retail, and then apply that knowledge to future
decisions (also known as time series forecasting). No, M. (2022)
• Make conclusions about predicted values based on historical values using time series analysis. For
instance, you may base garment sale pricing on seasonal fluctuations in time series data.
• Predict future values using historical data. You might, for instance, anticipate weather conditions
using decades' worth of meteorological data.
⊘ This is a preview!⊘
Do you want full access?
Subscribe today to unlock all pages.
Trusted by 1+ million students worldwide

• Identify noise or abnormalities in time series. For instance, using past data, you may identify
fraudulent financial behaviour. No, M. (2022)
Anyone who works in a position that requires making judgments and developing policies may find
time series analysis to be particularly beneficial.
In order to select a model for projecting future data, time series forecasting, a subset of time series
analysis, looks at previous data. The projection will be more precise the more comprehensive the data
are. For instance, a time series of automobile purchases over the previous 50 years may produce more
accurate projections than one from the previous two years. A crucial and frequently the only
application of time series data is time series forecasting. Additionally, while forecasting, you have the
option of using numerous variables or just one to analyse and predict future values. Phumchusri et.al
(2021)
The hotel industry is currently faced with intense competition on a global scale. Effective hotel and
revenue management are the two crucial elements for a successful hotel industry. Accurate and
prompt forecasting of hotel daily occupancy may greatly enhance hotel revenue management by
enabling the hotel management team to optimise revenue by establishing the right hotel room pricing
and offerings despite changes in their hotel room demand throughout the year (Weather-ford et al.
2001). As a result, forecasting is crucial for hotel revenue management, as shown by earlier studies.
Phumchusri et.al (2021)
There are now three fundamental revenue management forecasting models: combination models,
pre - booking models, and historical booking models. The historical booking models use a series of
previous observations of the final demand (number of daily occupied rooms) to project demand for
upcoming arrival dates over a period of 2 to 8 weeks (long-term projection) (Rajo-padhye et al. 2001).
Paraphrase This Document
Need a fresh take? Get an instant paraphrase of this document with our AI Paraphraser

The time series study shown above was performed on the Lancaster Hotel since 2019 with an
emphasis on the final four months of the year, ignoring the existence of COVID in 2020 and 2021. to
see the holiday sales, which we may observe increasing every year around Christmas. The regularity
or smoothness of the CMA line is provided by the data point. Phumchusri et.al (2021)
RAPID MINER
• To uncover patterns, connections, and abnormalities in massive data sets, data mining integrates
statistics, artificial intelligence, and machine learning.
•An corporation may utilise data mining to enhance a variety of facets of its operations, but the
practise is especially beneficial for enhancing sales and customer interactions. So through this we
come to know which age group people prefer which rooms and at which rate booking goes up during
all season.
• Current data may be mined for links and patterns that can be applied to fresh data to forecast
developments or spot abnormalities like fraud. Morris, A. (2021)
Here is an example of data mining using rapid miner tool

Visualization we may do plot study in this region using a dispersed plot, a bar, a spline line, etc.This
will enable us to choose the variables we want to analyse and arrange them on the X- and Y-axes. This
facilitates the display of the facts and their following connections. Based on the screenshot's
presentation, we can observe that people have a noticeable inclination to favour certain room types
depending on their marital status and the type of space.
Here we can see that when the bookings are more frequent, the rate impacts the room booking and
booking type. What types of rooms are booked mostly by singles, and what types of rooms are
preferred by singles .
⊘ This is a preview!⊘
Do you want full access?
Subscribe today to unlock all pages.
Trusted by 1+ million students worldwide

In the decision tree, we can clearly see that booking is higher when the rate of the rooms is lower.
Customers mostly prefer single rooms due to the low price of the room. Customers prefer double
rooms over suite accommodations because the price of a double room is lower in comparison. As we
know Lancaster Hotel consist of 70 high specification en-suite bedrooms, 30 twin double rooms and
40 single rooms. They should modify there rooms according to which room are mostly booked by the
customers .
With the help of business intelligence Lancaster hotel can use DFD to describes how data enter a
system, how it is changed there, and how it is kept there and ERD represents the entity model and will
display the design of a system . This will make there booking process more organised .
With the help of time series then can see the forecast a weighted average of both the historical and
advanced booking forecasts as well as the long-term forecast and short-term forecast can improve the
effectiveness of forecasting. Phumchusri et.al (2021)
With the help of RapidMiner, Lancaster Hotel can identify what type of changes are needed to
enhance the booking . What type of customer is attracted at what price, and during what season can
they target the customer .
Paraphrase This Document
Need a fresh take? Get an instant paraphrase of this document with our AI Paraphraser
References
• Bhatiasevi, V., & Naglis, M. (2020). Elucidating the determinants of business intelligence
adoption and organizational performance. Information Development, 36(1), 78–96.
https://doi.org/10.1177/0266666918811394
• Alzghoul, A., Khaddam, A. A., Abousweilem, F., Irtaimeh, H. J., & Alshaar, Q. (2022). How
business intelligence capability impacts decision-making speed, comprehensiveness, and firm
performance. Information Development, 0(0). https://doi.org/10.1177/02666669221108438
• Phumchusri,N., Suwatanapongched ,P., (2021) Forecasting hotel daily room demand with
transformed data using time series methods, Revenue and Pricing Management .
• Kowalczyk, M. and Buxmann, P., 2015. Perspectives on Collaboration Procedures and Politics
During the Support of Decision Processes with Business Intelligence & Analytics.
• Loebbecke, C. and Picot, A., 2015. Reflections on societal and business model transformation
arising from digitization and big data analytics: A research agenda. The Journal of Strategic
Information Systems, 24(3), pp.149-157.
• Elbashir, M.Z., Collier, P.A. and Davern, M.J., 2008. Measuring the effects of business
intelligence systems: The relationship between business process and organizational
performance. International journal of accounting information systems, 9(3), pp.135-153.
• Peterson, R. (2022) Entity Relationship (ER) Diagram Model with DBMS Example. Available at:
https://www.guru99.com/er-diagram-tutorial-dbms.html
• Nym, (2022) DFD for Hotel Management System – Data Flow Diagram . Available at:
https://itsourcecode.com/uml/dfd/dfd-for-hotel-management-system-data-flow-diagram/
• Box, G.E., Jenkins, G.M., Reinsel, G.C. and Ljung, G.M., 2015. Time series analysis: forecasting
and control. John Wiley & Sons.
• Goepner, E. (2022). Time Series Analytics. In: Schintler, L.A., McNeely, C.L. (eds)
Encyclopedia of Big Data. Springer, Cham. https://doi.org/10.1007/978-3-319-32010-
6_469
• No, M. (2022) What Is Time Series Data and How Is It Analyzed? Available at:
https://careerfoundry.com/en/blog/data-analytics/what-is-time-series-data/.

• Morris, A. (2021) What Is Data Mining? How It Works, Techniques & Examples. Available at:
https://www.netsuite.com/portal/resource/articles/data-warehouse/data-mining.shtml.
• Lancaster Hotel & Spa (2020). Available at:
https://www.brunelvenues.com/accommodation/on-campus-hotel/.
https://www.netsuite.com/portal/resource/articles/data-warehouse/data-mining.shtml.
• Lancaster Hotel & Spa (2020). Available at:
https://www.brunelvenues.com/accommodation/on-campus-hotel/.
⊘ This is a preview!⊘
Do you want full access?
Subscribe today to unlock all pages.
Trusted by 1+ million students worldwide
1 out of 12
Related Documents


Your All-in-One AI-Powered Toolkit for Academic Success.
+13062052269
info@desklib.com
Available 24*7 on WhatsApp / Email
![[object Object]](/_next/static/media/star-bottom.7253800d.svg)
Unlock your academic potential
Copyright © 2020–2026 A2Z Services. All Rights Reserved. Developed and managed by ZUCOL.