Financial Reporting Project: Financial Performance of Hotel Companies
VerifiedAdded on 2023/06/09
|23
|5059
|278
Report
AI Summary
This report provides a detailed financial analysis of HOTEL GRAND CENTRAL LTD and HOTEL PROPERTIES LTD, comparing their performance using ratio analysis. The introduction outlines the purpose of the report, which is to evaluate the financial performance of both companies to identify the best investment opportunity. The report then provides company overviews, followed by an in-depth ratio analysis. The ratio analysis includes profitability analysis (ROCE, gross profit margin), liquidity analysis (current ratio, quick ratio), asset efficiency analysis (trade payable payment ratio, inventory turnover ratio), and gearing analysis. The analysis involves a comparative study of the financial data for the years 2016 and 2017, highlighting trends and performance metrics for each company. The findings and analysis section synthesizes the data to draw conclusions regarding the financial health and investment potential of each company. The report concludes with a summary of key findings and recommendations based on the ratio analysis. The provided references and appendices support the analysis and provide additional context to the financial data used throughout the report.
Running Head: Financial Reporting
1
Project Report: Financial Reporting
1
Project Report: Financial Reporting
Paraphrase This Document
Need a fresh take? Get an instant paraphrase of this document with our AI Paraphraser
Financial Reporting
2
Contents
Introduction......................................................................................................................................3
Report introduction......................................................................................................................3
Company overview......................................................................................................................3
Ratio analysis...................................................................................................................................3
Profitability analysis....................................................................................................................3
Liquidity analysis.........................................................................................................................5
Asset efficiency analysis..............................................................................................................7
Gearing analysis...........................................................................................................................8
Findings and analysis.......................................................................................................................9
Conclusion.......................................................................................................................................9
References......................................................................................................................................11
Appendix........................................................................................................................................12
Financial Reporting
3
Introduction
Report introduction:
Financial analysis is a process in which the financial statement of a particular
organization is studied and various tools are applied on the financial data to measure the overall
performance of the company. This process evaluates all the related factors to measure the
changes into the financial performance as well as it is a good base to make the changes into the
financial strategy and the policies of the company. The report has been prepared to identify and
measure the financial performance of HOTEL GRAND CENTRAL LTD and HOTEL
PROPERTIES LTD. In this report, ratio analysis tool has been used on both the companies to
identify their performance and the best company for the purpose of the investment. The main
objective of the report is to evaluate the best investment company so that the return of the
investor could be higher and the risk level could be lower.
Company overview:
HOTEL GRAND CENTRAL LTD operates, owns and manages the hotels. The
organization operates in five countries which are Malaysia, Singapore, Australia, New Zealand
and china. The company manages all the hotels in a perfect manner. The chain of the hotels has
been started in 1883. The current financial and non financial performance of the company is
quite attractive and brief about better position of the company in the industry (Reuters, 2018.)
HOTEL PROPERTIES LTD is an investment holding company that operates, owns and
manages the hotels. The organization operates through hotel and properties. It owns and operates
around 32 hotels. The entire hotels of the company are managed in a perfect manner. The current
financial and non financial performance of the company is quite attractive and brief about better
position of the company in the industry (Bloomberg, 2018).
Ratio analysis
Ratio analysis is a financial quantitative method which evaluates the financial statement
of an organization. This analysis method is used to identify the operating and financial
⊘ This is a preview!⊘
Do you want full access?
Subscribe today to unlock all pages.
Trusted by 1+ million students worldwide
Financial Reporting
4
performance such as the profitability, liquidity, gearing level of the company. It involves in
measuring the financial health and performance of an organization by using the data from the
current and historical financial statement. The ratio analysis study on both the companies is as
follows:
Profitability analysis:
Each firm focuses on the profitability position to measure the performance of the
company. Profitability ratio analysis is one of the most common ways to measure the
performance and the profitability level of the company. The main ratios to measure the
profitability performance of an organization are operating profit margin, gross profit margin and
return on capital employed. The profitability analysis of both the companies is as follows:
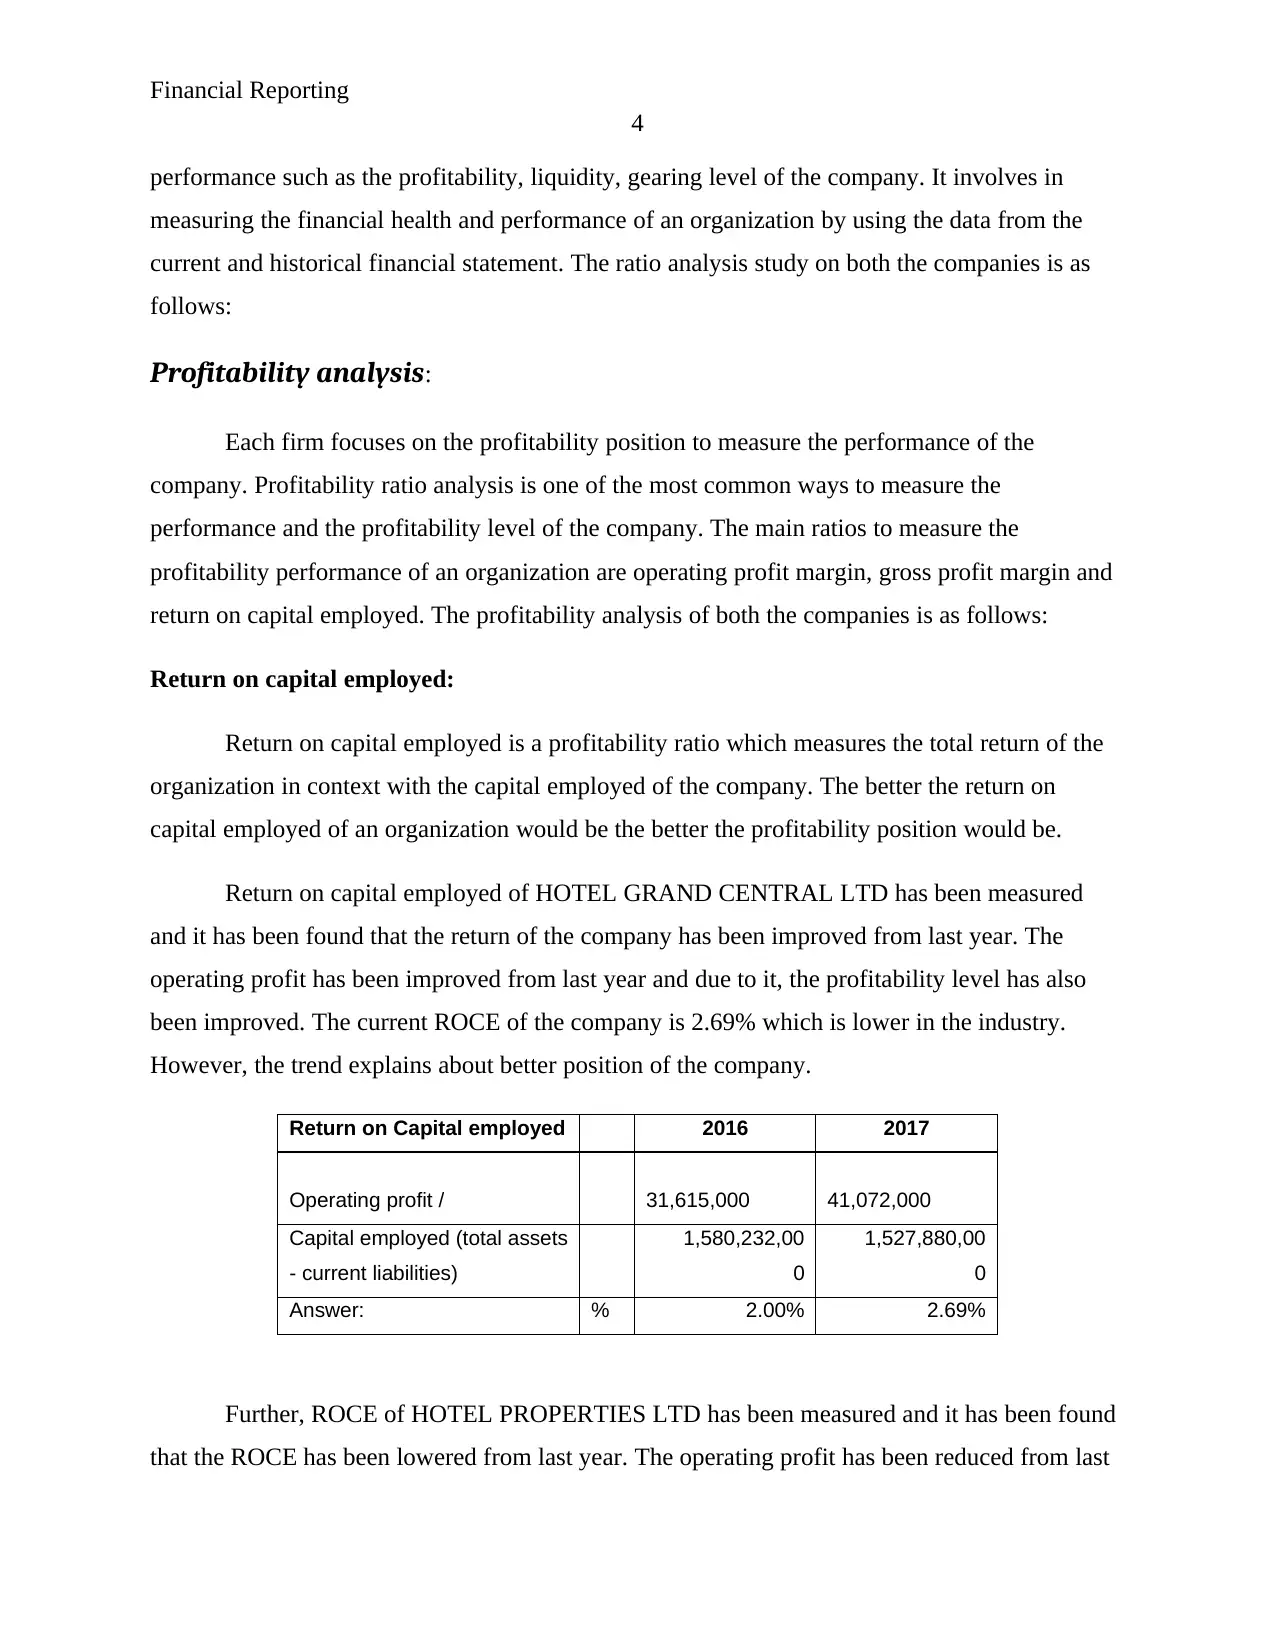
Return on capital employed:
Return on capital employed is a profitability ratio which measures the total return of the
organization in context with the capital employed of the company. The better the return on
capital employed of an organization would be the better the profitability position would be.
Return on capital employed of HOTEL GRAND CENTRAL LTD has been measured
and it has been found that the return of the company has been improved from last year. The
operating profit has been improved from last year and due to it, the profitability level has also
been improved. The current ROCE of the company is 2.69% which is lower in the industry.
However, the trend explains about better position of the company.
Return on Capital employed 2016 2017
Operating profit / 31,615,000 41,072,000
Capital employed (total assets
- current liabilities)
1,580,232,00
0
1,527,880,00
0
Answer: % 2.00% 2.69%
Further, ROCE of HOTEL PROPERTIES LTD has been measured and it has been found
that the ROCE has been lowered from last year. The operating profit has been reduced from last
4
performance such as the profitability, liquidity, gearing level of the company. It involves in
measuring the financial health and performance of an organization by using the data from the
current and historical financial statement. The ratio analysis study on both the companies is as
follows:
Profitability analysis:
Each firm focuses on the profitability position to measure the performance of the
company. Profitability ratio analysis is one of the most common ways to measure the
performance and the profitability level of the company. The main ratios to measure the
profitability performance of an organization are operating profit margin, gross profit margin and
return on capital employed. The profitability analysis of both the companies is as follows:
Return on capital employed:
Return on capital employed is a profitability ratio which measures the total return of the
organization in context with the capital employed of the company. The better the return on
capital employed of an organization would be the better the profitability position would be.
Return on capital employed of HOTEL GRAND CENTRAL LTD has been measured
and it has been found that the return of the company has been improved from last year. The
operating profit has been improved from last year and due to it, the profitability level has also
been improved. The current ROCE of the company is 2.69% which is lower in the industry.
However, the trend explains about better position of the company.
Return on Capital employed 2016 2017
Operating profit / 31,615,000 41,072,000
Capital employed (total assets
- current liabilities)
1,580,232,00
0
1,527,880,00
0
Answer: % 2.00% 2.69%
Further, ROCE of HOTEL PROPERTIES LTD has been measured and it has been found
that the ROCE has been lowered from last year. The operating profit has been reduced from last
Paraphrase This Document
Need a fresh take? Get an instant paraphrase of this document with our AI Paraphraser
Financial Reporting
5
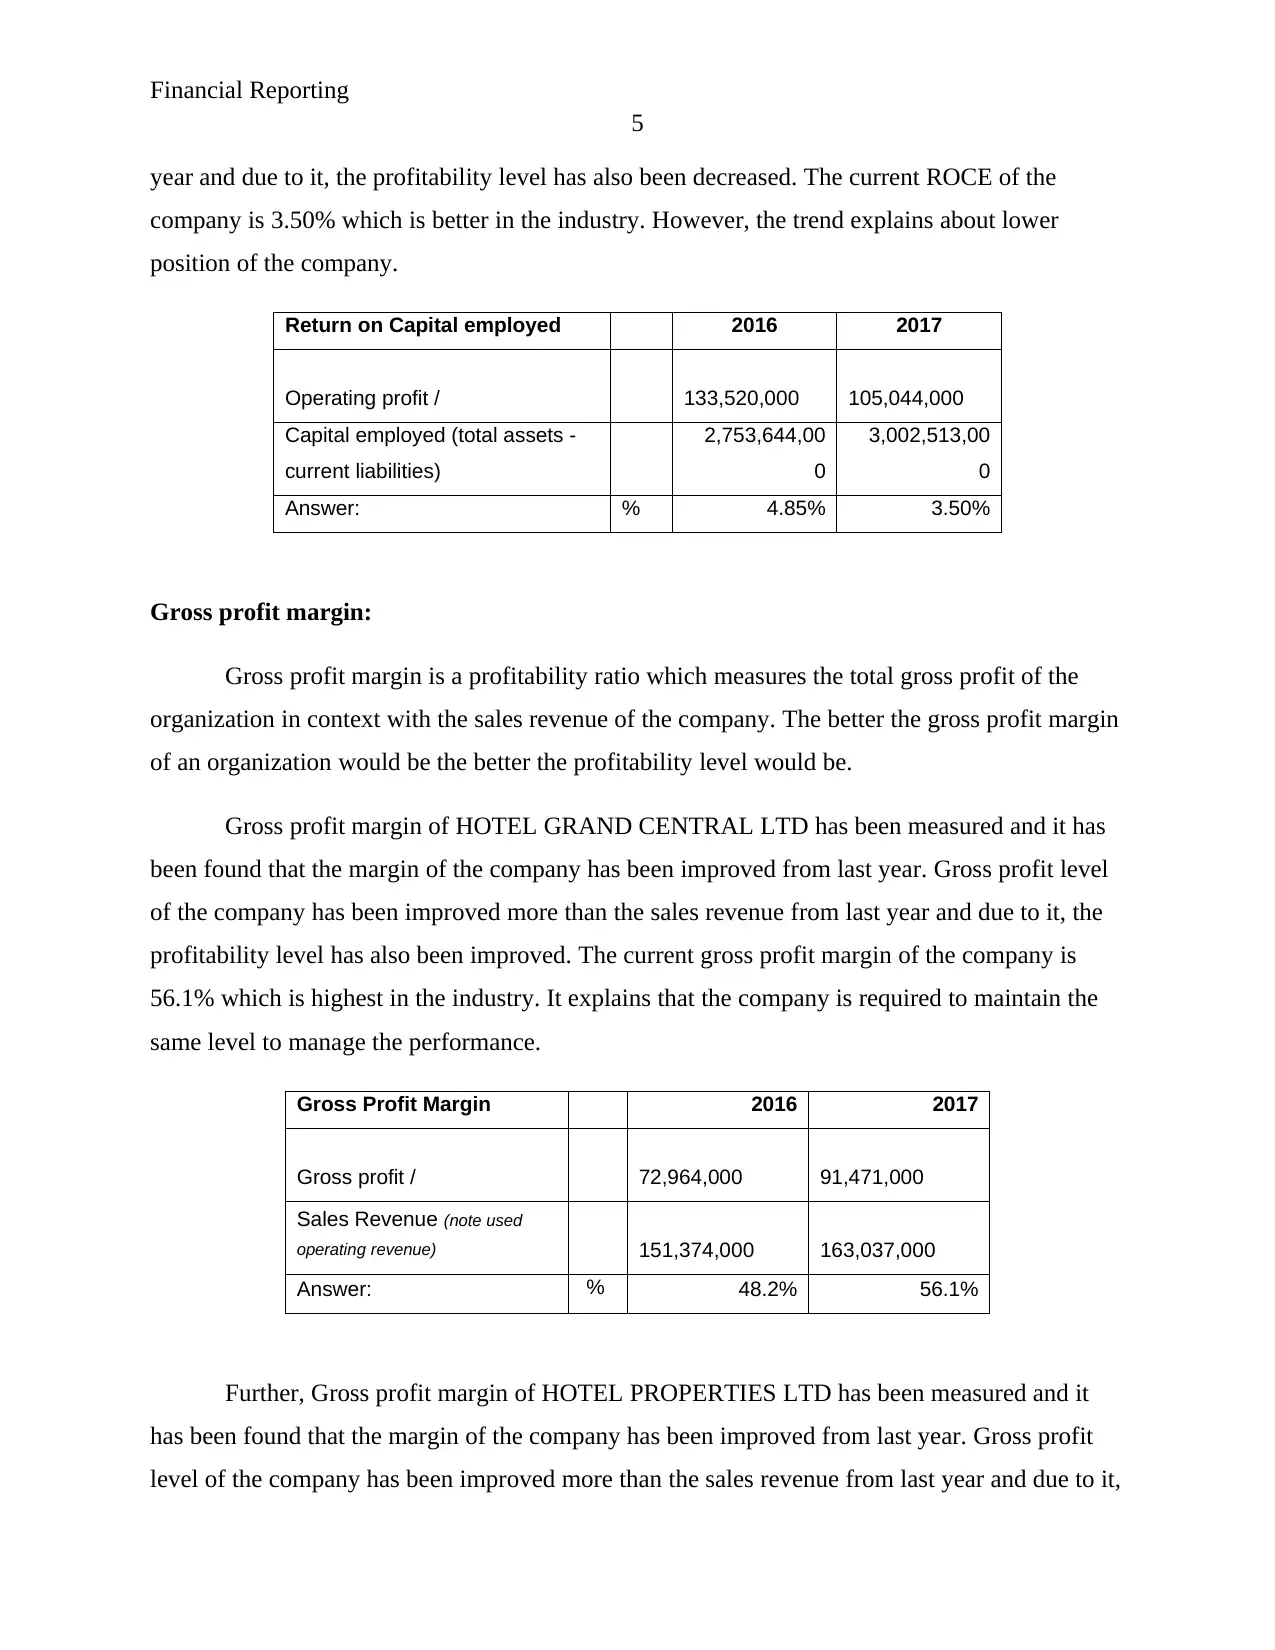
year and due to it, the profitability level has also been decreased. The current ROCE of the
company is 3.50% which is better in the industry. However, the trend explains about lower
position of the company.
Return on Capital employed 2016 2017
Operating profit / 133,520,000 105,044,000
Capital employed (total assets -
current liabilities)
2,753,644,00
0
3,002,513,00
0
Answer: % 4.85% 3.50%
Gross profit margin:
Gross profit margin is a profitability ratio which measures the total gross profit of the
organization in context with the sales revenue of the company. The better the gross profit margin
of an organization would be the better the profitability level would be.
Gross profit margin of HOTEL GRAND CENTRAL LTD has been measured and it has
been found that the margin of the company has been improved from last year. Gross profit level
of the company has been improved more than the sales revenue from last year and due to it, the
profitability level has also been improved. The current gross profit margin of the company is
56.1% which is highest in the industry. It explains that the company is required to maintain the
same level to manage the performance.
Gross Profit Margin 2016 2017
Gross profit / 72,964,000 91,471,000
Sales Revenue (note used
operating revenue) 151,374,000 163,037,000
Answer: % 48.2% 56.1%
Further, Gross profit margin of HOTEL PROPERTIES LTD has been measured and it
has been found that the margin of the company has been improved from last year. Gross profit
level of the company has been improved more than the sales revenue from last year and due to it,
5
year and due to it, the profitability level has also been decreased. The current ROCE of the
company is 3.50% which is better in the industry. However, the trend explains about lower
position of the company.
Return on Capital employed 2016 2017
Operating profit / 133,520,000 105,044,000
Capital employed (total assets -
current liabilities)
2,753,644,00
0
3,002,513,00
0
Answer: % 4.85% 3.50%
Gross profit margin:
Gross profit margin is a profitability ratio which measures the total gross profit of the
organization in context with the sales revenue of the company. The better the gross profit margin
of an organization would be the better the profitability level would be.
Gross profit margin of HOTEL GRAND CENTRAL LTD has been measured and it has
been found that the margin of the company has been improved from last year. Gross profit level
of the company has been improved more than the sales revenue from last year and due to it, the
profitability level has also been improved. The current gross profit margin of the company is
56.1% which is highest in the industry. It explains that the company is required to maintain the
same level to manage the performance.
Gross Profit Margin 2016 2017
Gross profit / 72,964,000 91,471,000
Sales Revenue (note used
operating revenue) 151,374,000 163,037,000
Answer: % 48.2% 56.1%
Further, Gross profit margin of HOTEL PROPERTIES LTD has been measured and it
has been found that the margin of the company has been improved from last year. Gross profit
level of the company has been improved more than the sales revenue from last year and due to it,
Financial Reporting
6
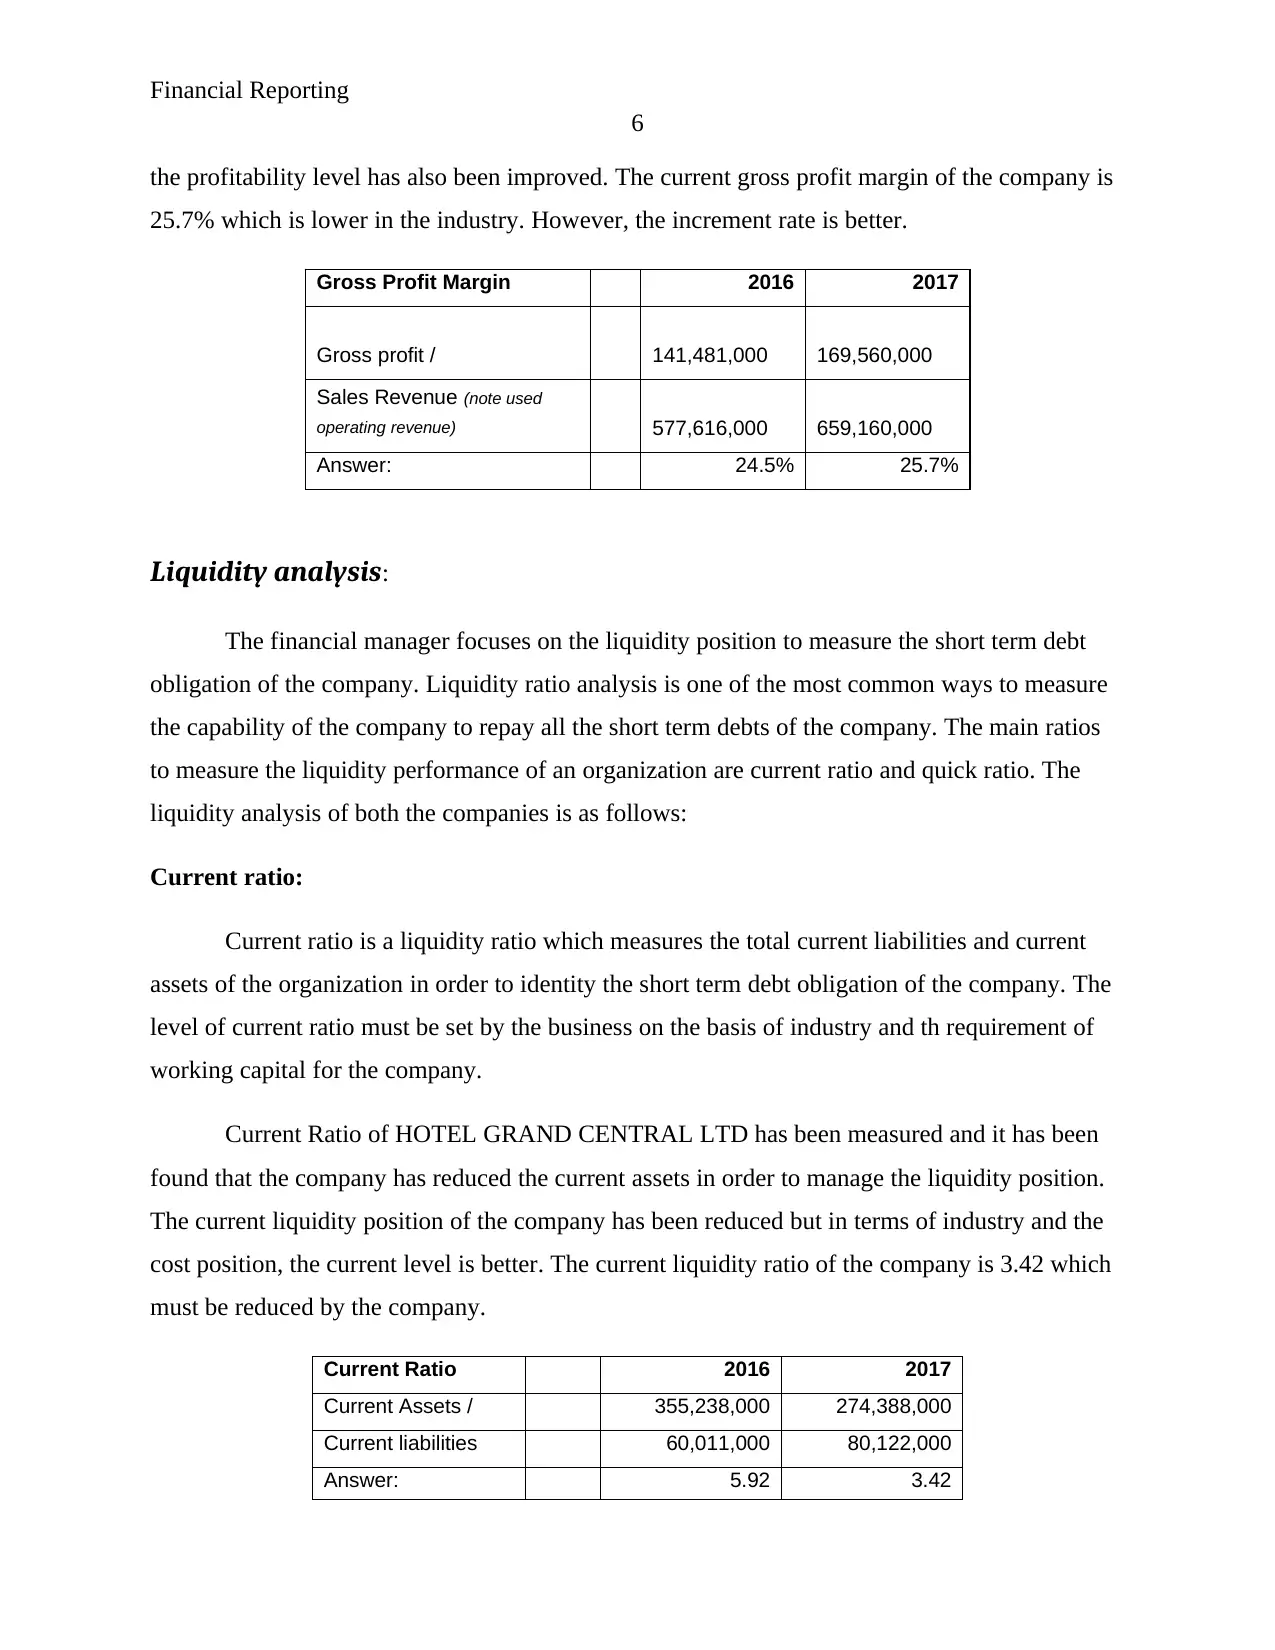
the profitability level has also been improved. The current gross profit margin of the company is
25.7% which is lower in the industry. However, the increment rate is better.
Gross Profit Margin 2016 2017
Gross profit / 141,481,000 169,560,000
Sales Revenue (note used
operating revenue) 577,616,000 659,160,000
Answer: 24.5% 25.7%
Liquidity analysis:
The financial manager focuses on the liquidity position to measure the short term debt
obligation of the company. Liquidity ratio analysis is one of the most common ways to measure
the capability of the company to repay all the short term debts of the company. The main ratios
to measure the liquidity performance of an organization are current ratio and quick ratio. The
liquidity analysis of both the companies is as follows:
Current ratio:
Current ratio is a liquidity ratio which measures the total current liabilities and current
assets of the organization in order to identity the short term debt obligation of the company. The
level of current ratio must be set by the business on the basis of industry and th requirement of
working capital for the company.
Current Ratio of HOTEL GRAND CENTRAL LTD has been measured and it has been
found that the company has reduced the current assets in order to manage the liquidity position.
The current liquidity position of the company has been reduced but in terms of industry and the
cost position, the current level is better. The current liquidity ratio of the company is 3.42 which
must be reduced by the company.
Current Ratio 2016 2017
Current Assets / 355,238,000 274,388,000
Current liabilities 60,011,000 80,122,000
Answer: 5.92 3.42
6
the profitability level has also been improved. The current gross profit margin of the company is
25.7% which is lower in the industry. However, the increment rate is better.
Gross Profit Margin 2016 2017
Gross profit / 141,481,000 169,560,000
Sales Revenue (note used
operating revenue) 577,616,000 659,160,000
Answer: 24.5% 25.7%
Liquidity analysis:
The financial manager focuses on the liquidity position to measure the short term debt
obligation of the company. Liquidity ratio analysis is one of the most common ways to measure
the capability of the company to repay all the short term debts of the company. The main ratios
to measure the liquidity performance of an organization are current ratio and quick ratio. The
liquidity analysis of both the companies is as follows:
Current ratio:
Current ratio is a liquidity ratio which measures the total current liabilities and current
assets of the organization in order to identity the short term debt obligation of the company. The
level of current ratio must be set by the business on the basis of industry and th requirement of
working capital for the company.
Current Ratio of HOTEL GRAND CENTRAL LTD has been measured and it has been
found that the company has reduced the current assets in order to manage the liquidity position.
The current liquidity position of the company has been reduced but in terms of industry and the
cost position, the current level is better. The current liquidity ratio of the company is 3.42 which
must be reduced by the company.
Current Ratio 2016 2017
Current Assets / 355,238,000 274,388,000
Current liabilities 60,011,000 80,122,000
Answer: 5.92 3.42
⊘ This is a preview!⊘
Do you want full access?
Subscribe today to unlock all pages.
Trusted by 1+ million students worldwide
Financial Reporting
7
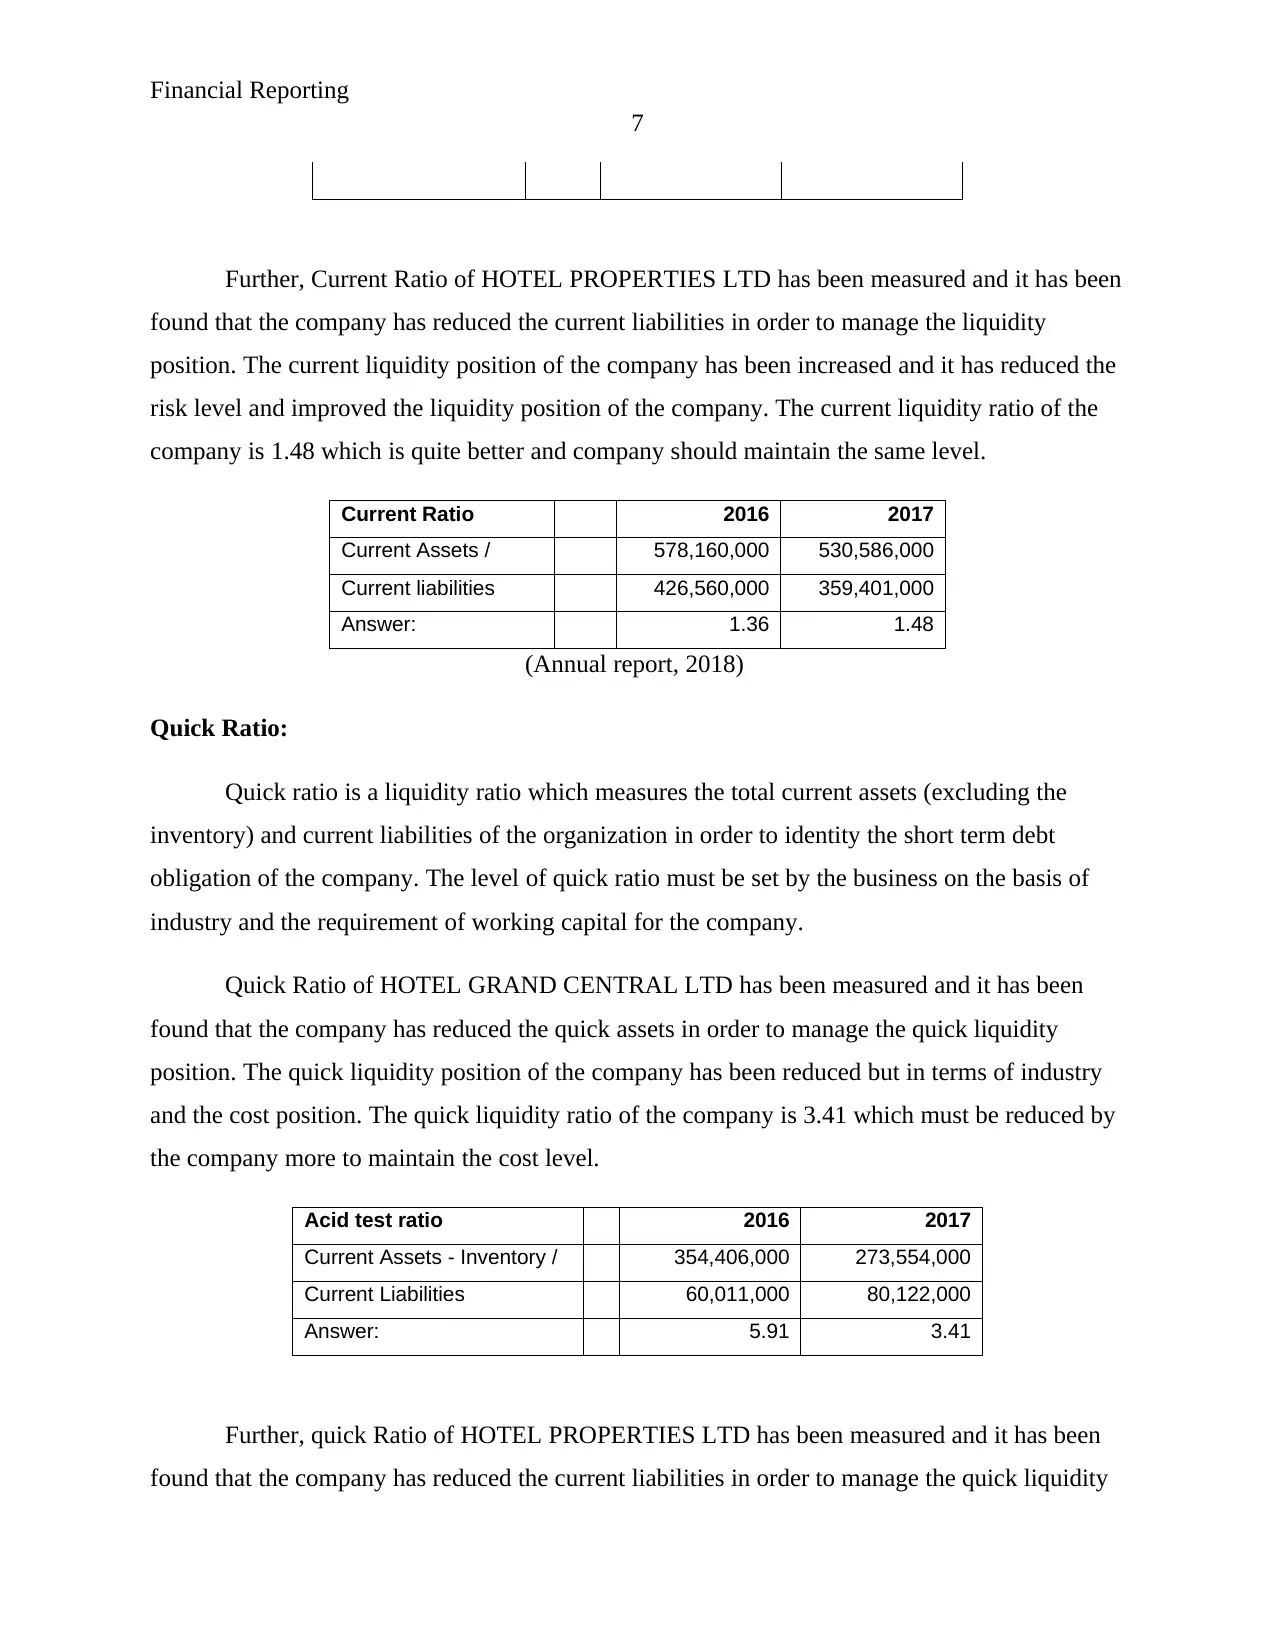
Further, Current Ratio of HOTEL PROPERTIES LTD has been measured and it has been
found that the company has reduced the current liabilities in order to manage the liquidity
position. The current liquidity position of the company has been increased and it has reduced the
risk level and improved the liquidity position of the company. The current liquidity ratio of the
company is 1.48 which is quite better and company should maintain the same level.
Current Ratio 2016 2017
Current Assets / 578,160,000 530,586,000
Current liabilities 426,560,000 359,401,000
Answer: 1.36 1.48
(Annual report, 2018)
Quick Ratio:
Quick ratio is a liquidity ratio which measures the total current assets (excluding the
inventory) and current liabilities of the organization in order to identity the short term debt
obligation of the company. The level of quick ratio must be set by the business on the basis of
industry and the requirement of working capital for the company.
Quick Ratio of HOTEL GRAND CENTRAL LTD has been measured and it has been
found that the company has reduced the quick assets in order to manage the quick liquidity
position. The quick liquidity position of the company has been reduced but in terms of industry
and the cost position. The quick liquidity ratio of the company is 3.41 which must be reduced by
the company more to maintain the cost level.
Acid test ratio 2016 2017
Current Assets - Inventory / 354,406,000 273,554,000
Current Liabilities 60,011,000 80,122,000
Answer: 5.91 3.41
Further, quick Ratio of HOTEL PROPERTIES LTD has been measured and it has been
found that the company has reduced the current liabilities in order to manage the quick liquidity
7
Further, Current Ratio of HOTEL PROPERTIES LTD has been measured and it has been
found that the company has reduced the current liabilities in order to manage the liquidity
position. The current liquidity position of the company has been increased and it has reduced the
risk level and improved the liquidity position of the company. The current liquidity ratio of the
company is 1.48 which is quite better and company should maintain the same level.
Current Ratio 2016 2017
Current Assets / 578,160,000 530,586,000
Current liabilities 426,560,000 359,401,000
Answer: 1.36 1.48
(Annual report, 2018)
Quick Ratio:
Quick ratio is a liquidity ratio which measures the total current assets (excluding the
inventory) and current liabilities of the organization in order to identity the short term debt
obligation of the company. The level of quick ratio must be set by the business on the basis of
industry and the requirement of working capital for the company.
Quick Ratio of HOTEL GRAND CENTRAL LTD has been measured and it has been
found that the company has reduced the quick assets in order to manage the quick liquidity
position. The quick liquidity position of the company has been reduced but in terms of industry
and the cost position. The quick liquidity ratio of the company is 3.41 which must be reduced by
the company more to maintain the cost level.
Acid test ratio 2016 2017
Current Assets - Inventory / 354,406,000 273,554,000
Current Liabilities 60,011,000 80,122,000
Answer: 5.91 3.41
Further, quick Ratio of HOTEL PROPERTIES LTD has been measured and it has been
found that the company has reduced the current liabilities in order to manage the quick liquidity
Paraphrase This Document
Need a fresh take? Get an instant paraphrase of this document with our AI Paraphraser
Financial Reporting
8
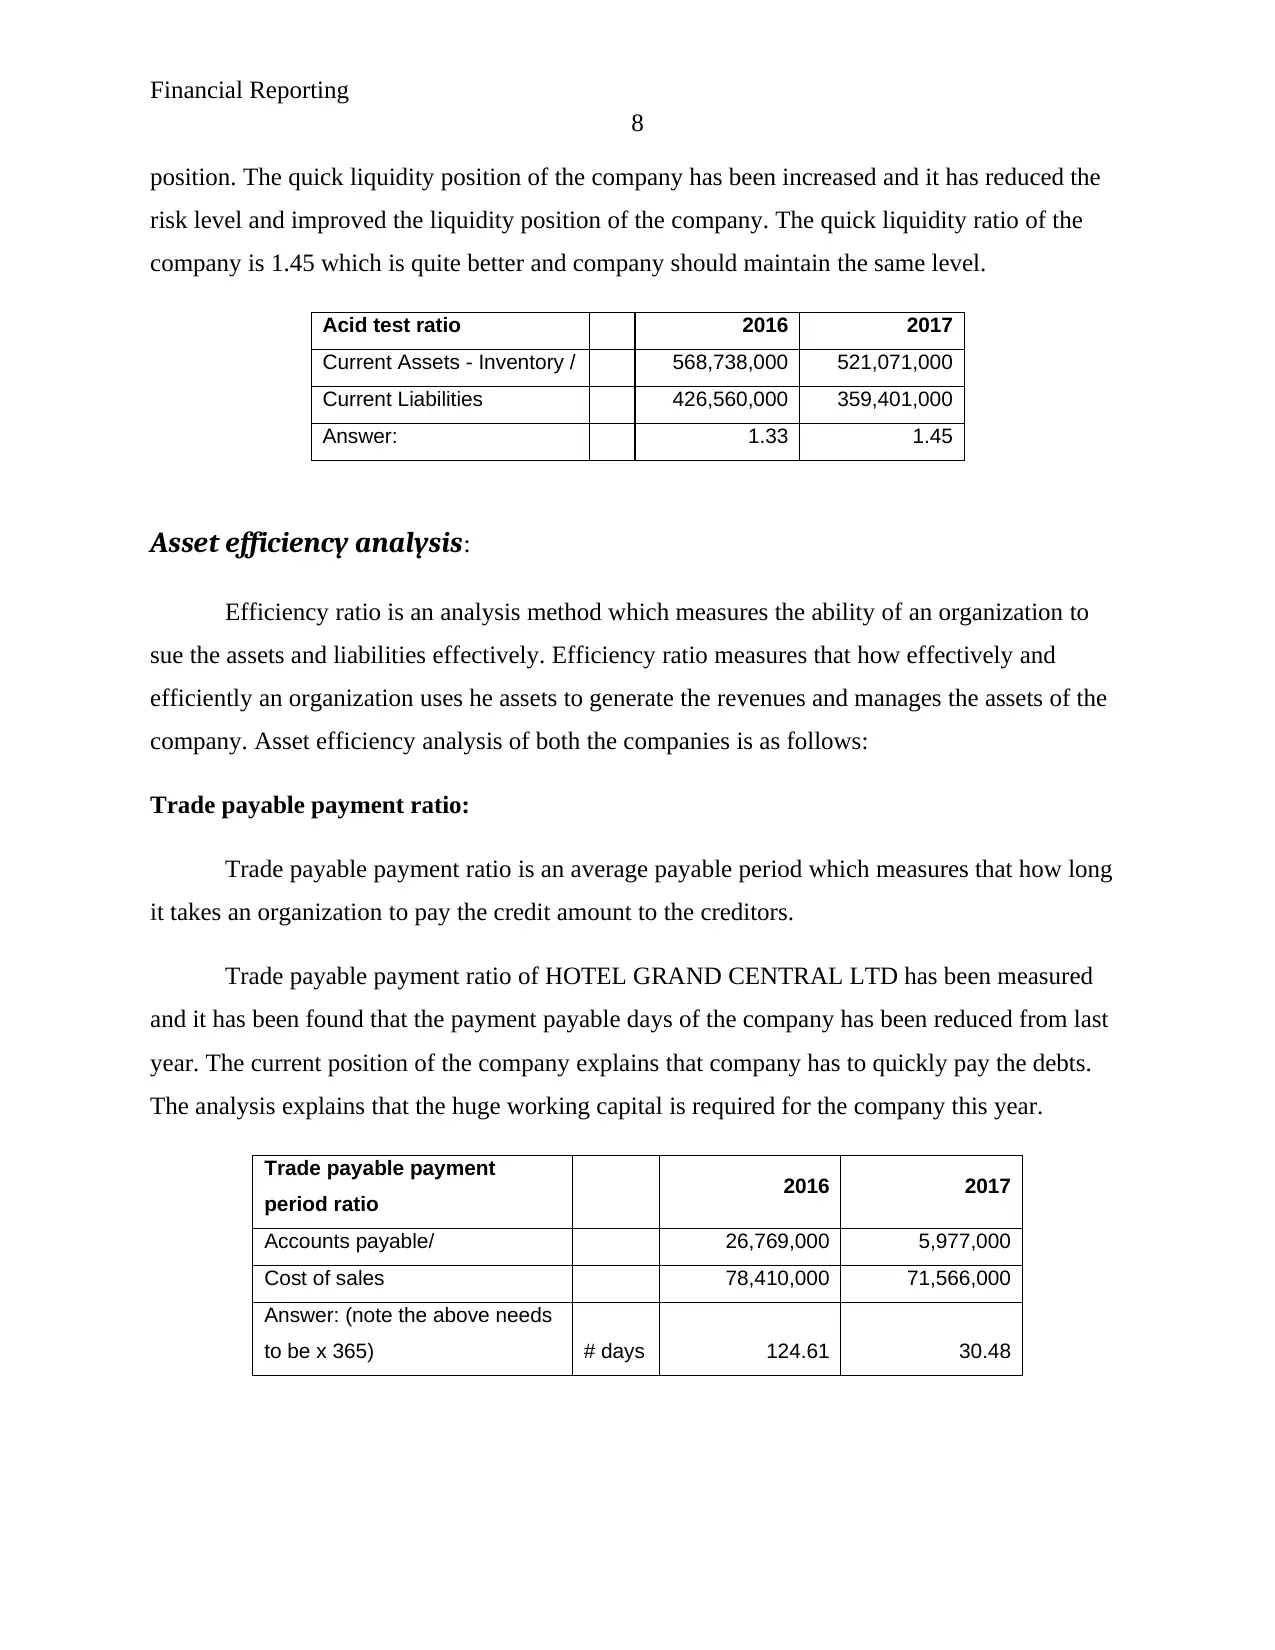
position. The quick liquidity position of the company has been increased and it has reduced the
risk level and improved the liquidity position of the company. The quick liquidity ratio of the
company is 1.45 which is quite better and company should maintain the same level.
Acid test ratio 2016 2017
Current Assets - Inventory / 568,738,000 521,071,000
Current Liabilities 426,560,000 359,401,000
Answer: 1.33 1.45
Asset efficiency analysis:
Efficiency ratio is an analysis method which measures the ability of an organization to
sue the assets and liabilities effectively. Efficiency ratio measures that how effectively and
efficiently an organization uses he assets to generate the revenues and manages the assets of the
company. Asset efficiency analysis of both the companies is as follows:
Trade payable payment ratio:
Trade payable payment ratio is an average payable period which measures that how long
it takes an organization to pay the credit amount to the creditors.
Trade payable payment ratio of HOTEL GRAND CENTRAL LTD has been measured
and it has been found that the payment payable days of the company has been reduced from last
year. The current position of the company explains that company has to quickly pay the debts.
The analysis explains that the huge working capital is required for the company this year.
Trade payable payment
period ratio 2016 2017
Accounts payable/ 26,769,000 5,977,000
Cost of sales 78,410,000 71,566,000
Answer: (note the above needs
to be x 365) # days 124.61 30.48
8
position. The quick liquidity position of the company has been increased and it has reduced the
risk level and improved the liquidity position of the company. The quick liquidity ratio of the
company is 1.45 which is quite better and company should maintain the same level.
Acid test ratio 2016 2017
Current Assets - Inventory / 568,738,000 521,071,000
Current Liabilities 426,560,000 359,401,000
Answer: 1.33 1.45
Asset efficiency analysis:
Efficiency ratio is an analysis method which measures the ability of an organization to
sue the assets and liabilities effectively. Efficiency ratio measures that how effectively and
efficiently an organization uses he assets to generate the revenues and manages the assets of the
company. Asset efficiency analysis of both the companies is as follows:
Trade payable payment ratio:
Trade payable payment ratio is an average payable period which measures that how long
it takes an organization to pay the credit amount to the creditors.
Trade payable payment ratio of HOTEL GRAND CENTRAL LTD has been measured
and it has been found that the payment payable days of the company has been reduced from last
year. The current position of the company explains that company has to quickly pay the debts.
The analysis explains that the huge working capital is required for the company this year.
Trade payable payment
period ratio 2016 2017
Accounts payable/ 26,769,000 5,977,000
Cost of sales 78,410,000 71,566,000
Answer: (note the above needs
to be x 365) # days 124.61 30.48
Financial Reporting
9
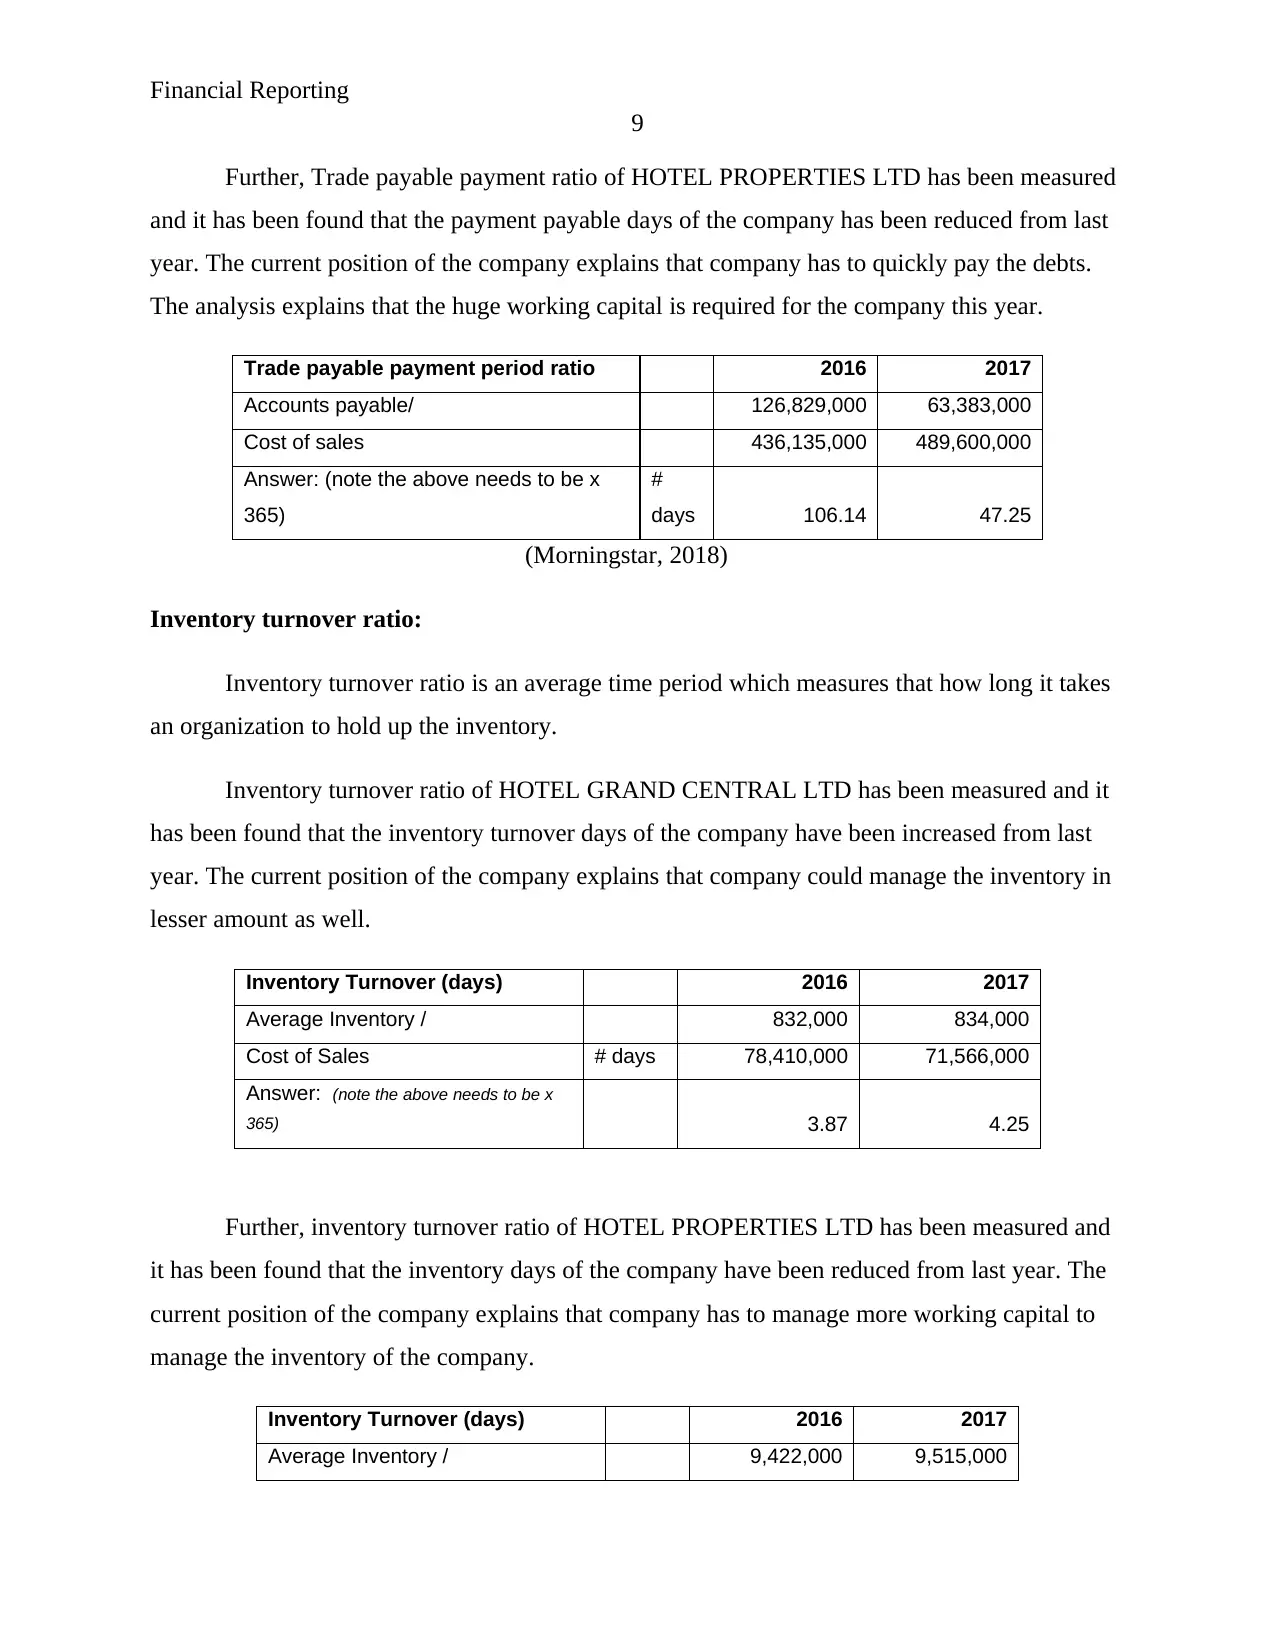
Further, Trade payable payment ratio of HOTEL PROPERTIES LTD has been measured
and it has been found that the payment payable days of the company has been reduced from last
year. The current position of the company explains that company has to quickly pay the debts.
The analysis explains that the huge working capital is required for the company this year.
Trade payable payment period ratio 2016 2017
Accounts payable/ 126,829,000 63,383,000
Cost of sales 436,135,000 489,600,000
Answer: (note the above needs to be x
365)
#
days 106.14 47.25
(Morningstar, 2018)
Inventory turnover ratio:
Inventory turnover ratio is an average time period which measures that how long it takes
an organization to hold up the inventory.
Inventory turnover ratio of HOTEL GRAND CENTRAL LTD has been measured and it
has been found that the inventory turnover days of the company have been increased from last
year. The current position of the company explains that company could manage the inventory in
lesser amount as well.
Inventory Turnover (days) 2016 2017
Average Inventory / 832,000 834,000
Cost of Sales # days 78,410,000 71,566,000
Answer: (note the above needs to be x
365) 3.87 4.25
Further, inventory turnover ratio of HOTEL PROPERTIES LTD has been measured and
it has been found that the inventory days of the company have been reduced from last year. The
current position of the company explains that company has to manage more working capital to
manage the inventory of the company.
Inventory Turnover (days) 2016 2017
Average Inventory / 9,422,000 9,515,000
9
Further, Trade payable payment ratio of HOTEL PROPERTIES LTD has been measured
and it has been found that the payment payable days of the company has been reduced from last
year. The current position of the company explains that company has to quickly pay the debts.
The analysis explains that the huge working capital is required for the company this year.
Trade payable payment period ratio 2016 2017
Accounts payable/ 126,829,000 63,383,000
Cost of sales 436,135,000 489,600,000
Answer: (note the above needs to be x
365)
#
days 106.14 47.25
(Morningstar, 2018)
Inventory turnover ratio:
Inventory turnover ratio is an average time period which measures that how long it takes
an organization to hold up the inventory.
Inventory turnover ratio of HOTEL GRAND CENTRAL LTD has been measured and it
has been found that the inventory turnover days of the company have been increased from last
year. The current position of the company explains that company could manage the inventory in
lesser amount as well.
Inventory Turnover (days) 2016 2017
Average Inventory / 832,000 834,000
Cost of Sales # days 78,410,000 71,566,000
Answer: (note the above needs to be x
365) 3.87 4.25
Further, inventory turnover ratio of HOTEL PROPERTIES LTD has been measured and
it has been found that the inventory days of the company have been reduced from last year. The
current position of the company explains that company has to manage more working capital to
manage the inventory of the company.
Inventory Turnover (days) 2016 2017
Average Inventory / 9,422,000 9,515,000
⊘ This is a preview!⊘
Do you want full access?
Subscribe today to unlock all pages.
Trusted by 1+ million students worldwide
Financial Reporting
10
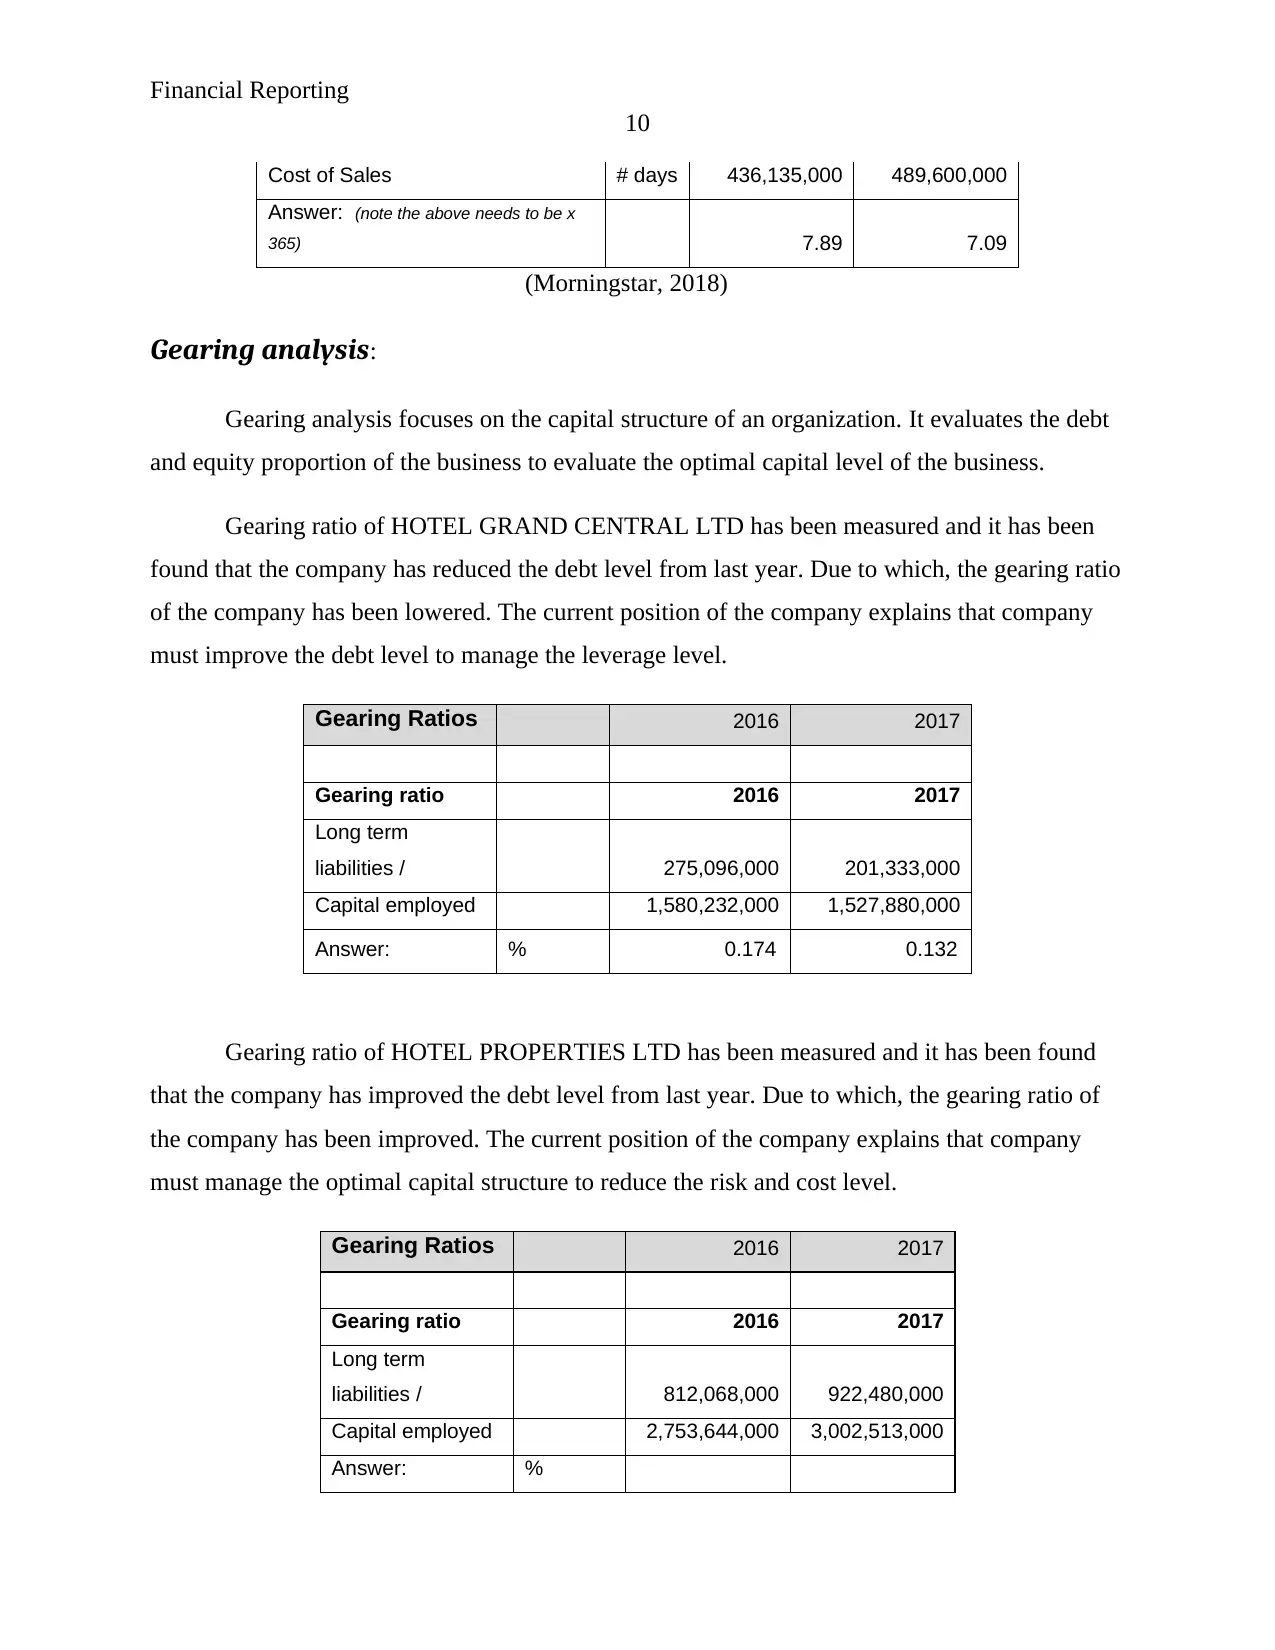
Cost of Sales # days 436,135,000 489,600,000
Answer: (note the above needs to be x
365) 7.89 7.09
(Morningstar, 2018)
Gearing analysis:
Gearing analysis focuses on the capital structure of an organization. It evaluates the debt
and equity proportion of the business to evaluate the optimal capital level of the business.
Gearing ratio of HOTEL GRAND CENTRAL LTD has been measured and it has been
found that the company has reduced the debt level from last year. Due to which, the gearing ratio
of the company has been lowered. The current position of the company explains that company
must improve the debt level to manage the leverage level.
Gearing Ratios 2016 2017
Gearing ratio 2016 2017
Long term
liabilities / 275,096,000 201,333,000
Capital employed 1,580,232,000 1,527,880,000
Answer: % 0.174 0.132
Gearing ratio of HOTEL PROPERTIES LTD has been measured and it has been found
that the company has improved the debt level from last year. Due to which, the gearing ratio of
the company has been improved. The current position of the company explains that company
must manage the optimal capital structure to reduce the risk and cost level.
Gearing Ratios 2016 2017
Gearing ratio 2016 2017
Long term
liabilities / 812,068,000 922,480,000
Capital employed 2,753,644,000 3,002,513,000
Answer: %
10
Cost of Sales # days 436,135,000 489,600,000
Answer: (note the above needs to be x
365) 7.89 7.09
(Morningstar, 2018)
Gearing analysis:
Gearing analysis focuses on the capital structure of an organization. It evaluates the debt
and equity proportion of the business to evaluate the optimal capital level of the business.
Gearing ratio of HOTEL GRAND CENTRAL LTD has been measured and it has been
found that the company has reduced the debt level from last year. Due to which, the gearing ratio
of the company has been lowered. The current position of the company explains that company
must improve the debt level to manage the leverage level.
Gearing Ratios 2016 2017
Gearing ratio 2016 2017
Long term
liabilities / 275,096,000 201,333,000
Capital employed 1,580,232,000 1,527,880,000
Answer: % 0.174 0.132
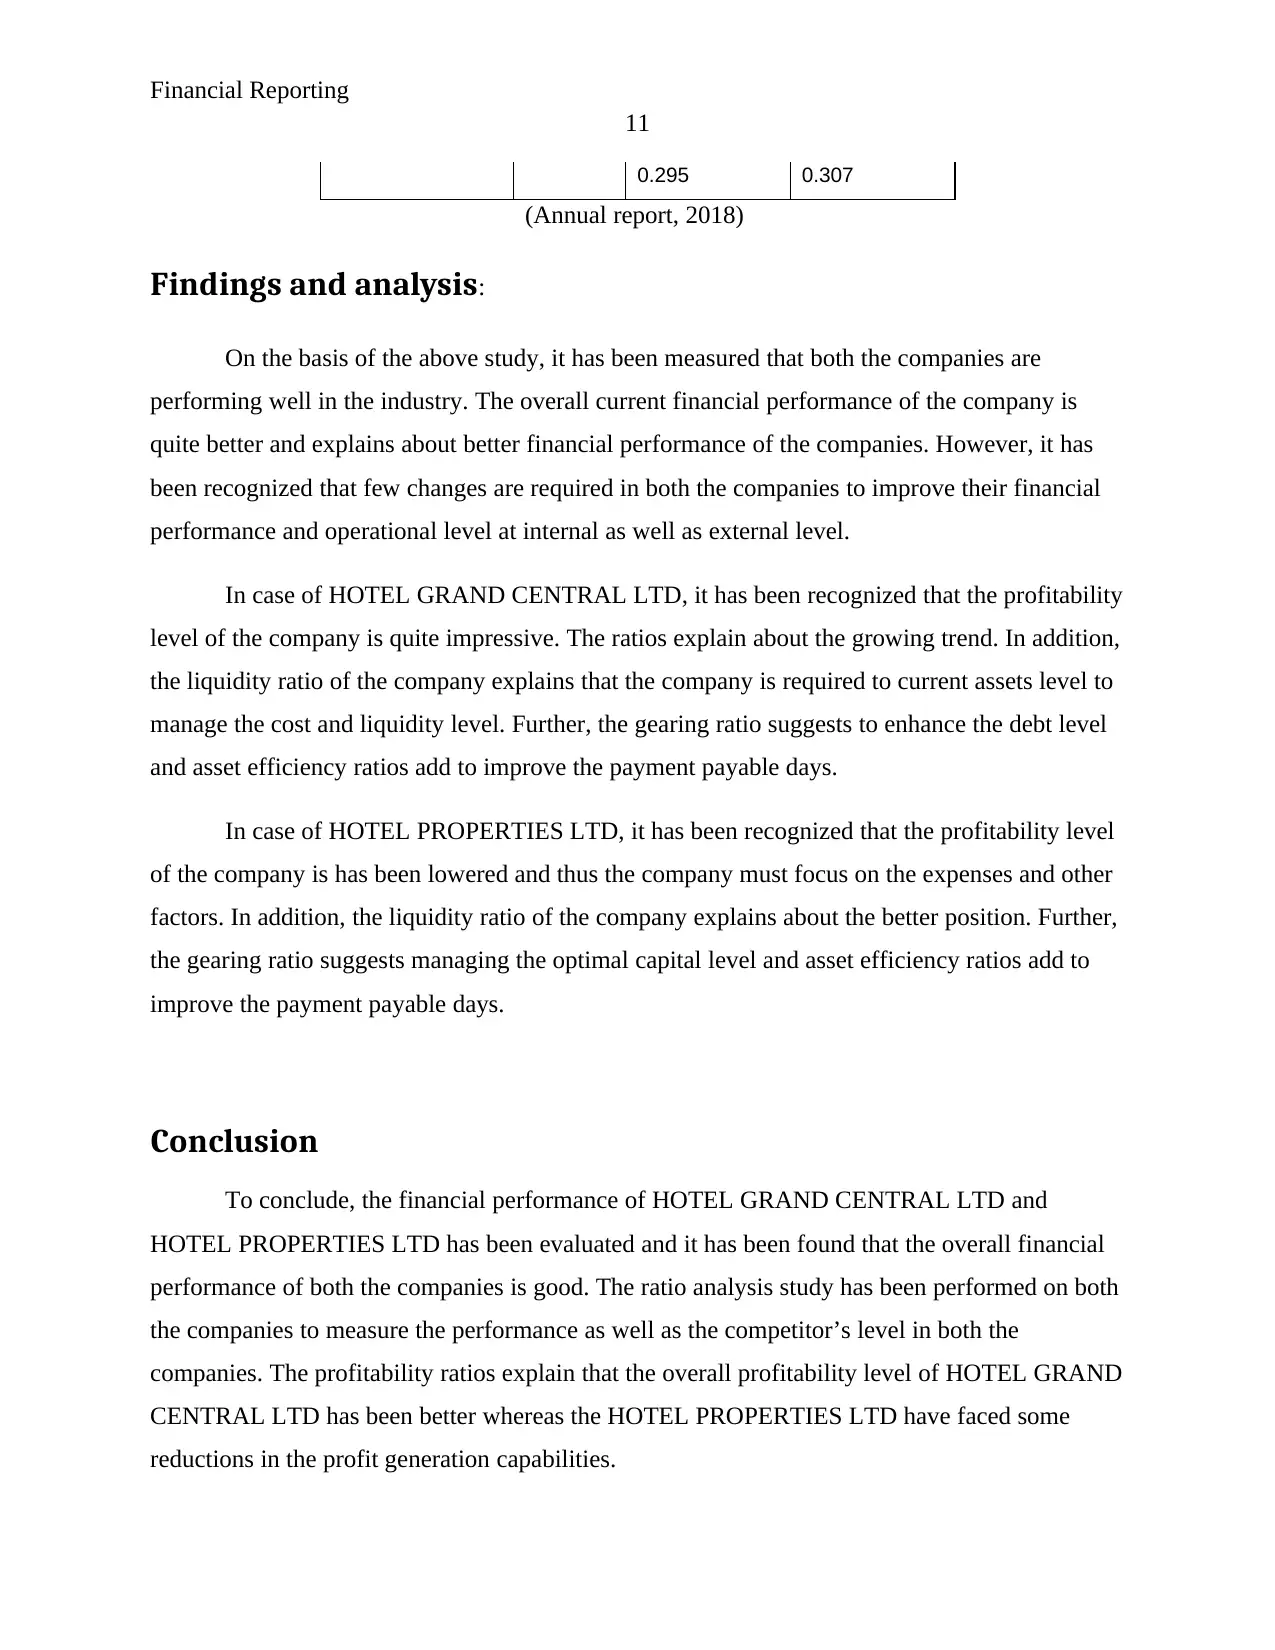
Gearing ratio of HOTEL PROPERTIES LTD has been measured and it has been found
that the company has improved the debt level from last year. Due to which, the gearing ratio of
the company has been improved. The current position of the company explains that company
must manage the optimal capital structure to reduce the risk and cost level.
Gearing Ratios 2016 2017
Gearing ratio 2016 2017
Long term
liabilities / 812,068,000 922,480,000
Capital employed 2,753,644,000 3,002,513,000
Answer: %
Paraphrase This Document
Need a fresh take? Get an instant paraphrase of this document with our AI Paraphraser
Financial Reporting
11
0.295 0.307
(Annual report, 2018)
Findings and analysis:
On the basis of the above study, it has been measured that both the companies are
performing well in the industry. The overall current financial performance of the company is
quite better and explains about better financial performance of the companies. However, it has
been recognized that few changes are required in both the companies to improve their financial
performance and operational level at internal as well as external level.
In case of HOTEL GRAND CENTRAL LTD, it has been recognized that the profitability
level of the company is quite impressive. The ratios explain about the growing trend. In addition,
the liquidity ratio of the company explains that the company is required to current assets level to
manage the cost and liquidity level. Further, the gearing ratio suggests to enhance the debt level
and asset efficiency ratios add to improve the payment payable days.
In case of HOTEL PROPERTIES LTD, it has been recognized that the profitability level
of the company is has been lowered and thus the company must focus on the expenses and other
factors. In addition, the liquidity ratio of the company explains about the better position. Further,
the gearing ratio suggests managing the optimal capital level and asset efficiency ratios add to
improve the payment payable days.
Conclusion
To conclude, the financial performance of HOTEL GRAND CENTRAL LTD and
HOTEL PROPERTIES LTD has been evaluated and it has been found that the overall financial
performance of both the companies is good. The ratio analysis study has been performed on both
the companies to measure the performance as well as the competitor’s level in both the
companies. The profitability ratios explain that the overall profitability level of HOTEL GRAND
CENTRAL LTD has been better whereas the HOTEL PROPERTIES LTD have faced some
reductions in the profit generation capabilities.
Financial Reporting
12
Further, the efficiency ratios have been measured and it has been found that the overall
performance of HOTEL PROPERTIES LTD is better in the market. In addition, the study has
been performed on various other ratios of both the companies and it has been measured that the
liquidity level of HOTEL PROPERTIES LTD is better as the company has managed the risk
level and cost level efficiently. Lastly, the gearing ratio explains that the performance of HOTEL
GRAND CENTRAL LTD is better.
The overall evaluation explains that the overall performance of both the companies is
average. It has been found that few changes are required to be done by the both the hotels. These
few changes would help the company to improve the performance and the financial level in the
industry. The analysis explains that the investment into both the companies would offer great
return to the investors of the company only if the investment is done for the longer period. Short
term investment could mislead the investment into both the companies. Thus it is required for the
investors to check the overall position and performance of both the companies to reach over a
better conclusion. On the basis of the study, long term investment is better option.
Reflection:
I have learnt various new techniques and their applying process in real life through this
report. Earlier, I Was very much aware about the ratio analysis study but it was a great
experience for me to apply these tools and techniques on real companies to measure the
investment opportunity in the companies. The application of ratio analysis on HOTEL GRAND
CENTRAL LTD and HOTEL PROPERTIES LTD was quite interesting as I get to know that
how the profitability, solvency, efficiency and liquidity ratios could be applied on the financial
statement of an organization and how these ratios help the financial analyst and other
professionals to reach over a conclusion.
Initially, I found it a tough task to identify the financial statement of 2 companies of 2
years but I eventually found it on annual report and the Morningstar (2018). Further, I prepare a
template to calculate all the ratios efficiently and I put all the data in the template file to calculate
the ratios. After that, according to my knowledge and with the help of some books and journals, I
analyzed the meaning of each ratio and apply that knowledge in evaluating the current
⊘ This is a preview!⊘
Do you want full access?
Subscribe today to unlock all pages.
Trusted by 1+ million students worldwide
1 out of 23
Related Documents


Your All-in-One AI-Powered Toolkit for Academic Success.
+13062052269
info@desklib.com
Available 24*7 on WhatsApp / Email
![[object Object]](/_next/static/media/star-bottom.7253800d.svg)
Unlock your academic potential
Copyright © 2020–2026 A2Z Services. All Rights Reserved. Developed and managed by ZUCOL.