Detailed Business Report: Analysis of Hotel Del Luna's Year 2 Results

Verified

Added on  2022/09/21

|11
|697
|15
Report
AI Summary
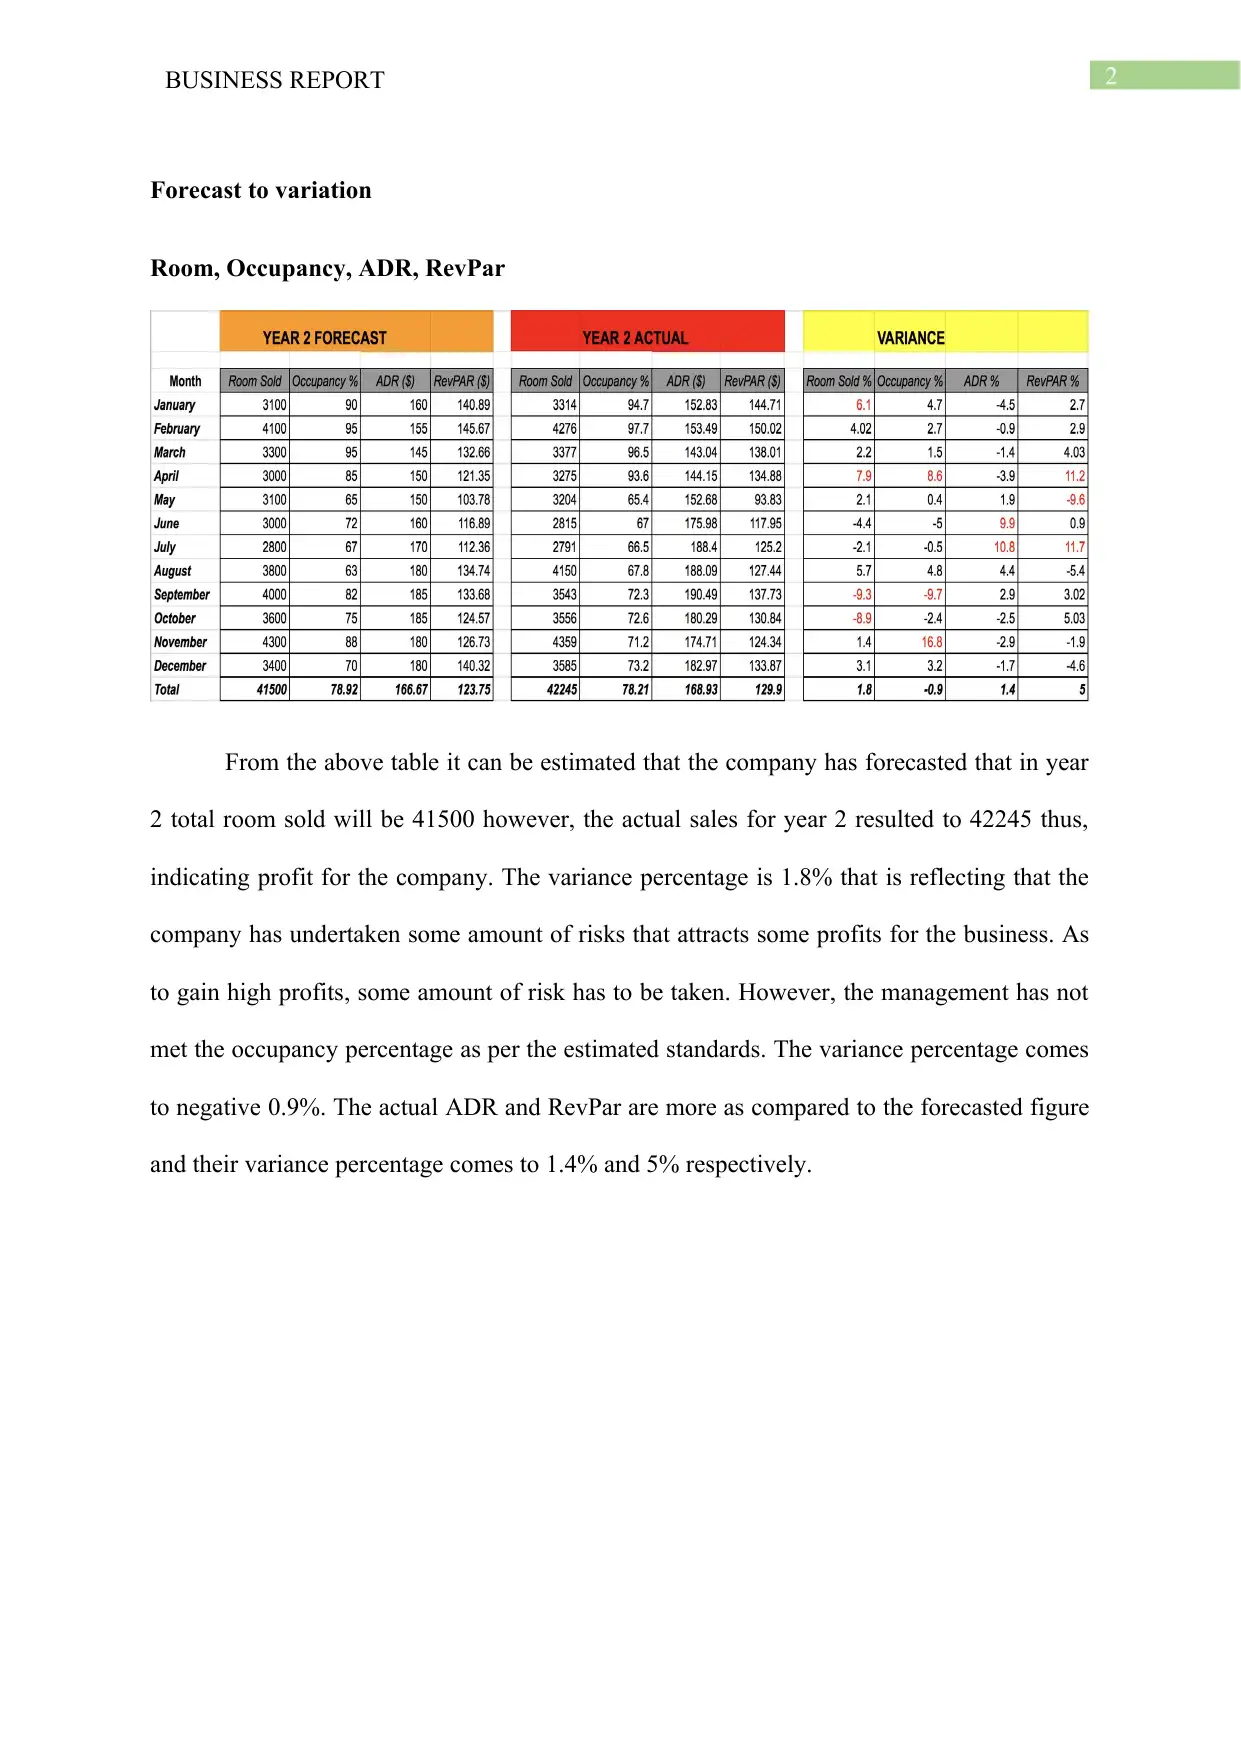
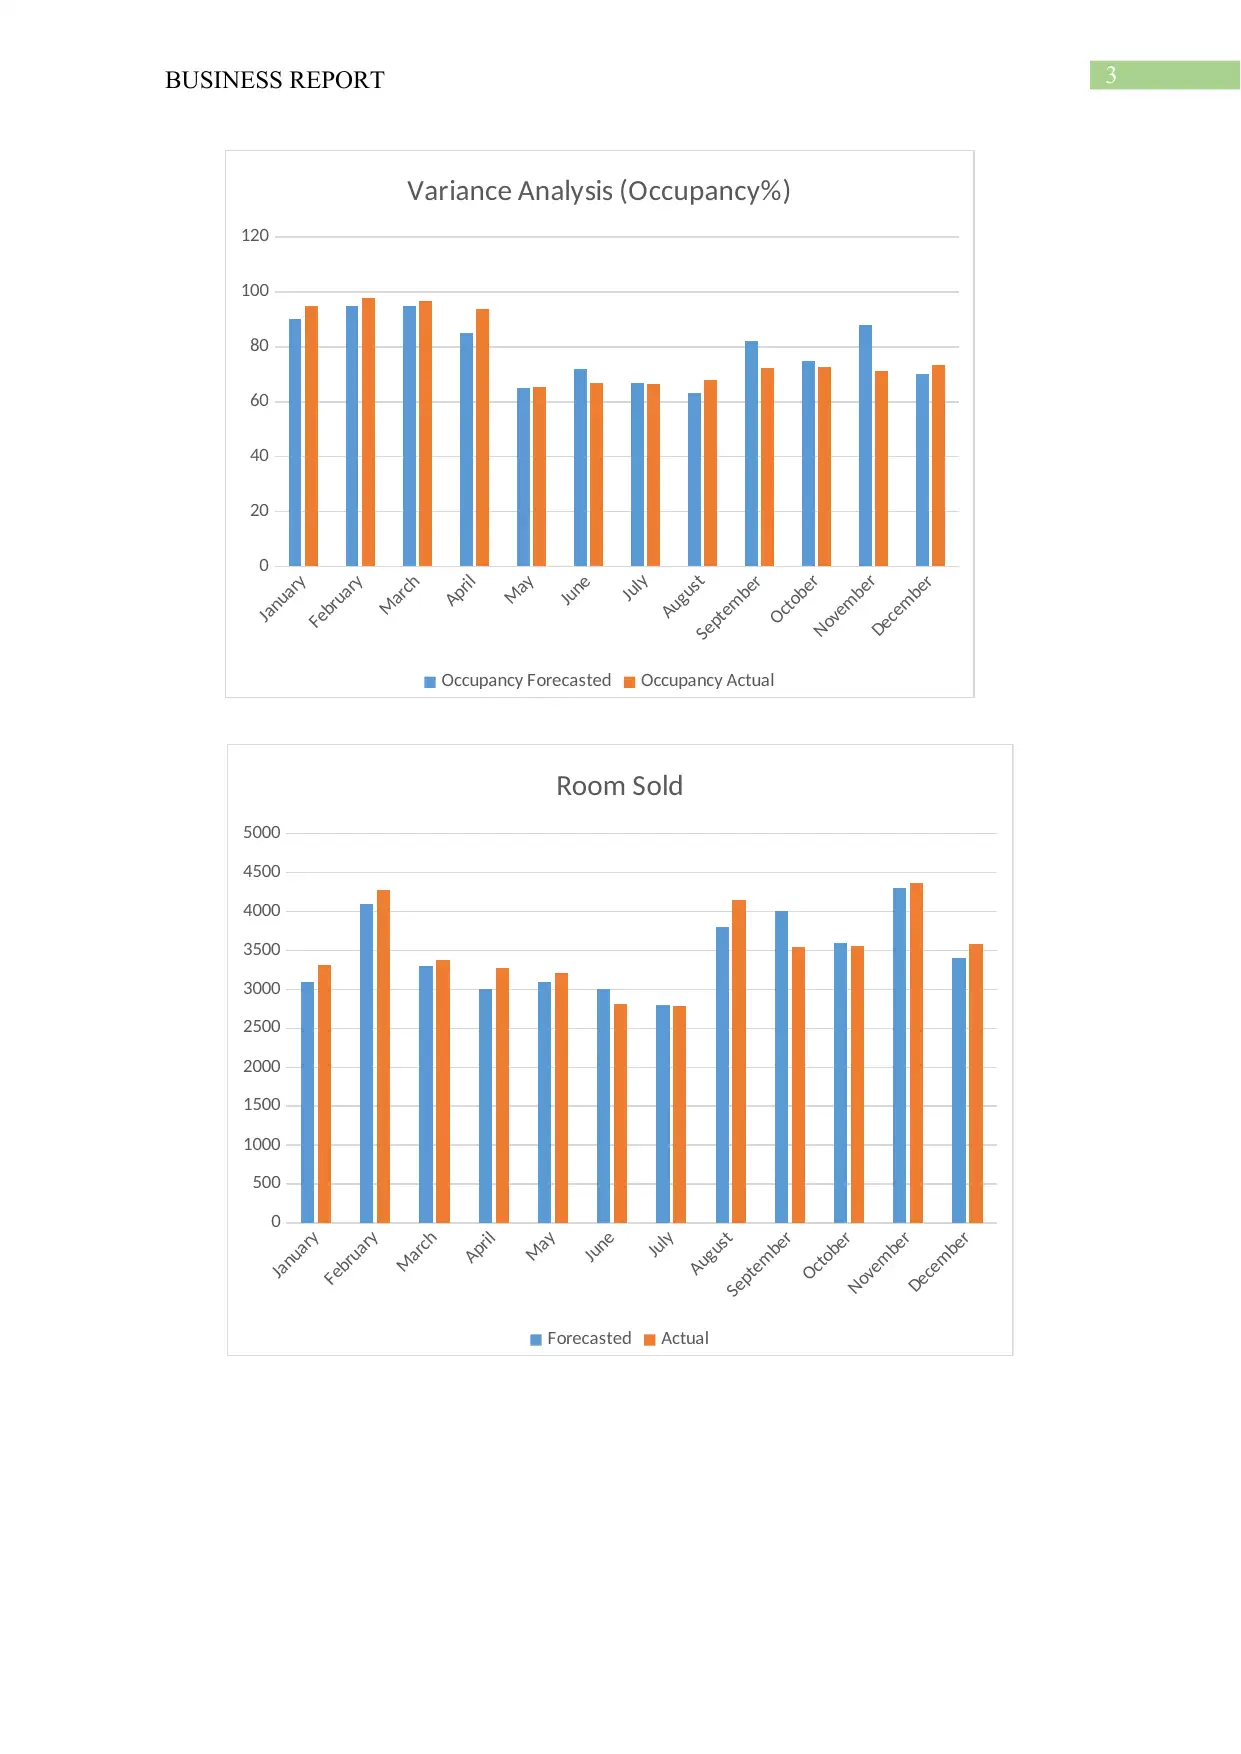
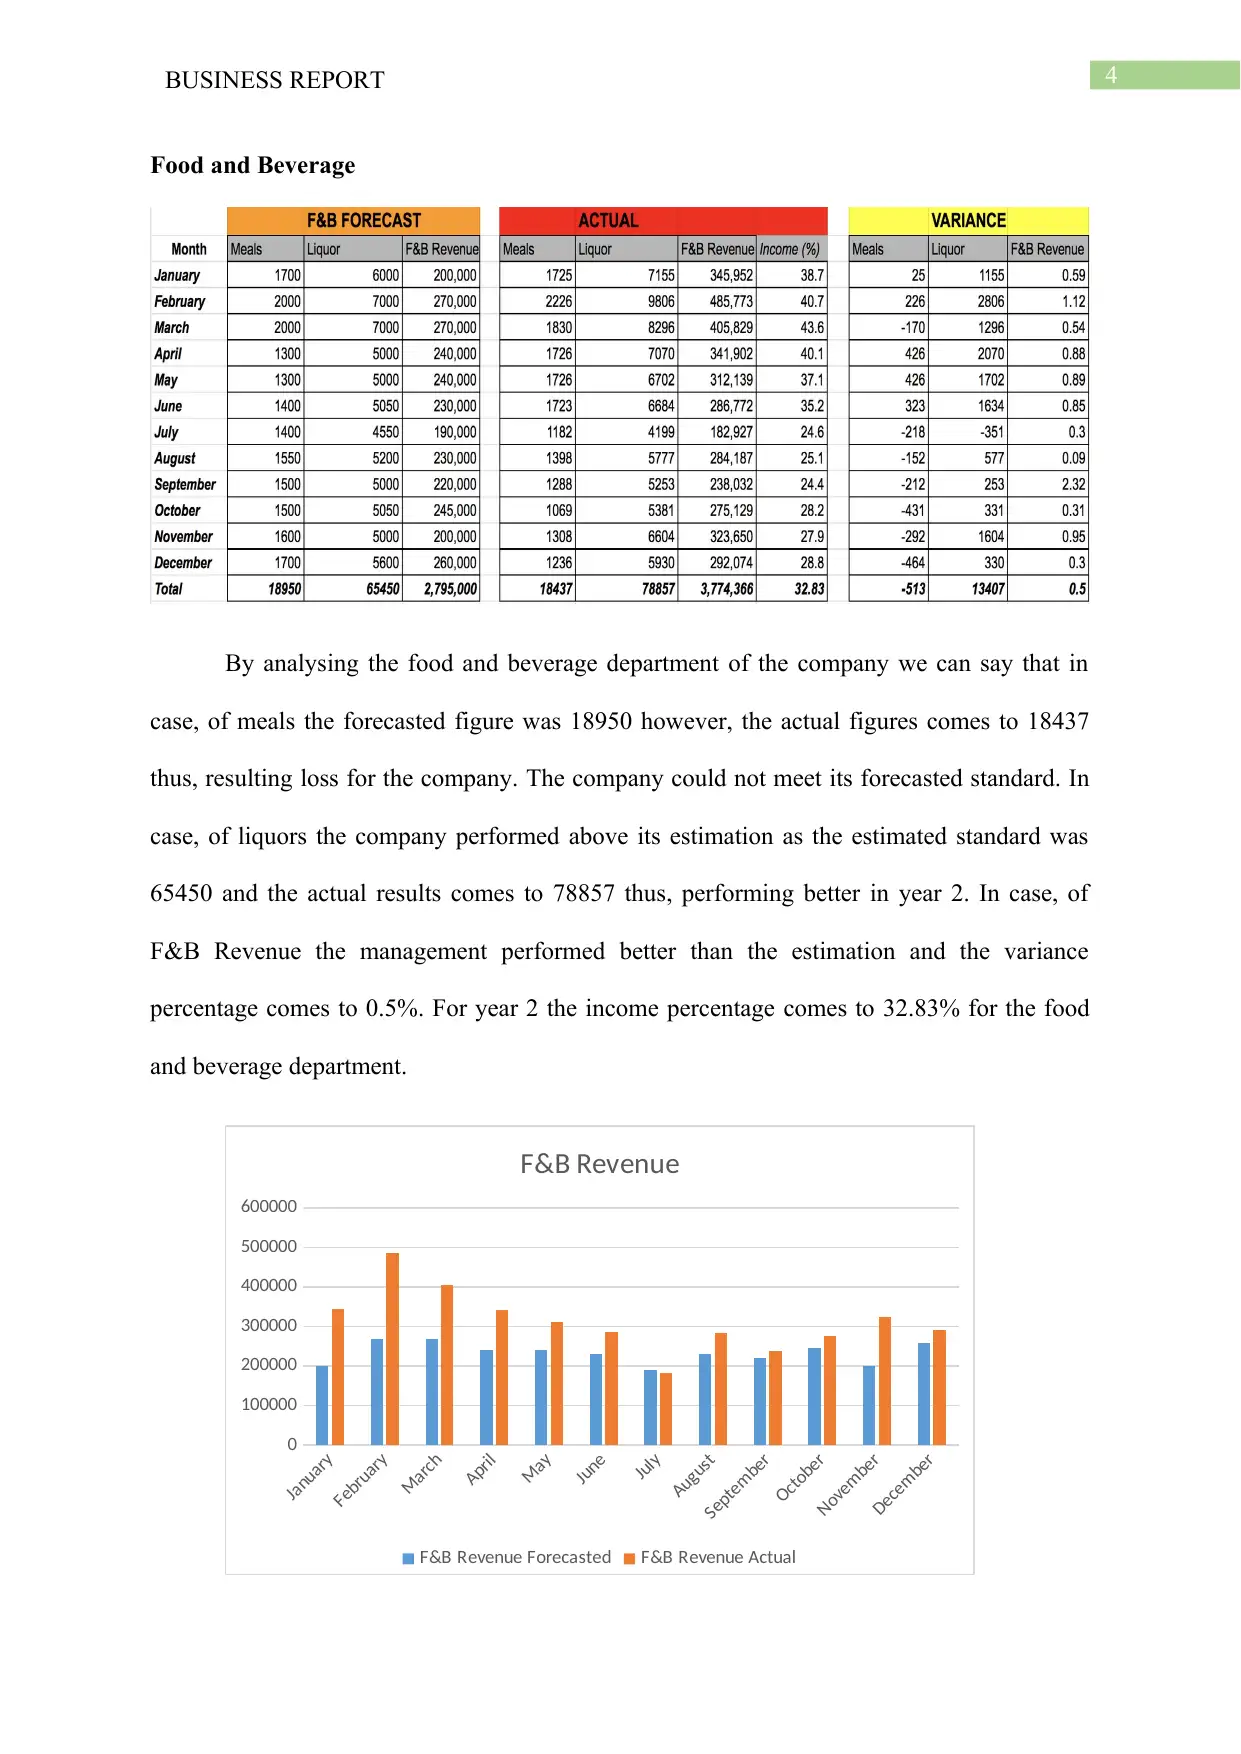
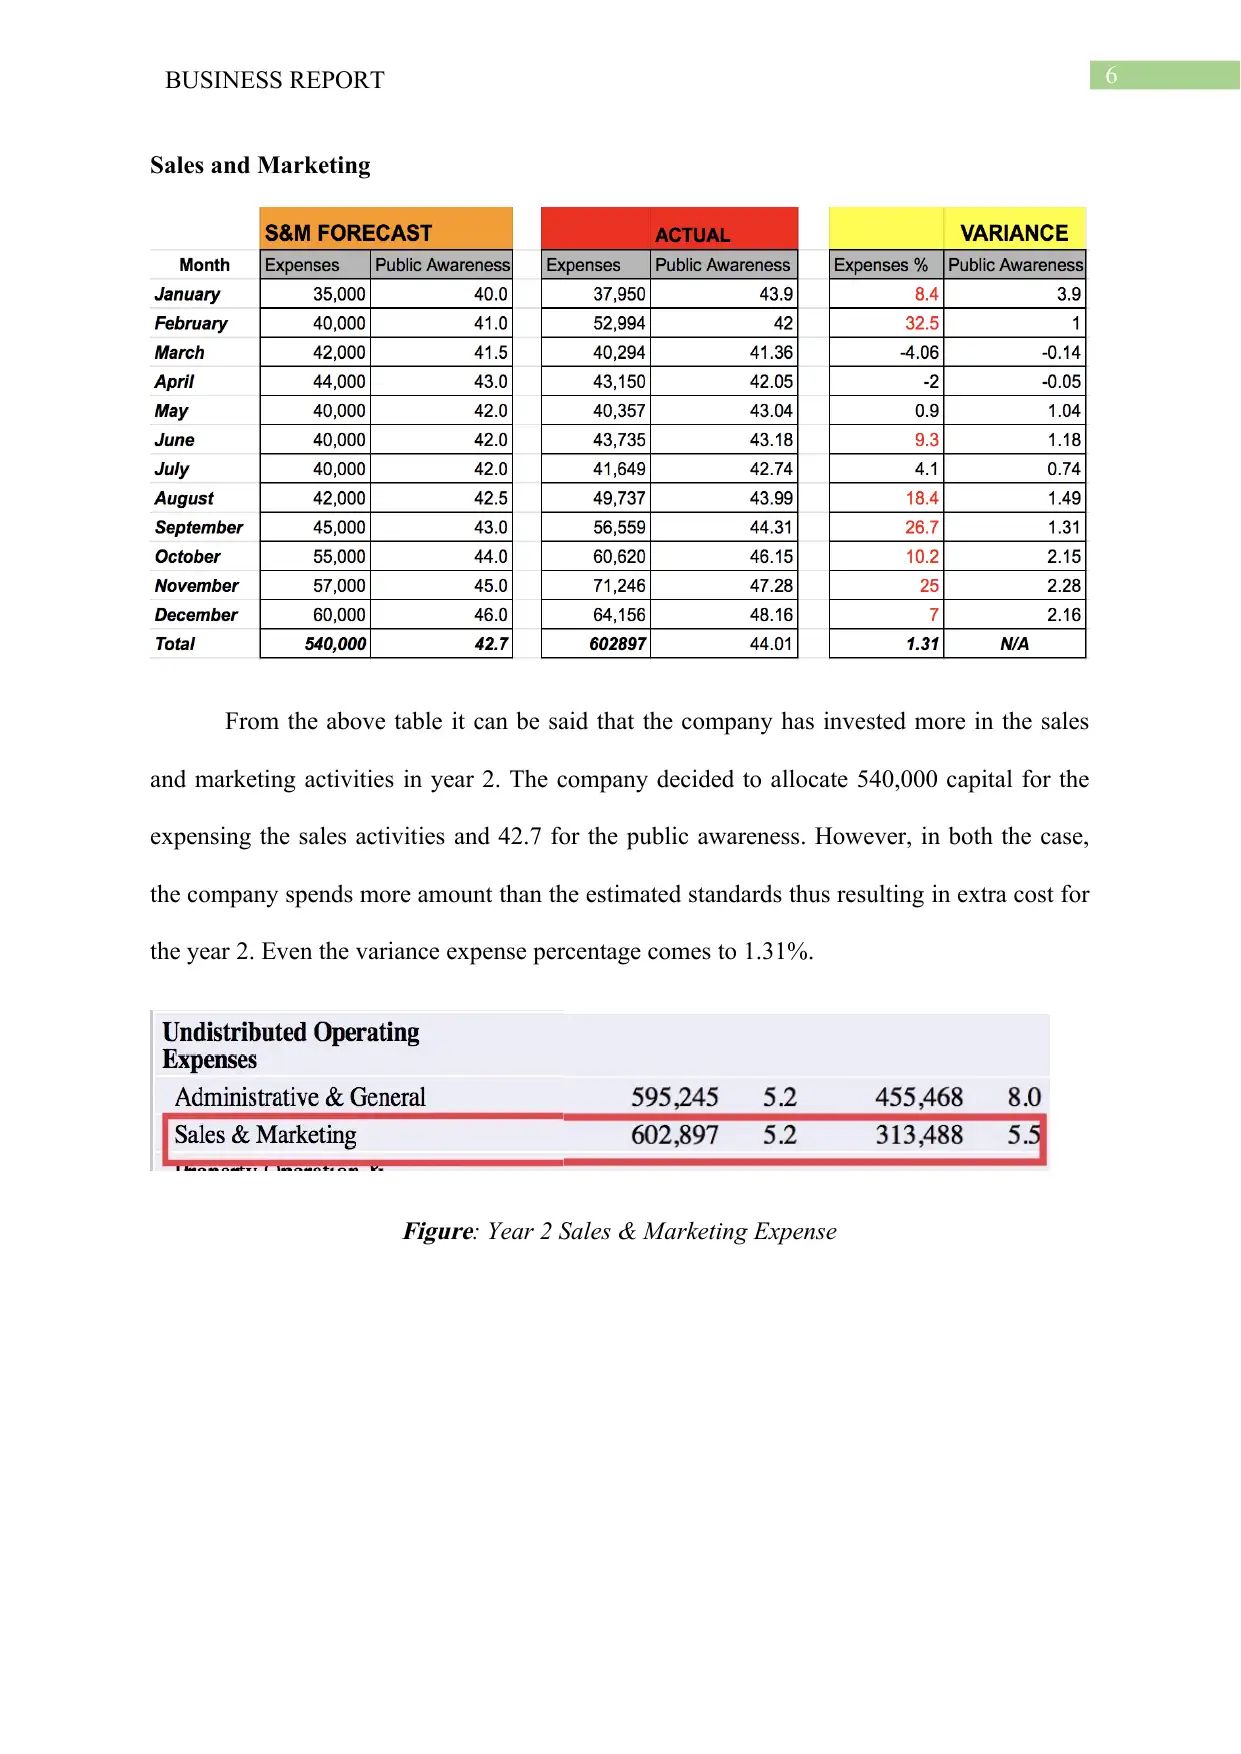
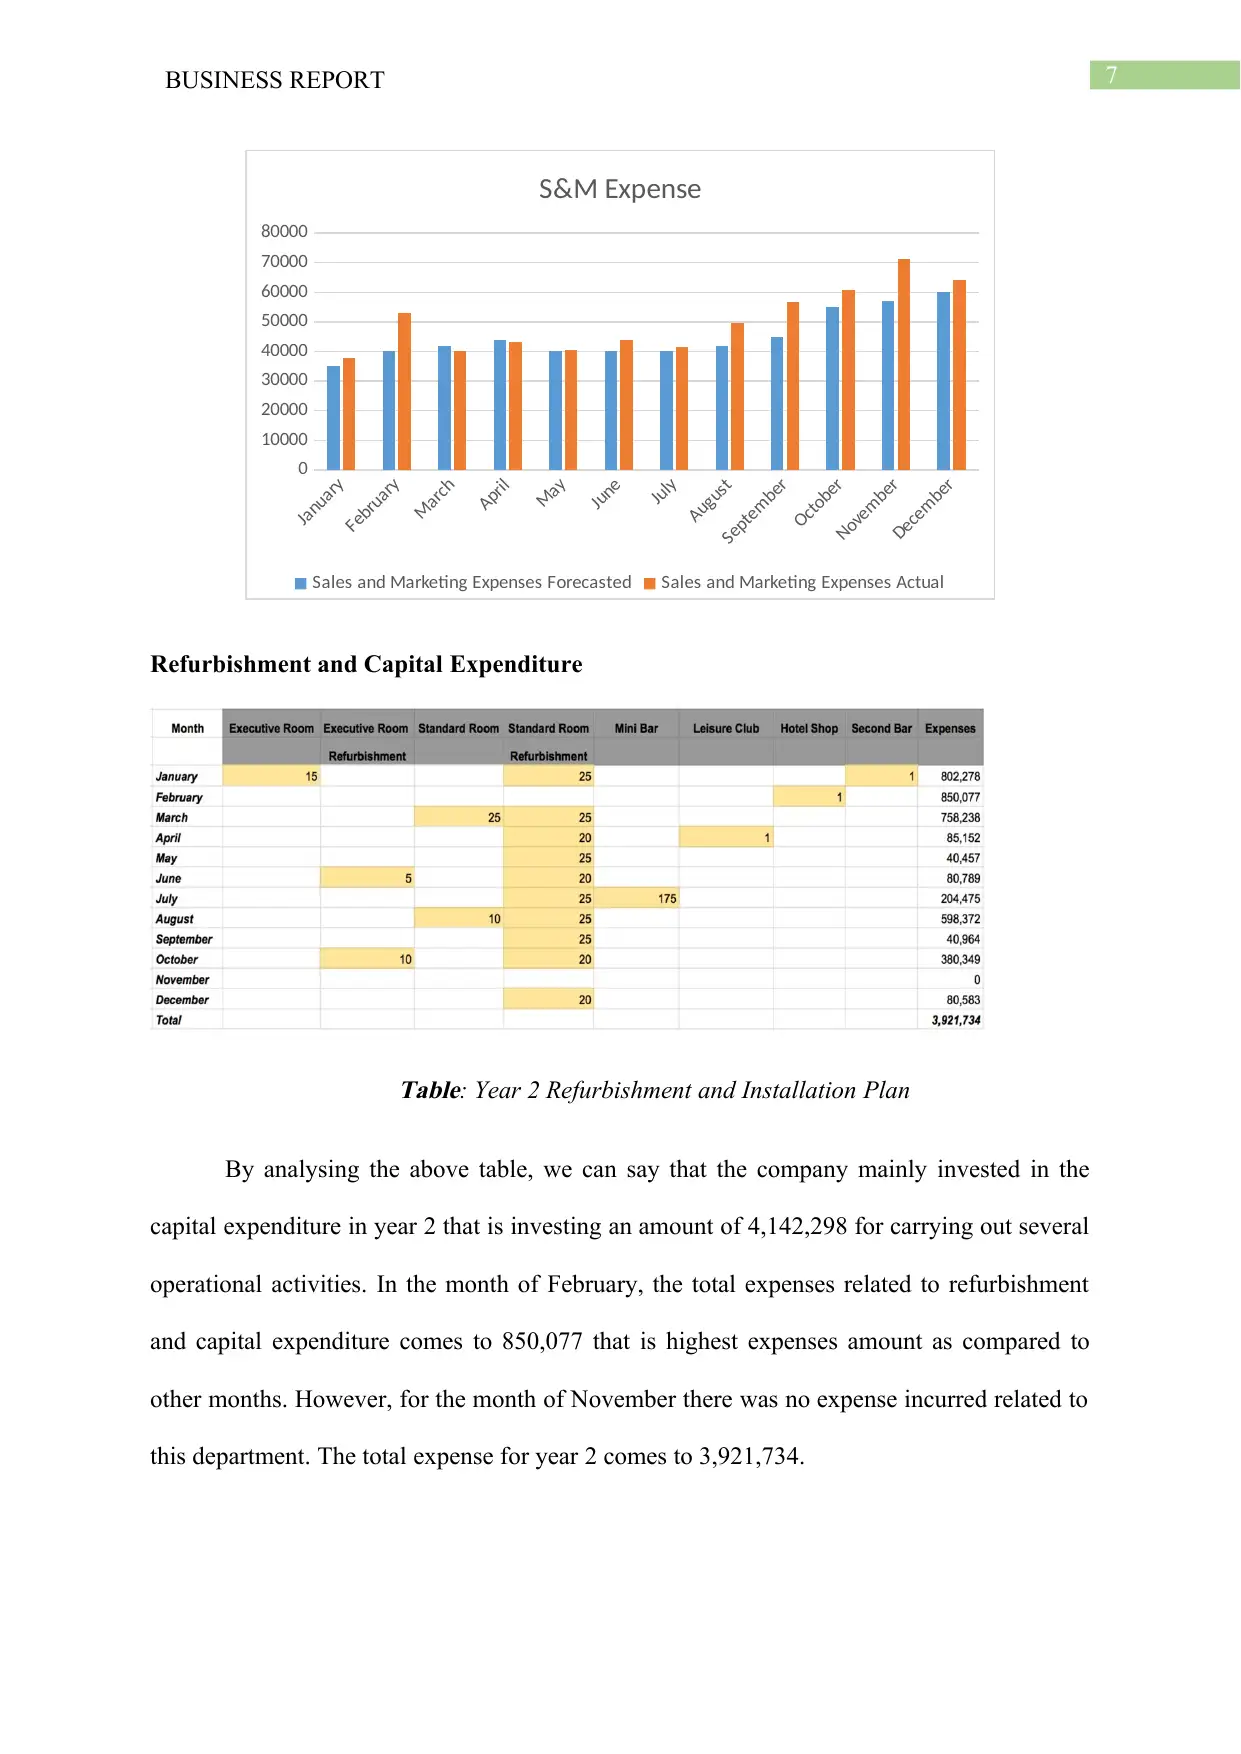
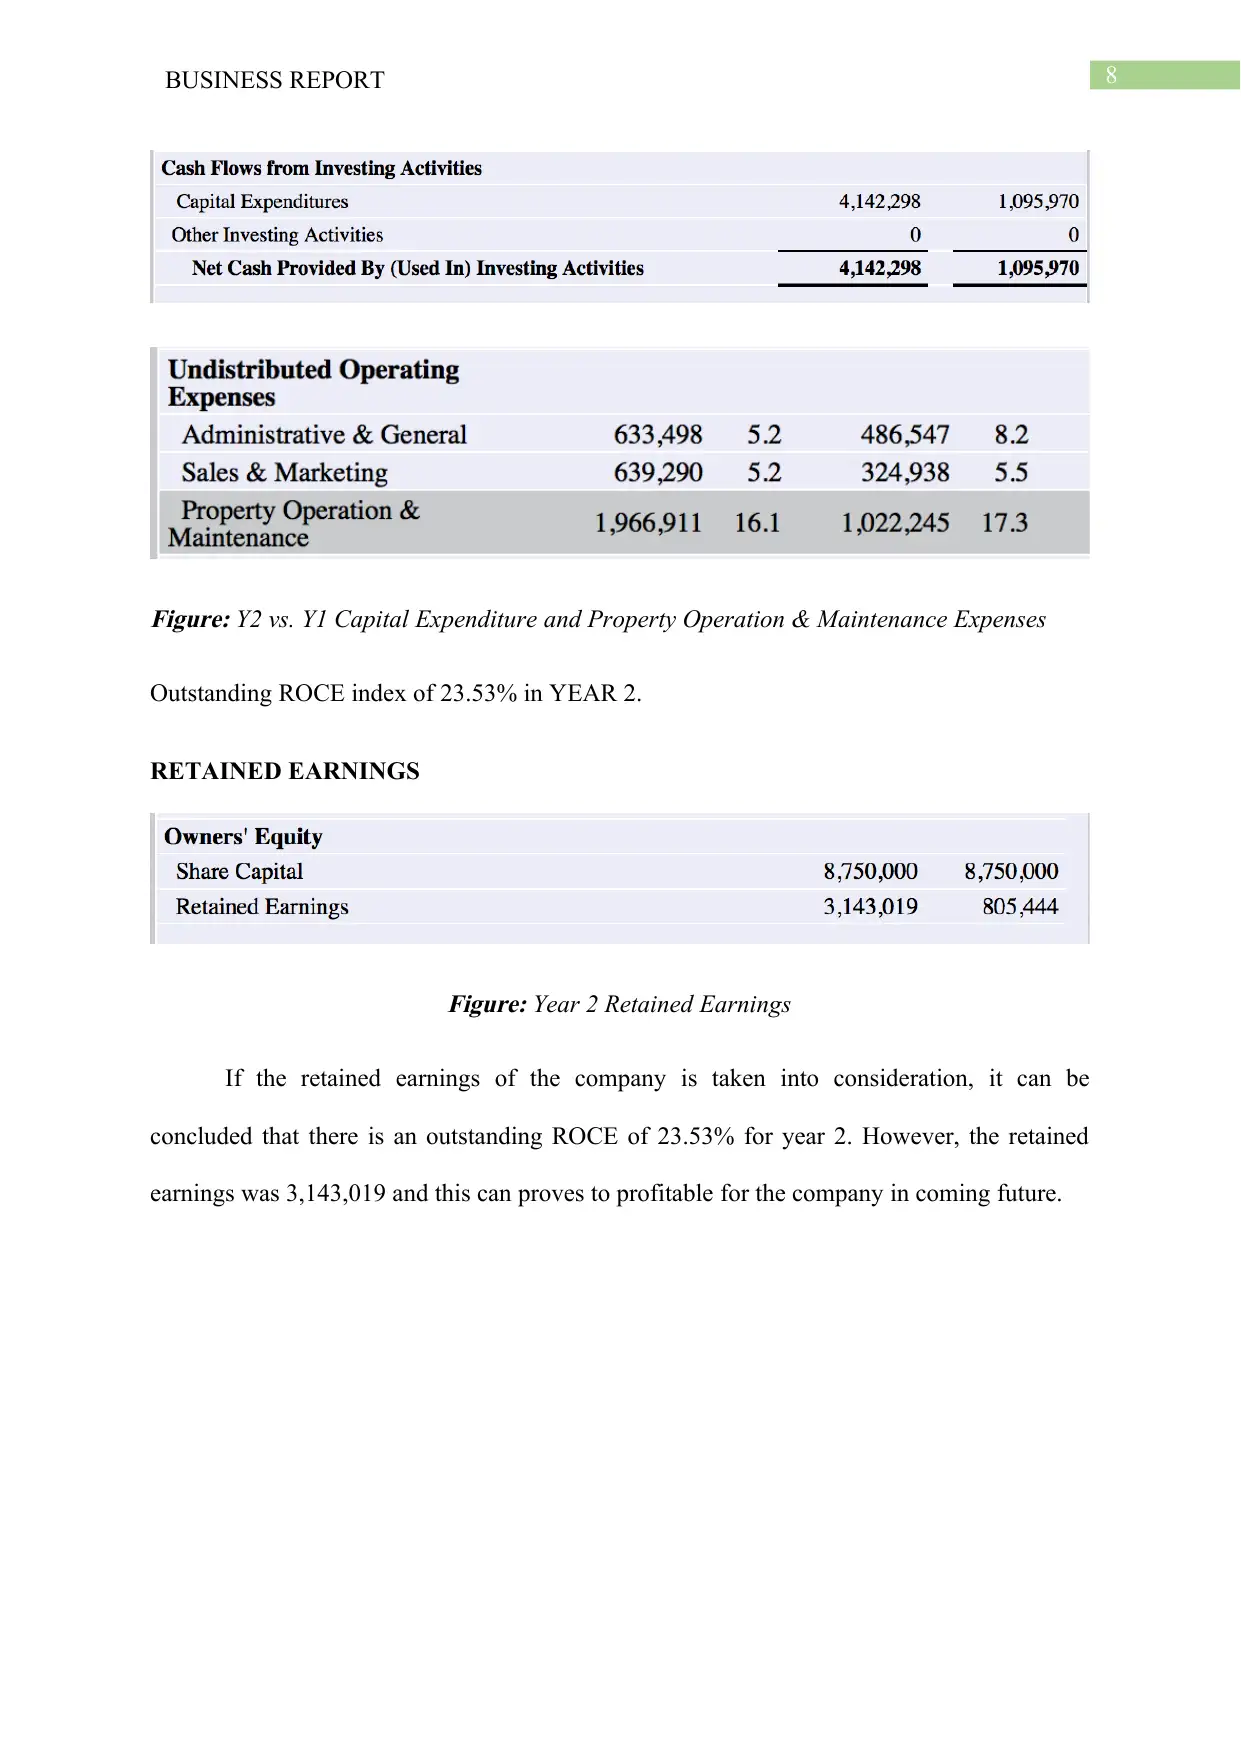
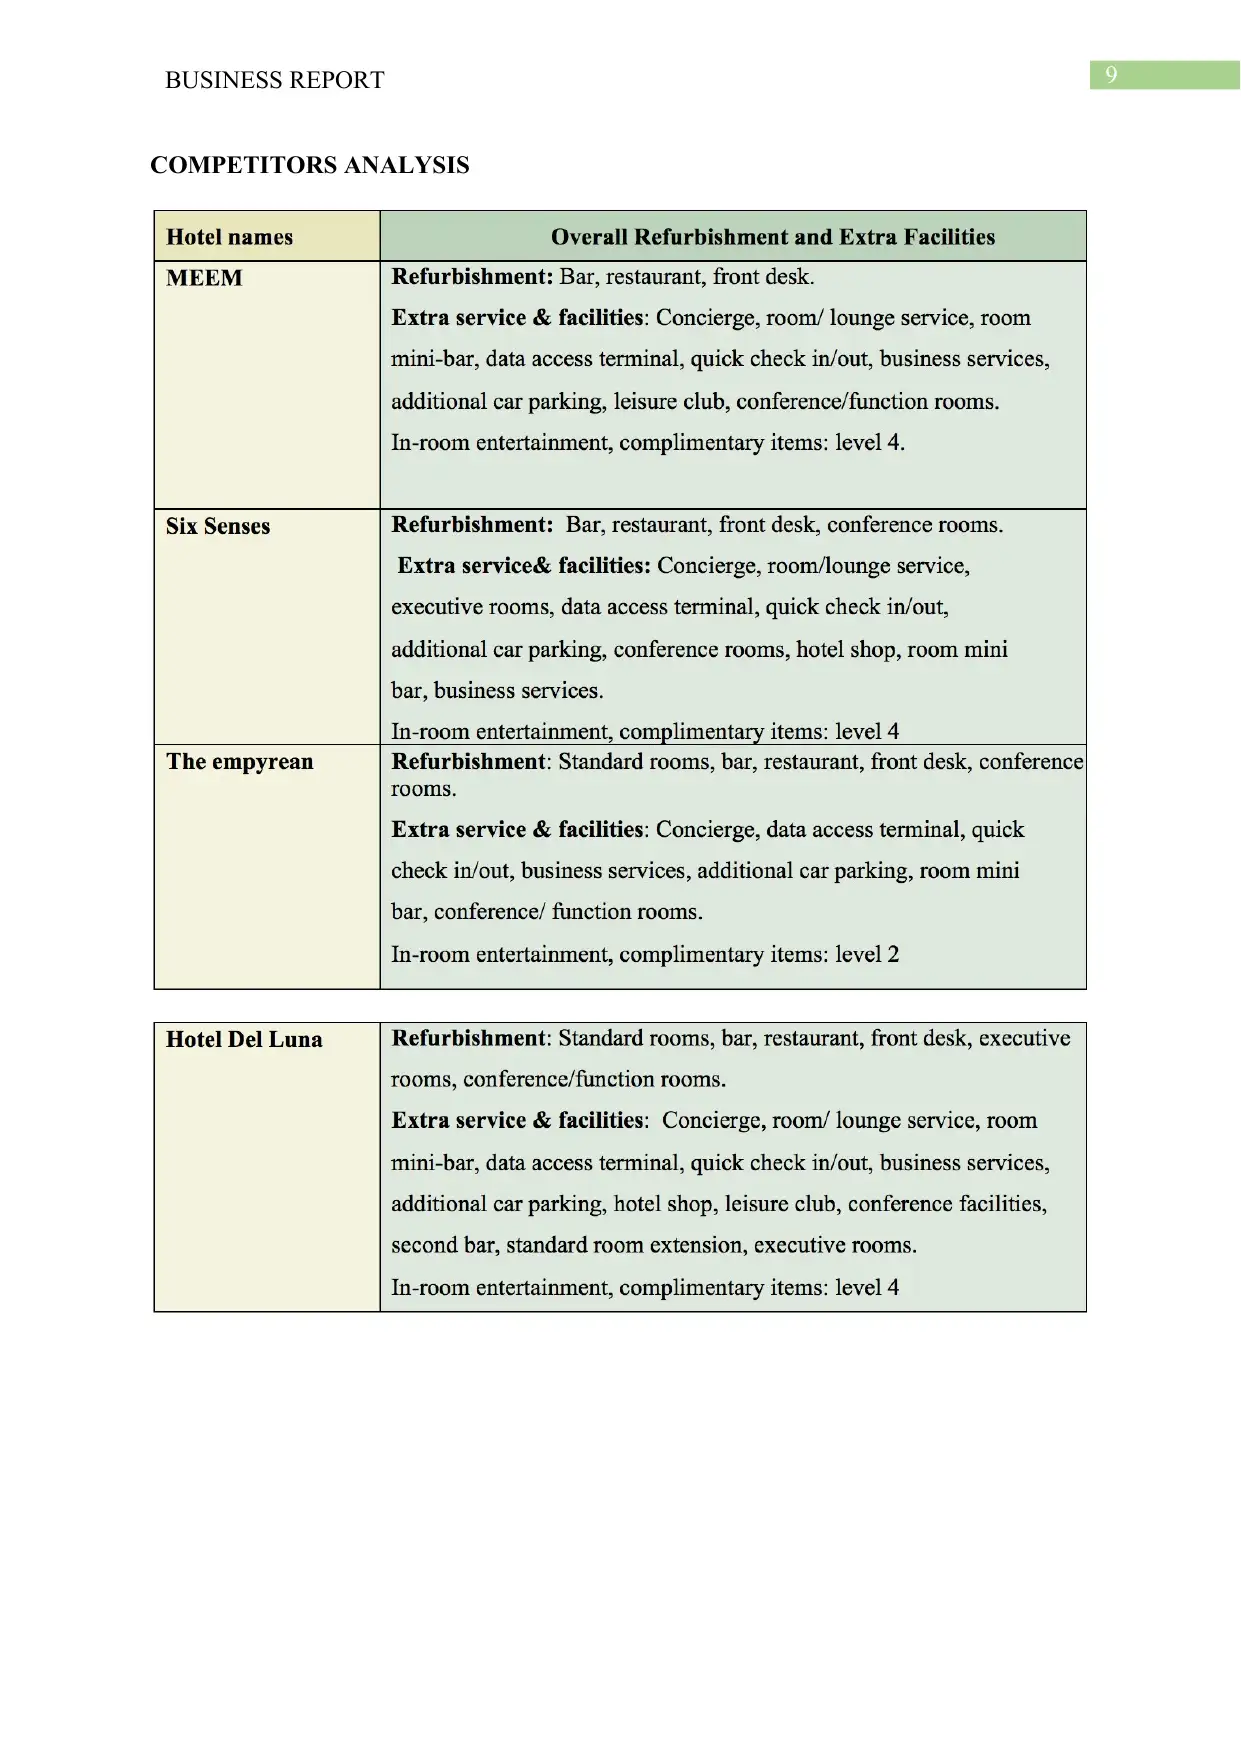
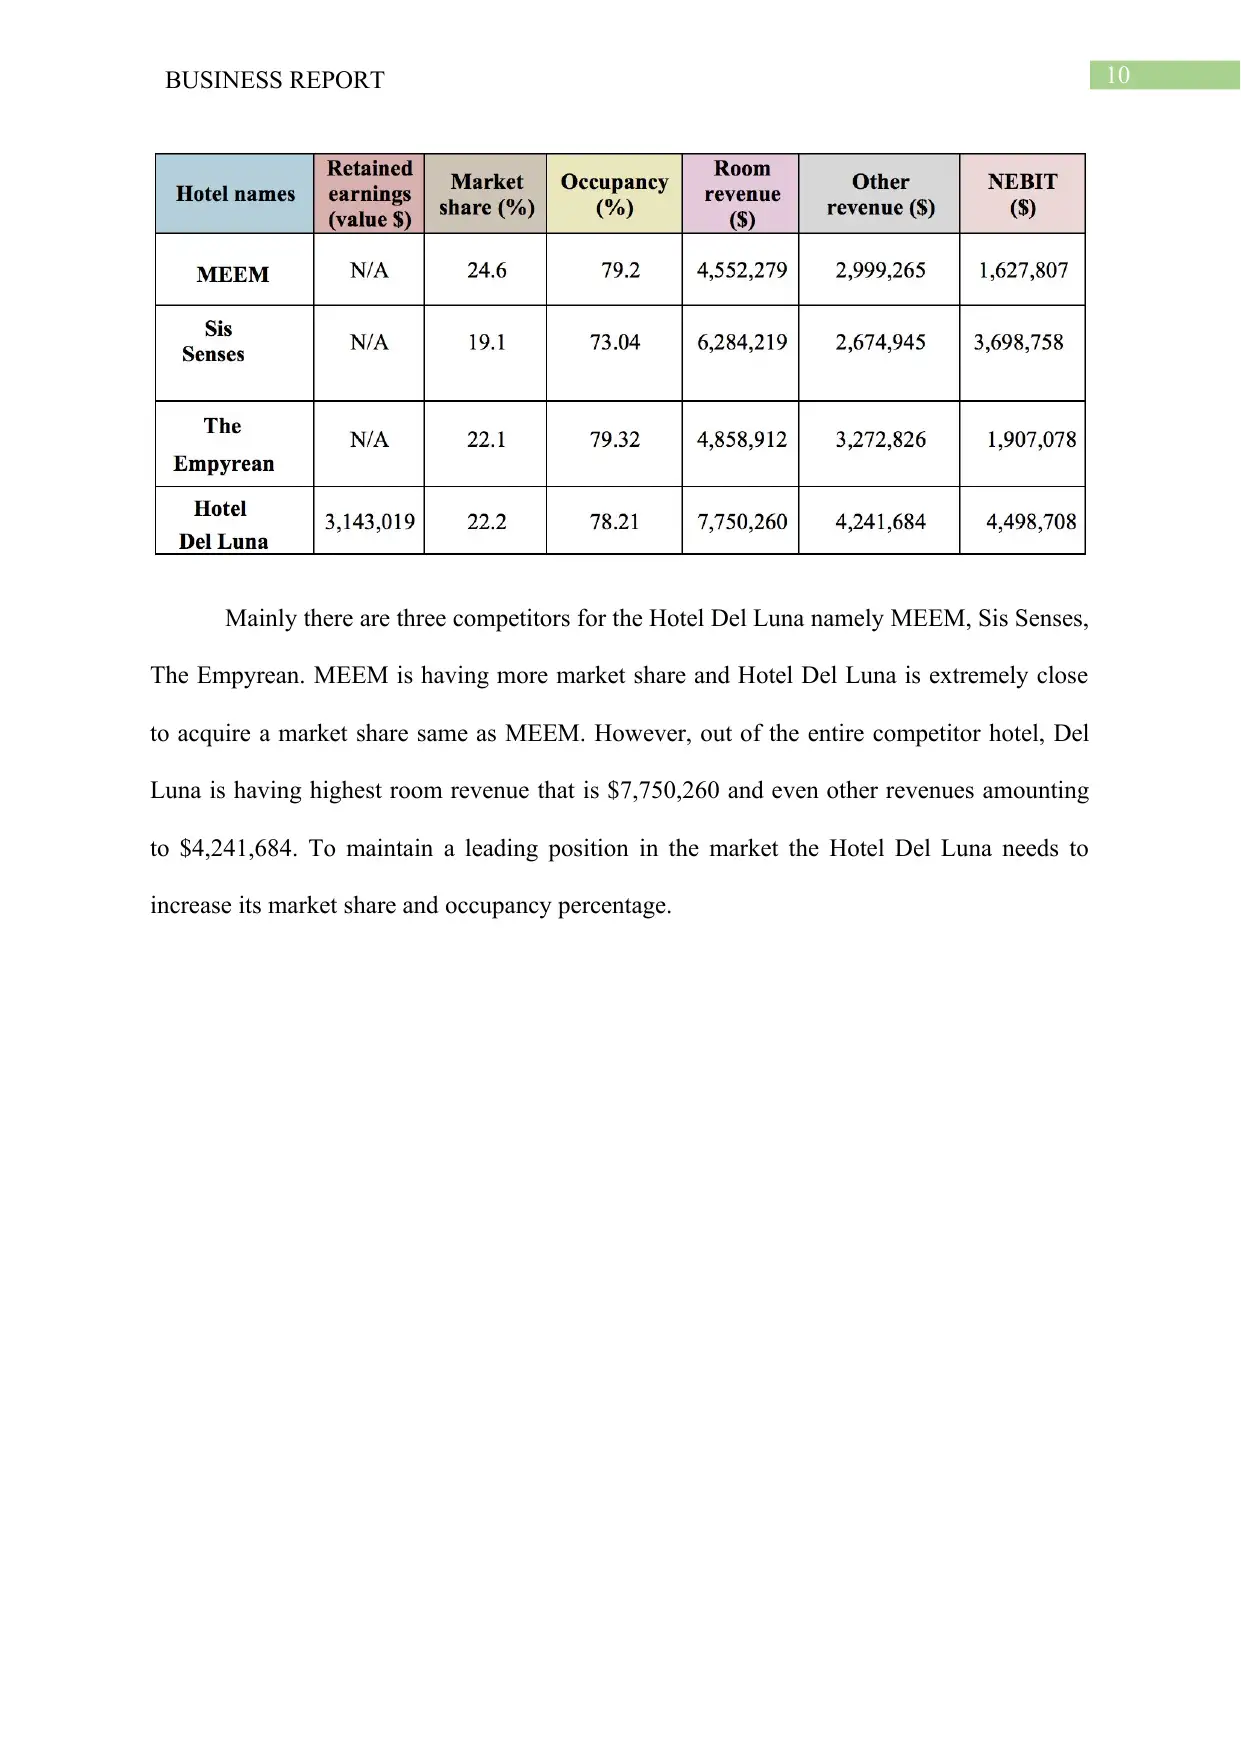
This business report provides a comprehensive analysis of Hotel Del Luna's Year 2 performance, focusing on key financial metrics and operational aspects. The report examines variations in room sales, occupancy rates, Average Daily Rate (ADR), and Revenue Per Available Room (RevPAR) compared to forecasts. It delves into the performance of the Food and Beverage department, analyzing sales figures and revenue contributions. Additionally, the report assesses the Sales and Marketing expenses, Refurbishment and Capital Expenditure, and Retained Earnings to provide a holistic view of the hotel's financial health. A competitor analysis is also included, comparing Hotel Del Luna's market position against key competitors. The analysis includes the use of tables, graphs, and figures to interpret and compare the numbers, offering a clear understanding of the hotel's strengths, weaknesses, and areas for improvement. The report highlights the importance of maintaining a leading position in the market by increasing market share and occupancy percentage, concluding with insights on the company's financial performance and future prospects.
Document Page
Running head: BUSINESS REPORT
BUSINESS REPORT
Name of the Student:
Name of the University:
Author Note:
tabler-icon-diamond-filled.svg

Secure Best Marks with AI Grader

Need help grading? Try our AI Grader for instant feedback on your assignments.
Document Page
1BUSINESS REPORT
Table of Contents
Forecast to variation...................................................................................................................2
Room, Occupancy, ADR, RevPar..........................................................................................2
Food and Beverage.................................................................................................................3
Sales and Marketing...............................................................................................................4
Refurbishment and Capital Expenditure................................................................................5
RETAINED EARNINGS.......................................................................................................6
COMPETITORS ANALYSIS...................................................................................................7
Document Page
2BUSINESS REPORT
Forecast to variation
Room, Occupancy, ADR, RevPar
From the above table it can be estimated that the company has forecasted that in year
2 total room sold will be 41500 however, the actual sales for year 2 resulted to 42245 thus,
indicating profit for the company. The variance percentage is 1.8% that is reflecting that the
company has undertaken some amount of risks that attracts some profits for the business. As
to gain high profits, some amount of risk has to be taken. However, the management has not
met the occupancy percentage as per the estimated standards. The variance percentage comes
to negative 0.9%. The actual ADR and RevPar are more as compared to the forecasted figure
and their variance percentage comes to 1.4% and 5% respectively.
Document Page
3BUSINESS REPORT
January
February
March
April
May
June
July
August
September
October
November
December
0
20
40
60
80
100
120
Variance Analysis (Occupancy%)
Occupancy Forecasted Occupancy Actual
January
February
March
April
May
June
July
August
September
October
November
December
0
500
1000
1500
2000
2500
3000
3500
4000
4500
5000
Room Sold
Forecasted Actual
tabler-icon-diamond-filled.svg

Secure Best Marks with AI Grader

Need help grading? Try our AI Grader for instant feedback on your assignments.
Document Page
4BUSINESS REPORT
Food and Beverage
By analysing the food and beverage department of the company we can say that in
case, of meals the forecasted figure was 18950 however, the actual figures comes to 18437
thus, resulting loss for the company. The company could not meet its forecasted standard. In
case, of liquors the company performed above its estimation as the estimated standard was
65450 and the actual results comes to 78857 thus, performing better in year 2. In case, of
F&B Revenue the management performed better than the estimation and the variance
percentage comes to 0.5%. For year 2 the income percentage comes to 32.83% for the food
and beverage department.
January
February
March
April
May
June
July
August
September
October
November
December
0
100000
200000
300000
400000
500000
600000
F&B Revenue
F&B Revenue Forecasted F&B Revenue Actual
Document Page
5BUSINESS REPORT
7%
10%
10%
9%
9%
8%7%
8%
8%
9%
7%
9%
Forecasted Monthly Contribution January
February
March
April
May
June
July
August
September
October
November
December
9%
13%
11%
9%
8%8%
5%
8%
6%
7%
9%
8%
Actual Monthly Contribution January
February
March
April
May
June
July
August
September
October
November
December
Document Page
6BUSINESS REPORT
Sales and Marketing
From the above table it can be said that the company has invested more in the sales
and marketing activities in year 2. The company decided to allocate 540,000 capital for the
expensing the sales activities and 42.7 for the public awareness. However, in both the case,
the company spends more amount than the estimated standards thus resulting in extra cost for
the year 2. Even the variance expense percentage comes to 1.31%.
Figure: Year 2 Sales & Marketing Expense
tabler-icon-diamond-filled.svg

Paraphrase This Document

Need a fresh take? Get an instant paraphrase of this document with our AI Paraphraser
Document Page
7BUSINESS REPORT
January
February
March
April
May
June
July
August
September
October
November
December
0
10000
20000
30000
40000
50000
60000
70000
80000
S&M Expense
Sales and Marketing Expenses Forecasted Sales and Marketing Expenses Actual
Refurbishment and Capital Expenditure
Table: Year 2 Refurbishment and Installation Plan
By analysing the above table, we can say that the company mainly invested in the
capital expenditure in year 2 that is investing an amount of 4,142,298 for carrying out several
operational activities. In the month of February, the total expenses related to refurbishment
and capital expenditure comes to 850,077 that is highest expenses amount as compared to
other months. However, for the month of November there was no expense incurred related to
this department. The total expense for year 2 comes to 3,921,734.
Document Page
8BUSINESS REPORT
Figure: Y2 vs. Y1 Capital Expenditure and Property Operation & Maintenance Expenses
Outstanding ROCE index of 23.53% in YEAR 2.
RETAINED EARNINGS
Figure: Year 2 Retained Earnings
If the retained earnings of the company is taken into consideration, it can be
concluded that there is an outstanding ROCE of 23.53% for year 2. However, the retained
earnings was 3,143,019 and this can proves to profitable for the company in coming future.
Document Page
9BUSINESS REPORT
COMPETITORS ANALYSIS
tabler-icon-diamond-filled.svg

Secure Best Marks with AI Grader

Need help grading? Try our AI Grader for instant feedback on your assignments.
Document Page
10BUSINESS REPORT
Mainly there are three competitors for the Hotel Del Luna namely MEEM, Sis Senses,
The Empyrean. MEEM is having more market share and Hotel Del Luna is extremely close
to acquire a market share same as MEEM. However, out of the entire competitor hotel, Del
Luna is having highest room revenue that is $7,750,260 and even other revenues amounting
to $4,241,684. To maintain a leading position in the market the Hotel Del Luna needs to
increase its market share and occupancy percentage.
chevron_up_icon
1 out of 11
circle_padding
hide_on_mobile
zoom_out_icon
logo.png

Your All-in-One AI-Powered Toolkit for Academic Success.

Available 24*7 on WhatsApp / Email

[object Object]