BIZ201 - Accounting for Decision Making: Crystal Hotel Case Study
VerifiedAdded on 2023/01/23
|10
|2171
|48
Case Study
AI Summary
This case study provides a comprehensive financial analysis of Crystal Hotel, examining its performance based on the provided financial statements. The analysis includes a vertical analysis of the income statement and balance sheet, comparing key items to industry benchmarks. Furthermore, the assessment calculates and interprets various financial ratios, including profitability, liquidity, solvency, and efficiency ratios, to evaluate the company's performance in different areas. The report provides recommendations for improvement, focusing on cost control, inventory management, and debtor policies. Additionally, it explores industry-specific benchmarks and analysis methods such as horizontal analysis and trend analysis to provide a holistic view of the company's financial standing and potential for future growth.
Running head: ACCOUNTING
Accounting
Name of the Student:
Name of the University:
Author’s Note:
Accounting
Name of the Student:
Name of the University:
Author’s Note:
Paraphrase This Document
Need a fresh take? Get an instant paraphrase of this document with our AI Paraphraser
1ACCOUNTING
Executive Summary
The main purpose of the assessment is to analyse the performance of Crystal Hotel and analyse
any changes which has taken place in the items which are represented in the financial statement
of the business. In order to analyse the changes vertical analysis is undertaken for the profit and
loss account as well as the balance sheet of the business. In addition to this, the assessment also
shows computation of key financial ratios which shows the performance of the company related
to different areas of performance such as liquidity, profitability, solvency and efficiency. The
assessment also provides some recommendations and alternative strategy which can be used by
the business for measuring the performance of the business.
2ACCOUNTING
Table of Contents
Part 2................................................................................................................................................3
Analysis of Financial Information...............................................................................................3
Comparative Analysis of Income Statement...............................................................................3
Analysis of Key Financial Ratios................................................................................................5
Additional industry specific benchmarks....................................................................................7
Conclusion.......................................................................................................................................7
Reference.........................................................................................................................................9
⊘ This is a preview!⊘
Do you want full access?
Subscribe today to unlock all pages.
Trusted by 1+ million students worldwide
3ACCOUNTING
Part 2
Analysis of Financial Information
The financial information which is being considered for the business of Crystal Hotel
consists of the income statement and the balance sheet of the company. The income statement
and the balance sheet form an important part of the general purpose financial statement as the
same are used investors and other stakeholders for taking major decisions for the business.
Vertical analysis is a tool which is available to the management for estimating percentage for
different items which is done on the basis of predetermined rates (Eyraud & Lusinyan, 2013).
The tool is widely used by businesses for identifying the level of growth in the business and also
for making appropriate comparisons with previous year performance. The case shows that
critical analysis is conducted for Crystal Hotel for analyzing the development in the business
(Vilar, Rebelo & Noriega, 2014). It is to be noted that vertical analysis always considers a base
on the basis of the same percentage of different items are shown. In the case of Crystal Hotel, the
total revenue which is generated by the business while the figure of total asset is considered for
vertical analysis and also the same is compared with the industry standards.
Comparative Analysis of Income Statement
This is another analysis option which is available to a business which effectively depicts
the process for deriving revenue and keeping a track of the expenses of the business. As per the
estimates which is shown in the income statement of Crystal Hotel, it is clear that the
management generates maximum revenue of 61.88% from room occupancy. The revenue which
is generated from room is shown to be more than industry average which is depicted to be 51%.
The average price of the product which is offered by the company.
Paraphrase This Document
Need a fresh take? Get an instant paraphrase of this document with our AI Paraphraser
4ACCOUNTING
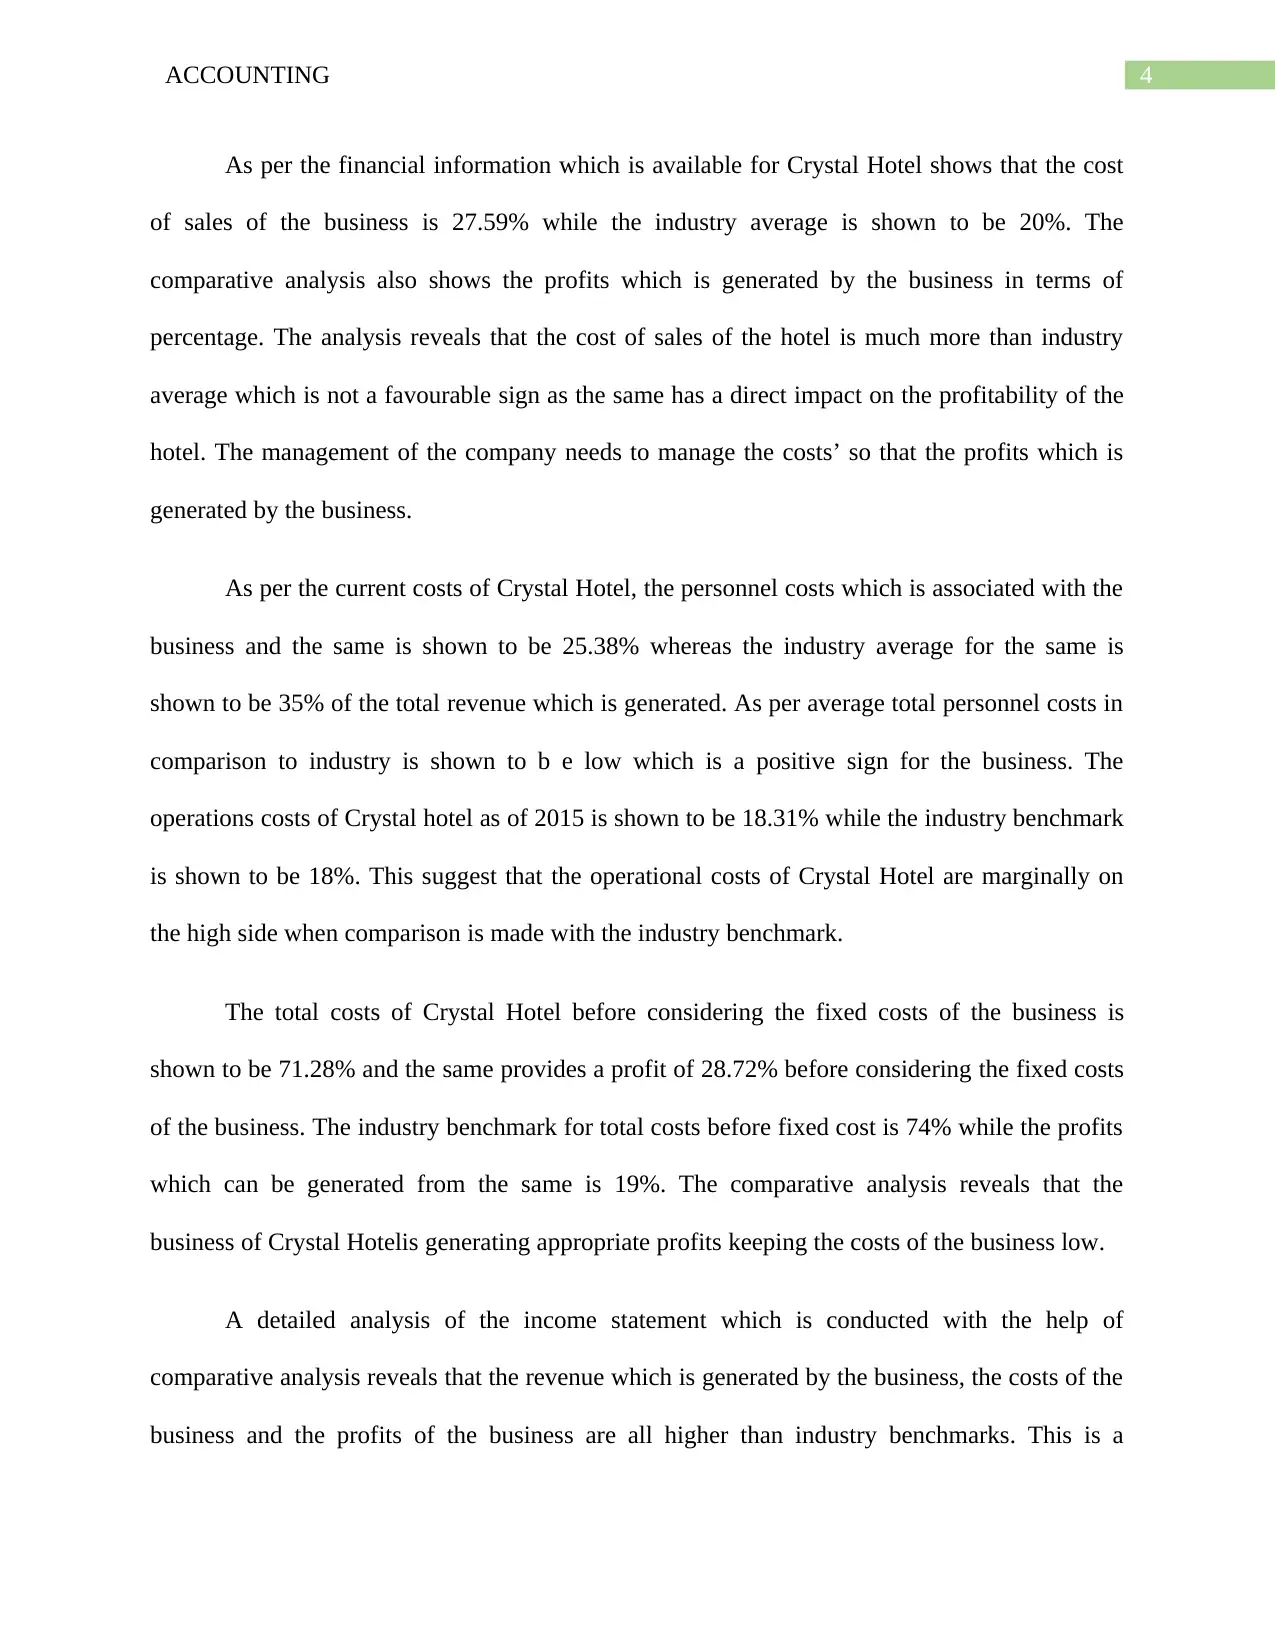
As per the financial information which is available for Crystal Hotel shows that the cost
of sales of the business is 27.59% while the industry average is shown to be 20%. The
comparative analysis also shows the profits which is generated by the business in terms of
percentage. The analysis reveals that the cost of sales of the hotel is much more than industry
average which is not a favourable sign as the same has a direct impact on the profitability of the
hotel. The management of the company needs to manage the costs’ so that the profits which is
generated by the business.
As per the current costs of Crystal Hotel, the personnel costs which is associated with the
business and the same is shown to be 25.38% whereas the industry average for the same is
shown to be 35% of the total revenue which is generated. As per average total personnel costs in
comparison to industry is shown to b e low which is a positive sign for the business. The
operations costs of Crystal hotel as of 2015 is shown to be 18.31% while the industry benchmark
is shown to be 18%. This suggest that the operational costs of Crystal Hotel are marginally on
the high side when comparison is made with the industry benchmark.
The total costs of Crystal Hotel before considering the fixed costs of the business is
shown to be 71.28% and the same provides a profit of 28.72% before considering the fixed costs
of the business. The industry benchmark for total costs before fixed cost is 74% while the profits
which can be generated from the same is 19%. The comparative analysis reveals that the
business of Crystal Hotelis generating appropriate profits keeping the costs of the business low.
A detailed analysis of the income statement which is conducted with the help of
comparative analysis reveals that the revenue which is generated by the business, the costs of the
business and the profits of the business are all higher than industry benchmarks. This is a
5ACCOUNTING
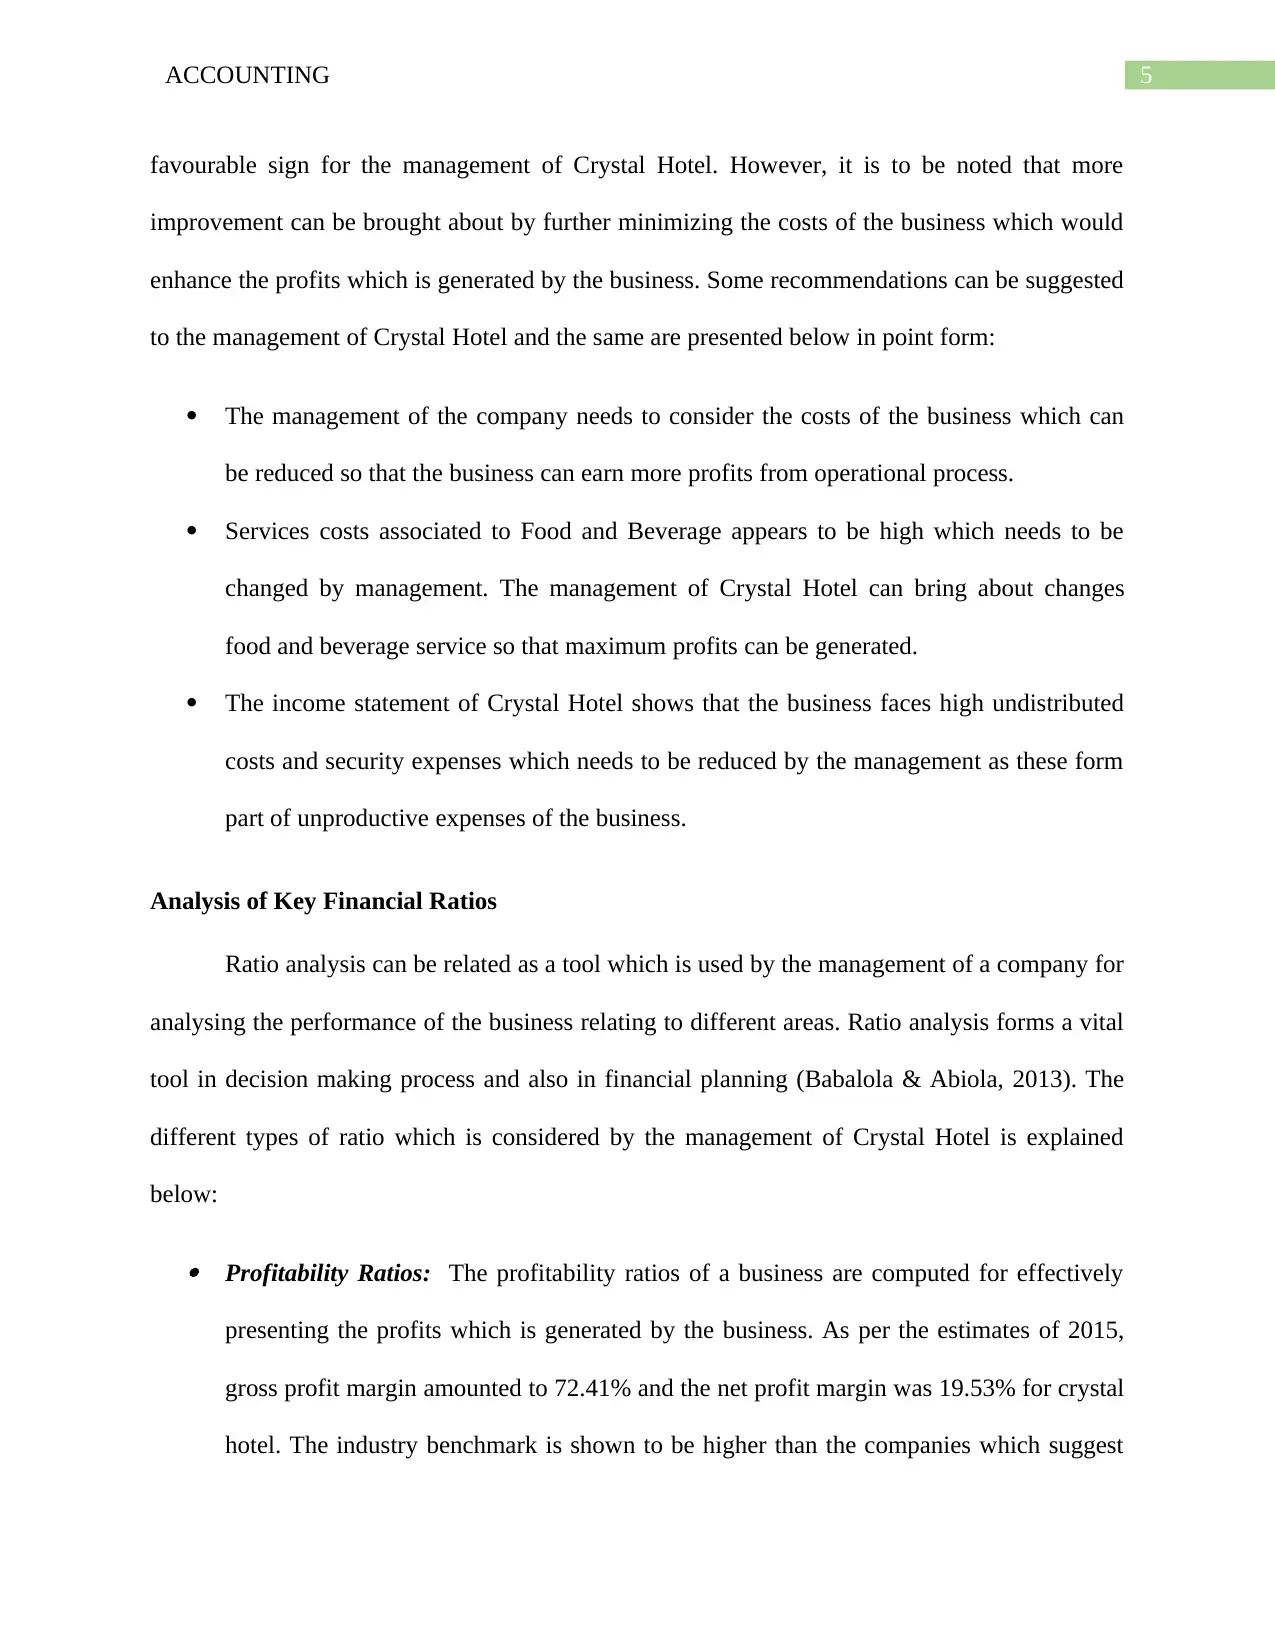
favourable sign for the management of Crystal Hotel. However, it is to be noted that more
improvement can be brought about by further minimizing the costs of the business which would
enhance the profits which is generated by the business. Some recommendations can be suggested
to the management of Crystal Hotel and the same are presented below in point form:
The management of the company needs to consider the costs of the business which can
be reduced so that the business can earn more profits from operational process.
Services costs associated to Food and Beverage appears to be high which needs to be
changed by management. The management of Crystal Hotel can bring about changes
food and beverage service so that maximum profits can be generated.
The income statement of Crystal Hotel shows that the business faces high undistributed
costs and security expenses which needs to be reduced by the management as these form
part of unproductive expenses of the business.
Analysis of Key Financial Ratios
Ratio analysis can be related as a tool which is used by the management of a company for
analysing the performance of the business relating to different areas. Ratio analysis forms a vital
tool in decision making process and also in financial planning (Babalola & Abiola, 2013). The
different types of ratio which is considered by the management of Crystal Hotel is explained
below:
Profitability Ratios: The profitability ratios of a business are computed for effectively
presenting the profits which is generated by the business. As per the estimates of 2015,
gross profit margin amounted to 72.41% and the net profit margin was 19.53% for crystal
hotel. The industry benchmark is shown to be higher than the companies which suggest
⊘ This is a preview!⊘
Do you want full access?
Subscribe today to unlock all pages.
Trusted by 1+ million students worldwide
6ACCOUNTING
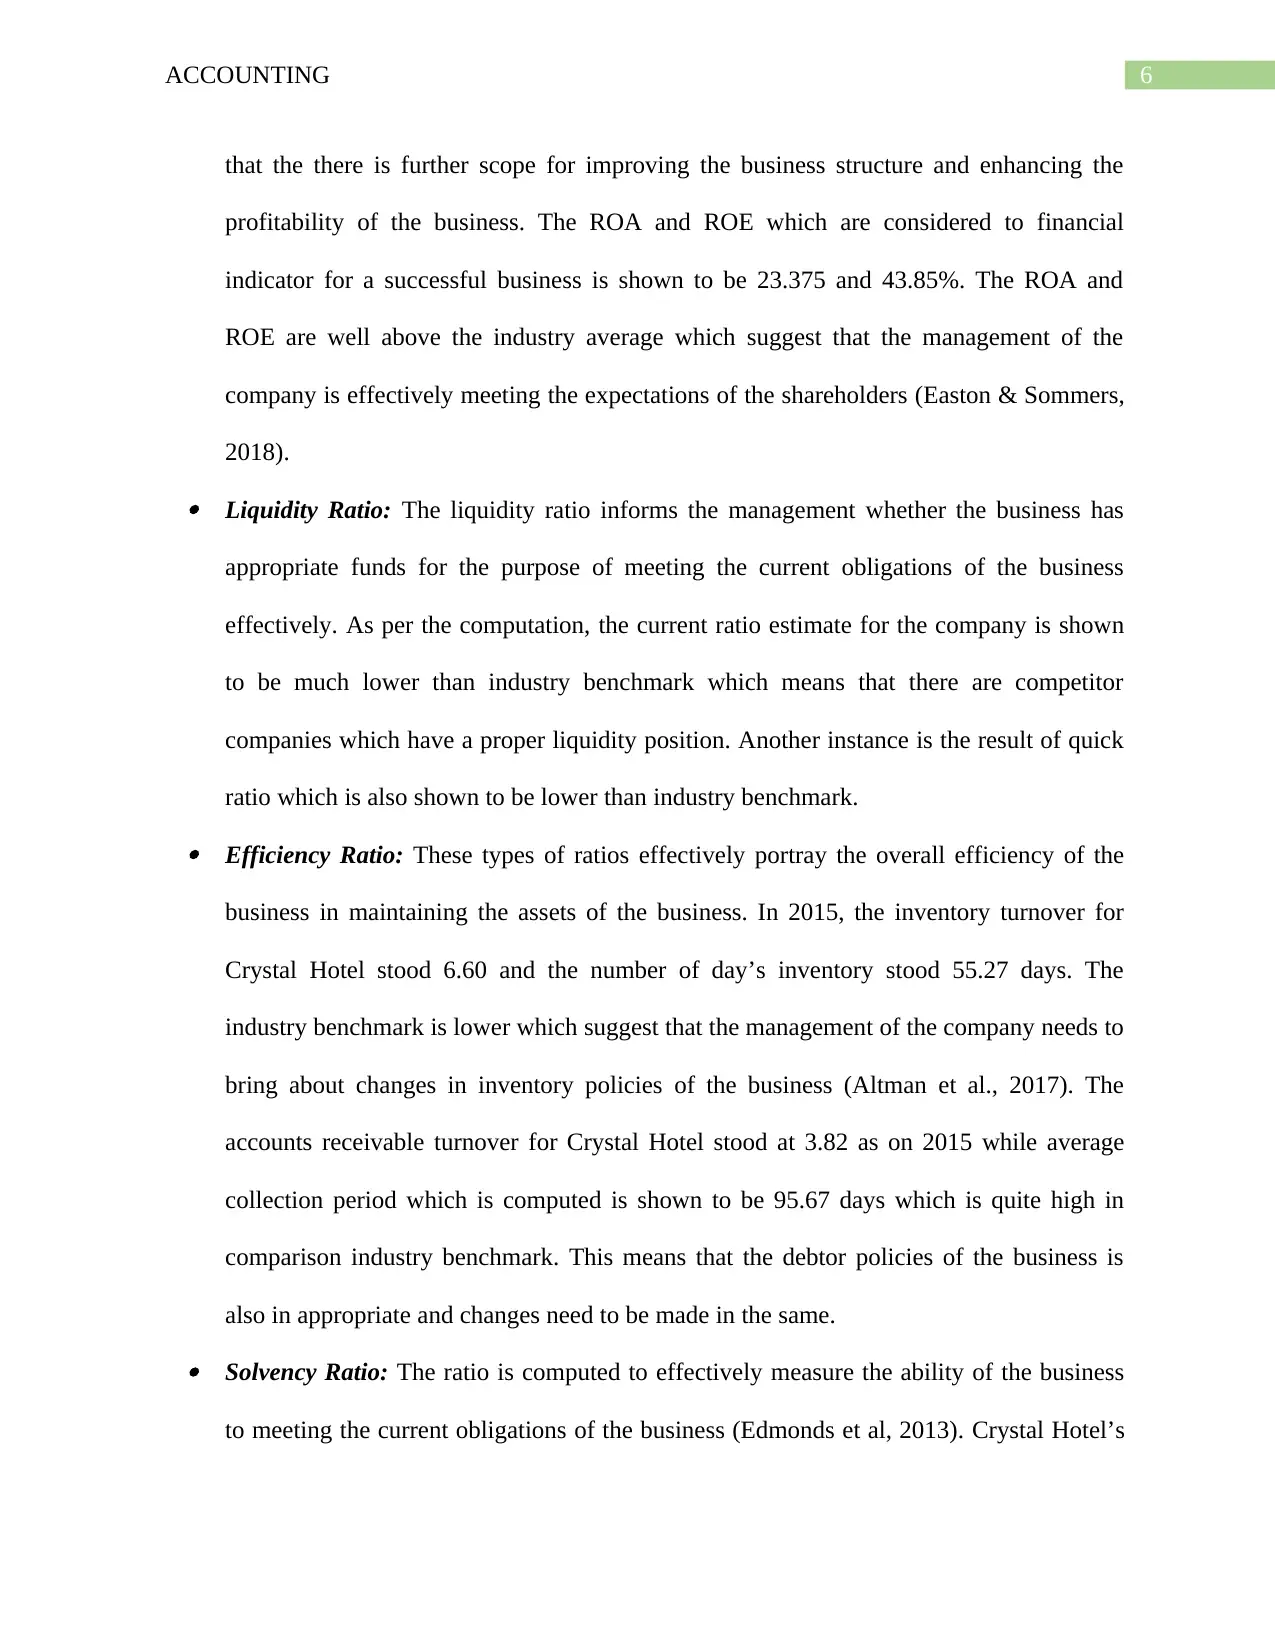
that the there is further scope for improving the business structure and enhancing the
profitability of the business. The ROA and ROE which are considered to financial
indicator for a successful business is shown to be 23.375 and 43.85%. The ROA and
ROE are well above the industry average which suggest that the management of the
company is effectively meeting the expectations of the shareholders (Easton & Sommers,
2018). Liquidity Ratio: The liquidity ratio informs the management whether the business has
appropriate funds for the purpose of meeting the current obligations of the business
effectively. As per the computation, the current ratio estimate for the company is shown
to be much lower than industry benchmark which means that there are competitor
companies which have a proper liquidity position. Another instance is the result of quick
ratio which is also shown to be lower than industry benchmark. Efficiency Ratio: These types of ratios effectively portray the overall efficiency of the
business in maintaining the assets of the business. In 2015, the inventory turnover for
Crystal Hotel stood 6.60 and the number of day’s inventory stood 55.27 days. The
industry benchmark is lower which suggest that the management of the company needs to
bring about changes in inventory policies of the business (Altman et al., 2017). The
accounts receivable turnover for Crystal Hotel stood at 3.82 as on 2015 while average
collection period which is computed is shown to be 95.67 days which is quite high in
comparison industry benchmark. This means that the debtor policies of the business is
also in appropriate and changes need to be made in the same. Solvency Ratio: The ratio is computed to effectively measure the ability of the business
to meeting the current obligations of the business (Edmonds et al, 2013). Crystal Hotel’s
Paraphrase This Document
Need a fresh take? Get an instant paraphrase of this document with our AI Paraphraser
7ACCOUNTING
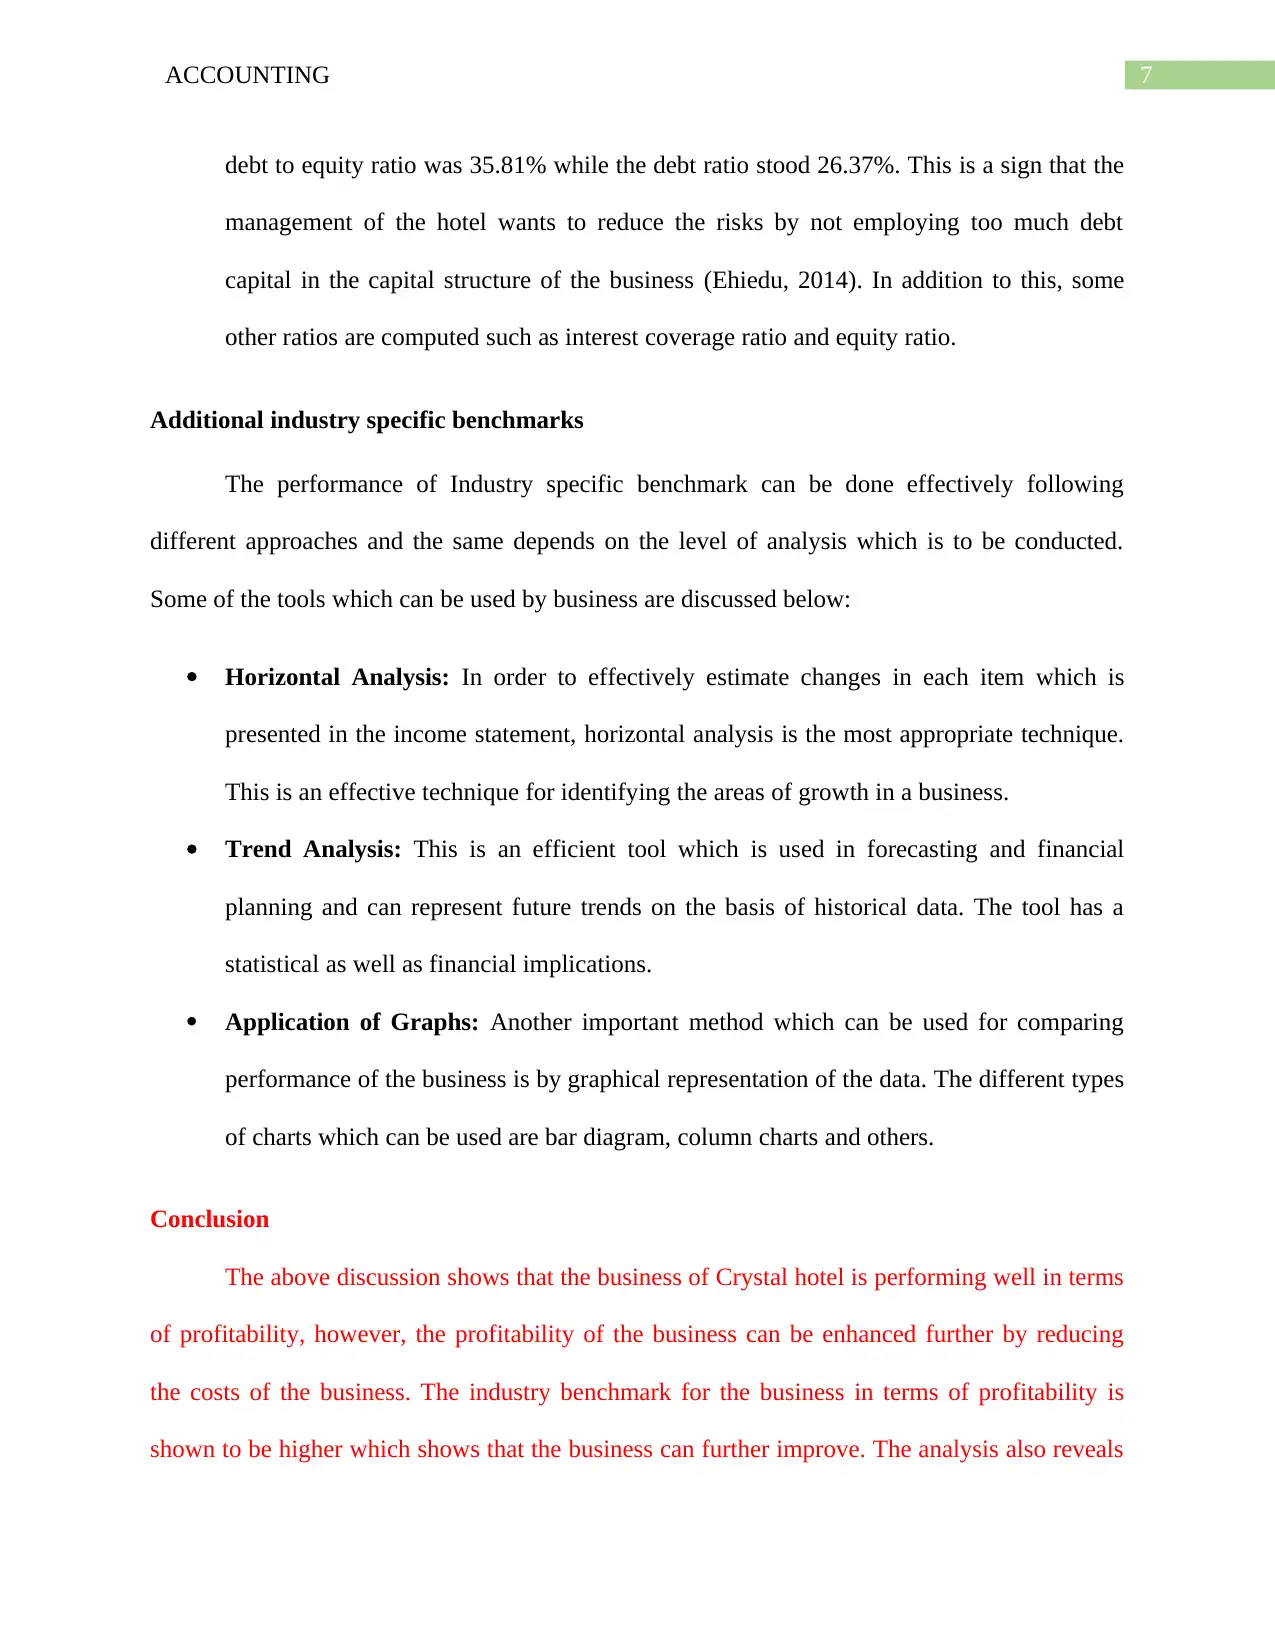
debt to equity ratio was 35.81% while the debt ratio stood 26.37%. This is a sign that the
management of the hotel wants to reduce the risks by not employing too much debt
capital in the capital structure of the business (Ehiedu, 2014). In addition to this, some
other ratios are computed such as interest coverage ratio and equity ratio.
Additional industry specific benchmarks
The performance of Industry specific benchmark can be done effectively following
different approaches and the same depends on the level of analysis which is to be conducted.
Some of the tools which can be used by business are discussed below:
Horizontal Analysis: In order to effectively estimate changes in each item which is
presented in the income statement, horizontal analysis is the most appropriate technique.
This is an effective technique for identifying the areas of growth in a business.
Trend Analysis: This is an efficient tool which is used in forecasting and financial
planning and can represent future trends on the basis of historical data. The tool has a
statistical as well as financial implications.
Application of Graphs: Another important method which can be used for comparing
performance of the business is by graphical representation of the data. The different types
of charts which can be used are bar diagram, column charts and others.
Conclusion
The above discussion shows that the business of Crystal hotel is performing well in terms
of profitability, however, the profitability of the business can be enhanced further by reducing
the costs of the business. The industry benchmark for the business in terms of profitability is
shown to be higher which shows that the business can further improve. The analysis also reveals
8ACCOUNTING
that the management of the company also needs to work on its efficiency and revise both debtor
management policies and inventory management policies. In an overall estimate, the
management can further improve its performance and enhance its profitability with proper cost
control policy and effective strategies for enhancing efficiency of the business.
⊘ This is a preview!⊘
Do you want full access?
Subscribe today to unlock all pages.
Trusted by 1+ million students worldwide
9ACCOUNTING
Reference
Altman, E. I., Iwanicz‐Drozdowska, M., Laitinen, E. K., & Suvas, A. (2017). Financial distress
prediction in an international context: A review and empirical analysis of Altman's Z‐
score model. Journal of International Financial Management & Accounting, 28(2), 131-
171.
Babalola, Y. A., & Abiola, F. R. (2013). Financial ratio analysis of firms: A tool for decision
making. International journal of management sciences, 1(4), 132-137.
Easton, M., & Sommers, Z. (2018). Financial Statement Analysis & Valuation
Edmonds, T. P., McNair, F. M., Olds, P. R., & Milam, E. E. (2013). Fundamental financial
accounting concepts. New York, NY: McGraw-Hill Irwin.
Ehiedu, V. C. (2014). The impact of liquidity on profitability of some selected companies: the
financial statement analysis (FSA) approach. Research Journal of Finance and
Accounting, 5(5), 81-90.
Eyraud, L., & Lusinyan, L. (2013). Vertical fiscal imbalances and fiscal performance in
advanced economies. Journal of Monetary Economics, 60(5), 571-587.
Vilar, E., Rebelo, F., & Noriega, P. (2014). Indoor human wayfinding performance using vertical
and horizontal signage in virtual reality. Human Factors and Ergonomics in
Manufacturing & Service Industries, 24(6), 601-615.
1 out of 10
Related Documents


Your All-in-One AI-Powered Toolkit for Academic Success.
+13062052269
info@desklib.com
Available 24*7 on WhatsApp / Email
![[object Object]](/_next/static/media/star-bottom.7253800d.svg)
Unlock your academic potential
Copyright © 2020–2026 A2Z Services. All Rights Reserved. Developed and managed by ZUCOL.