WACC, DCF Valuation for Hotel Shilla Co Limited: Financial Analysis
VerifiedAdded on  2021/06/17
|10
|1362
|128
Project
AI Summary
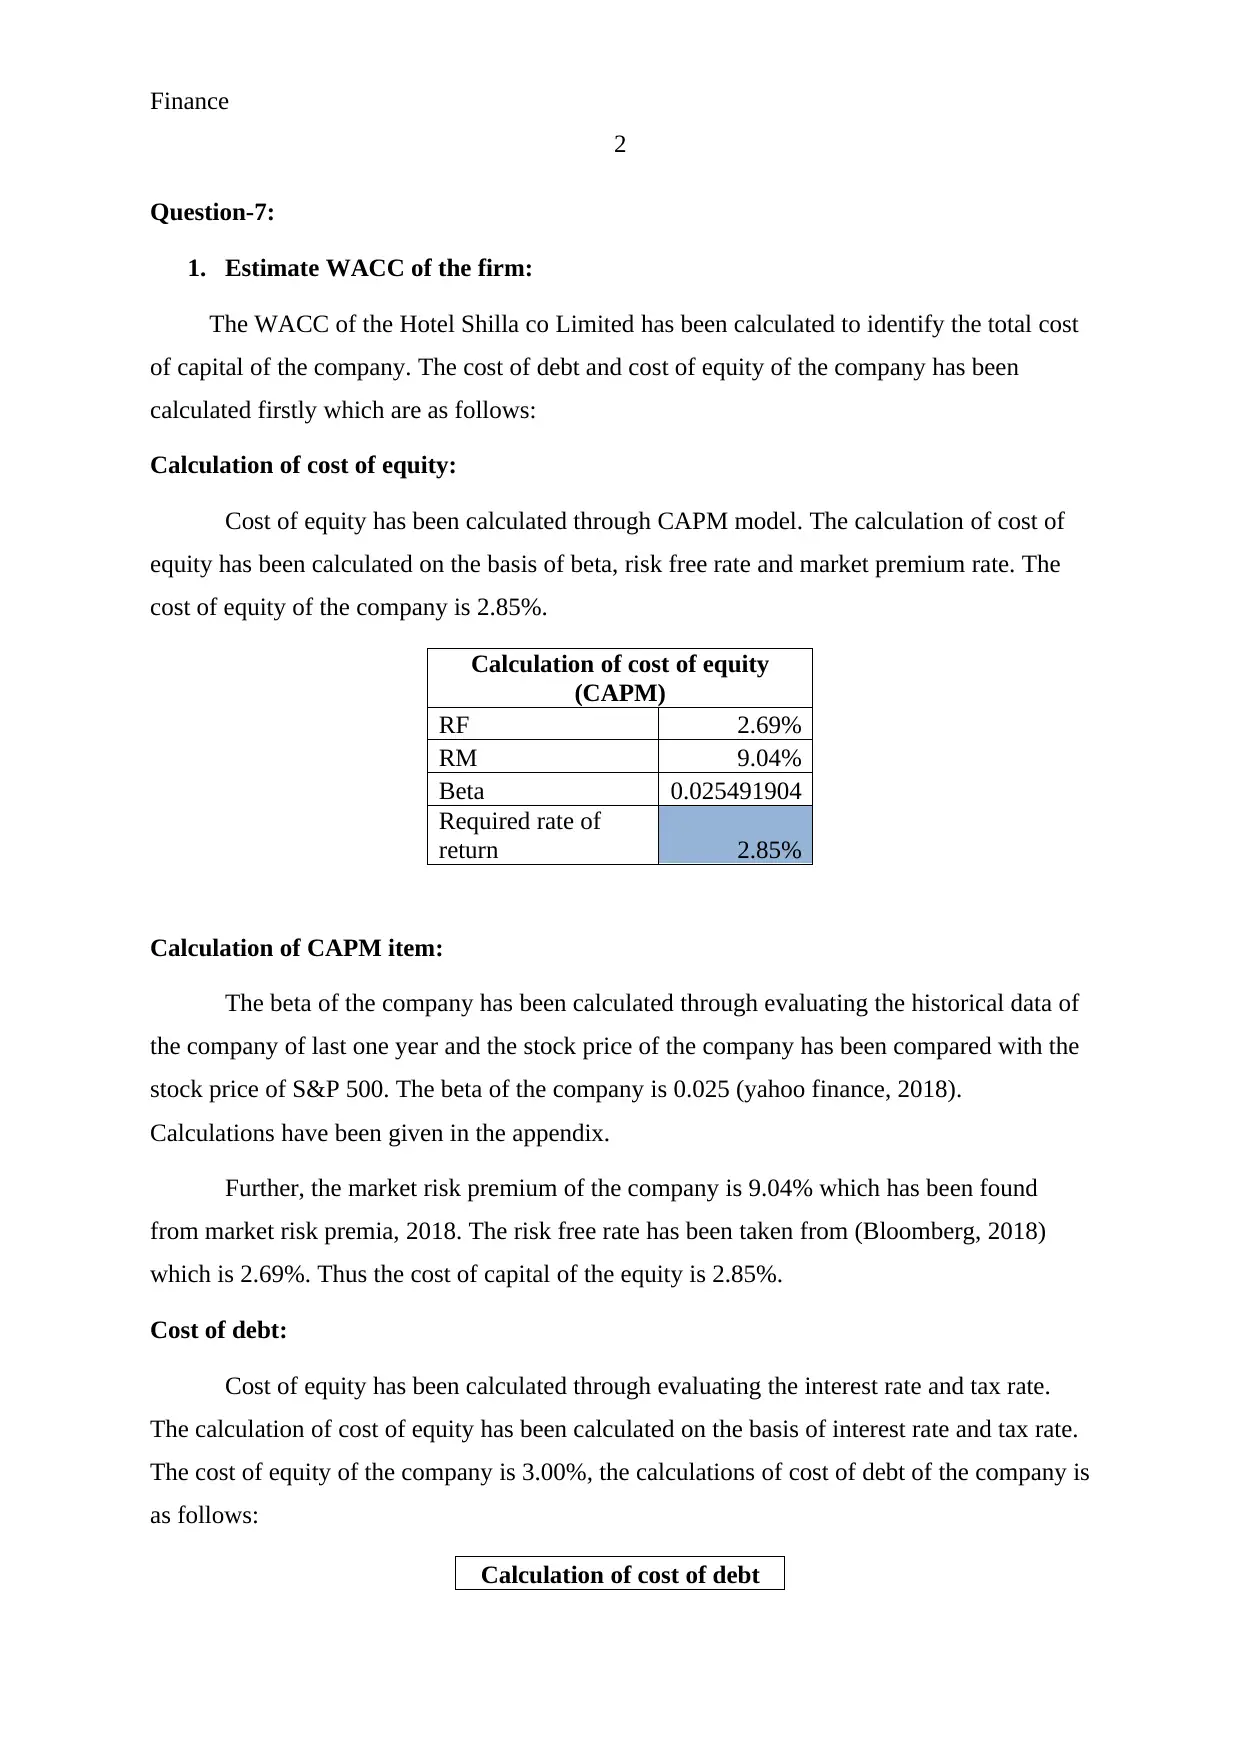
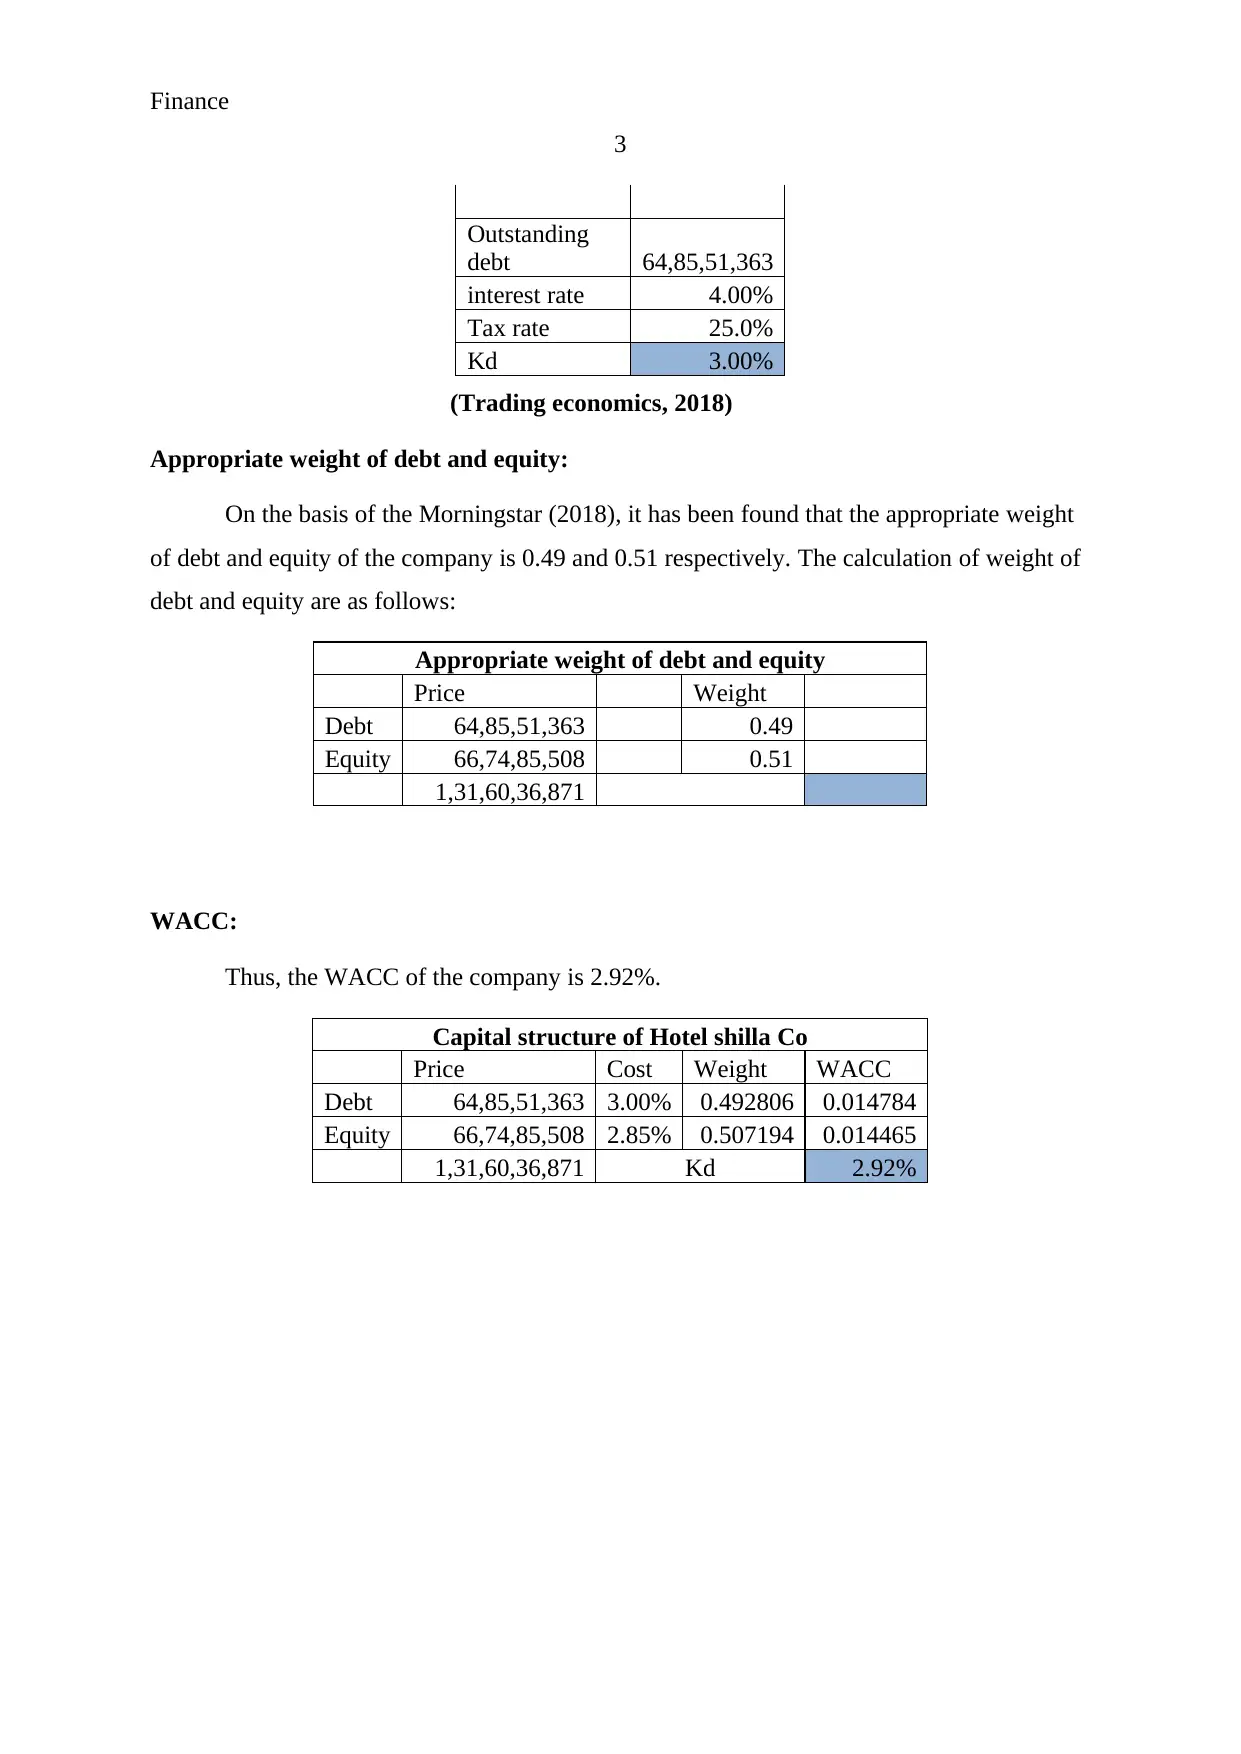
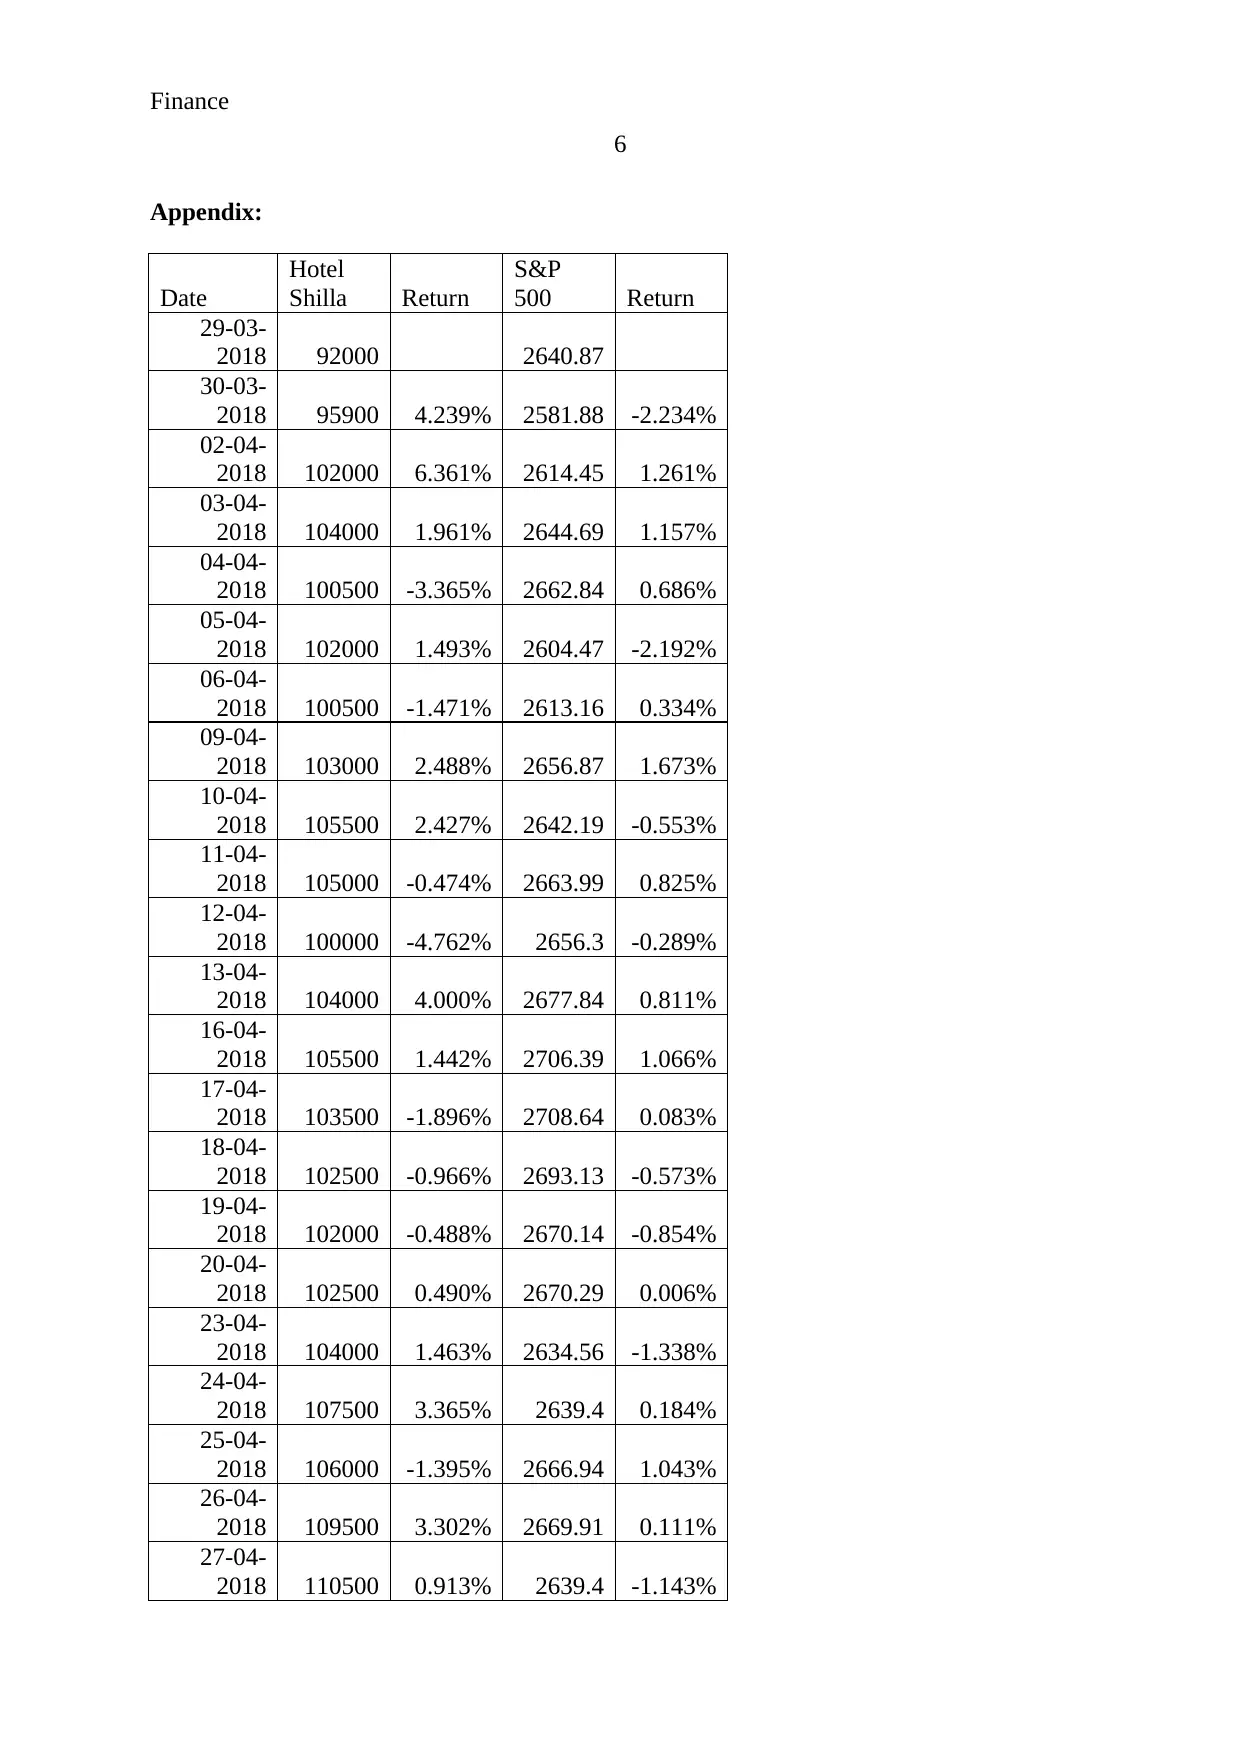
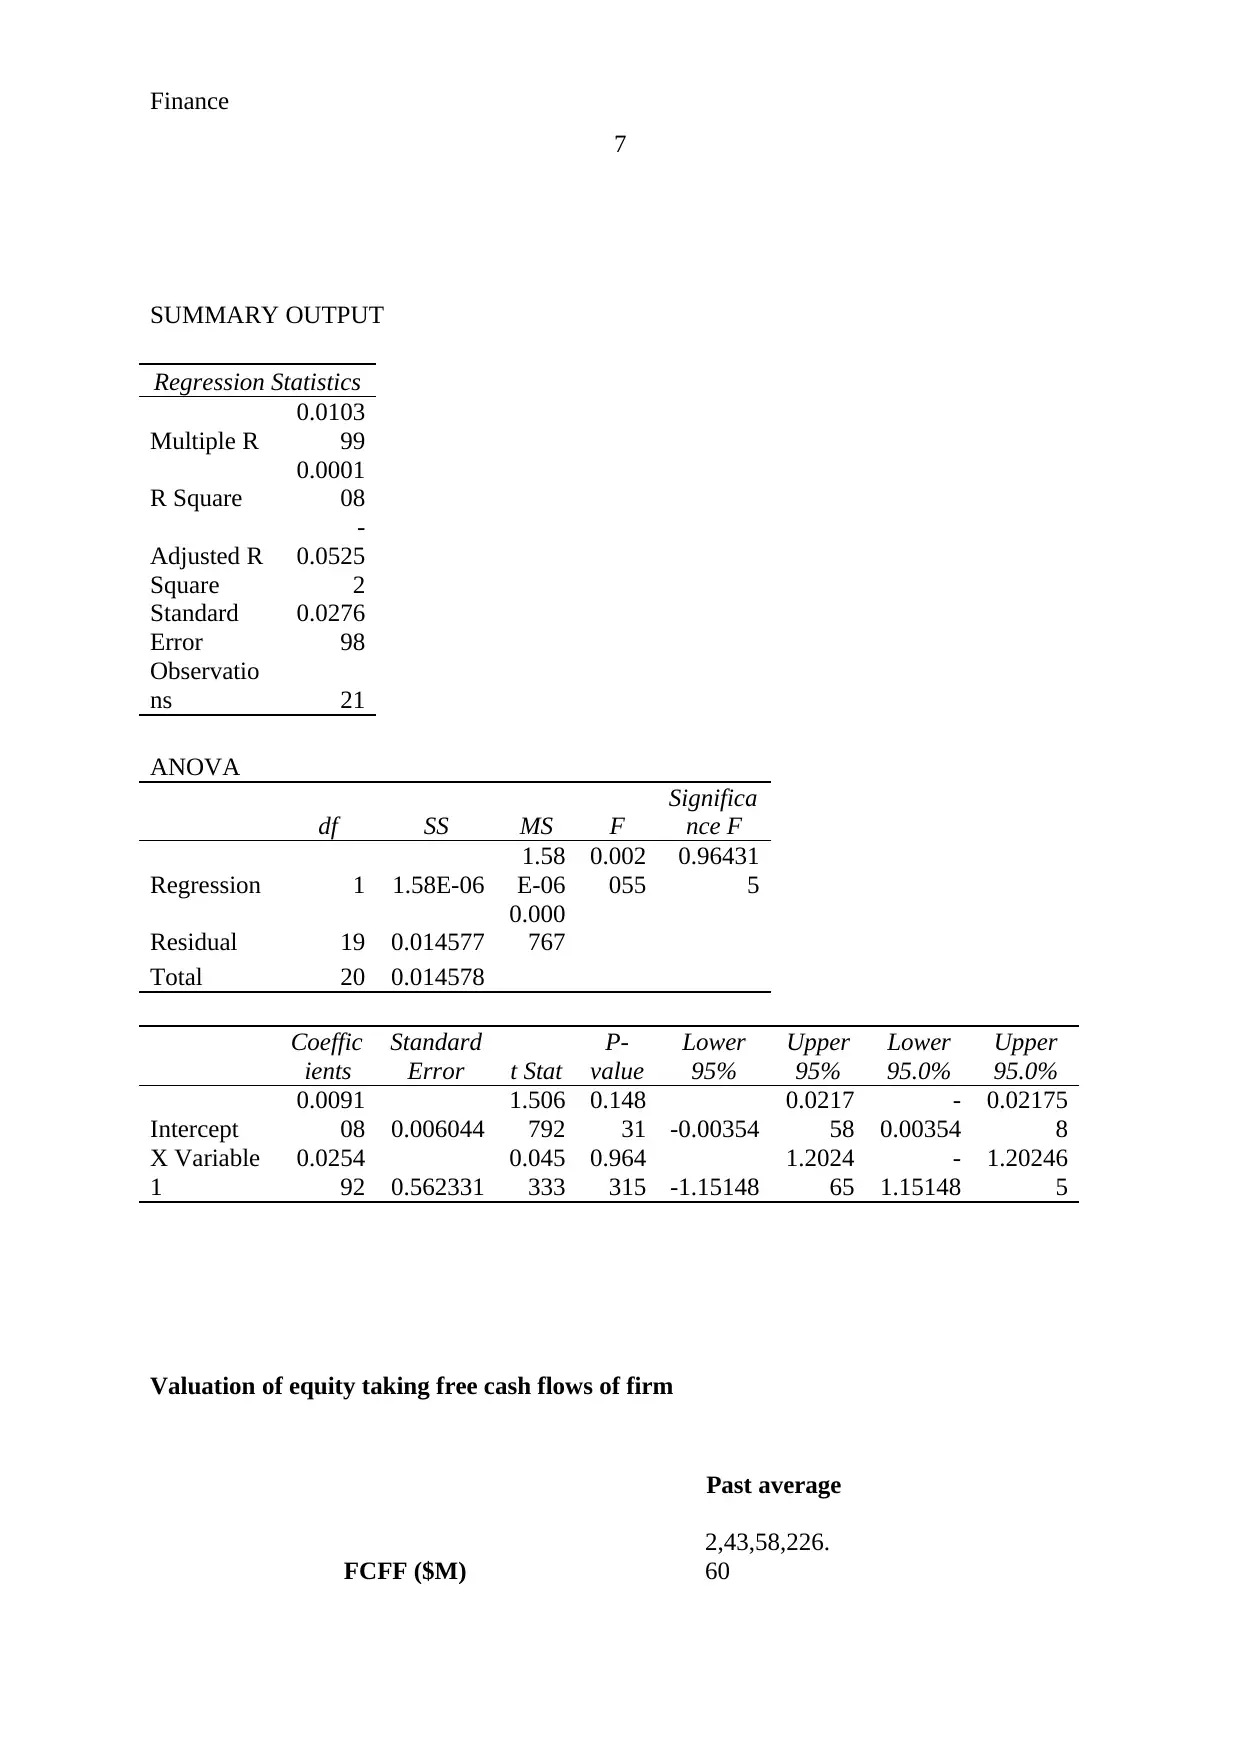
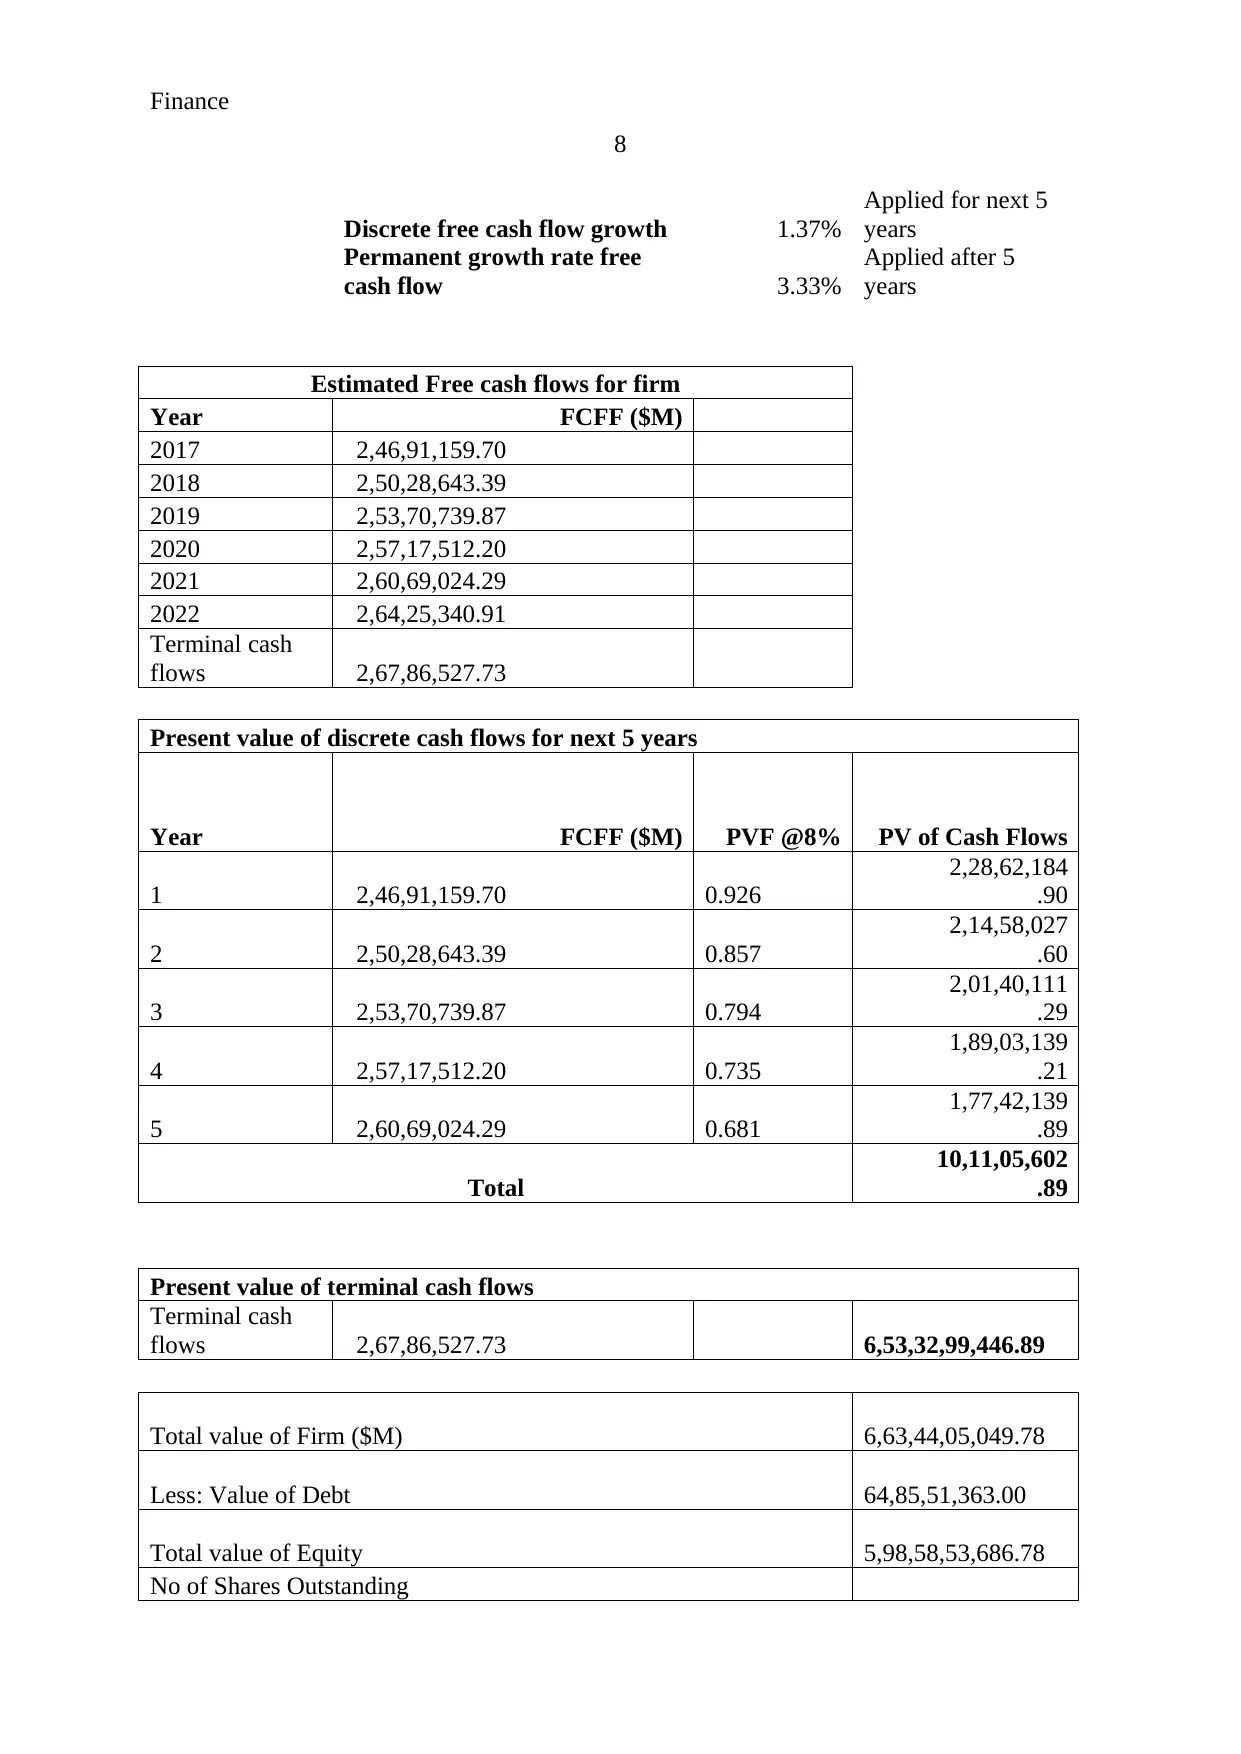
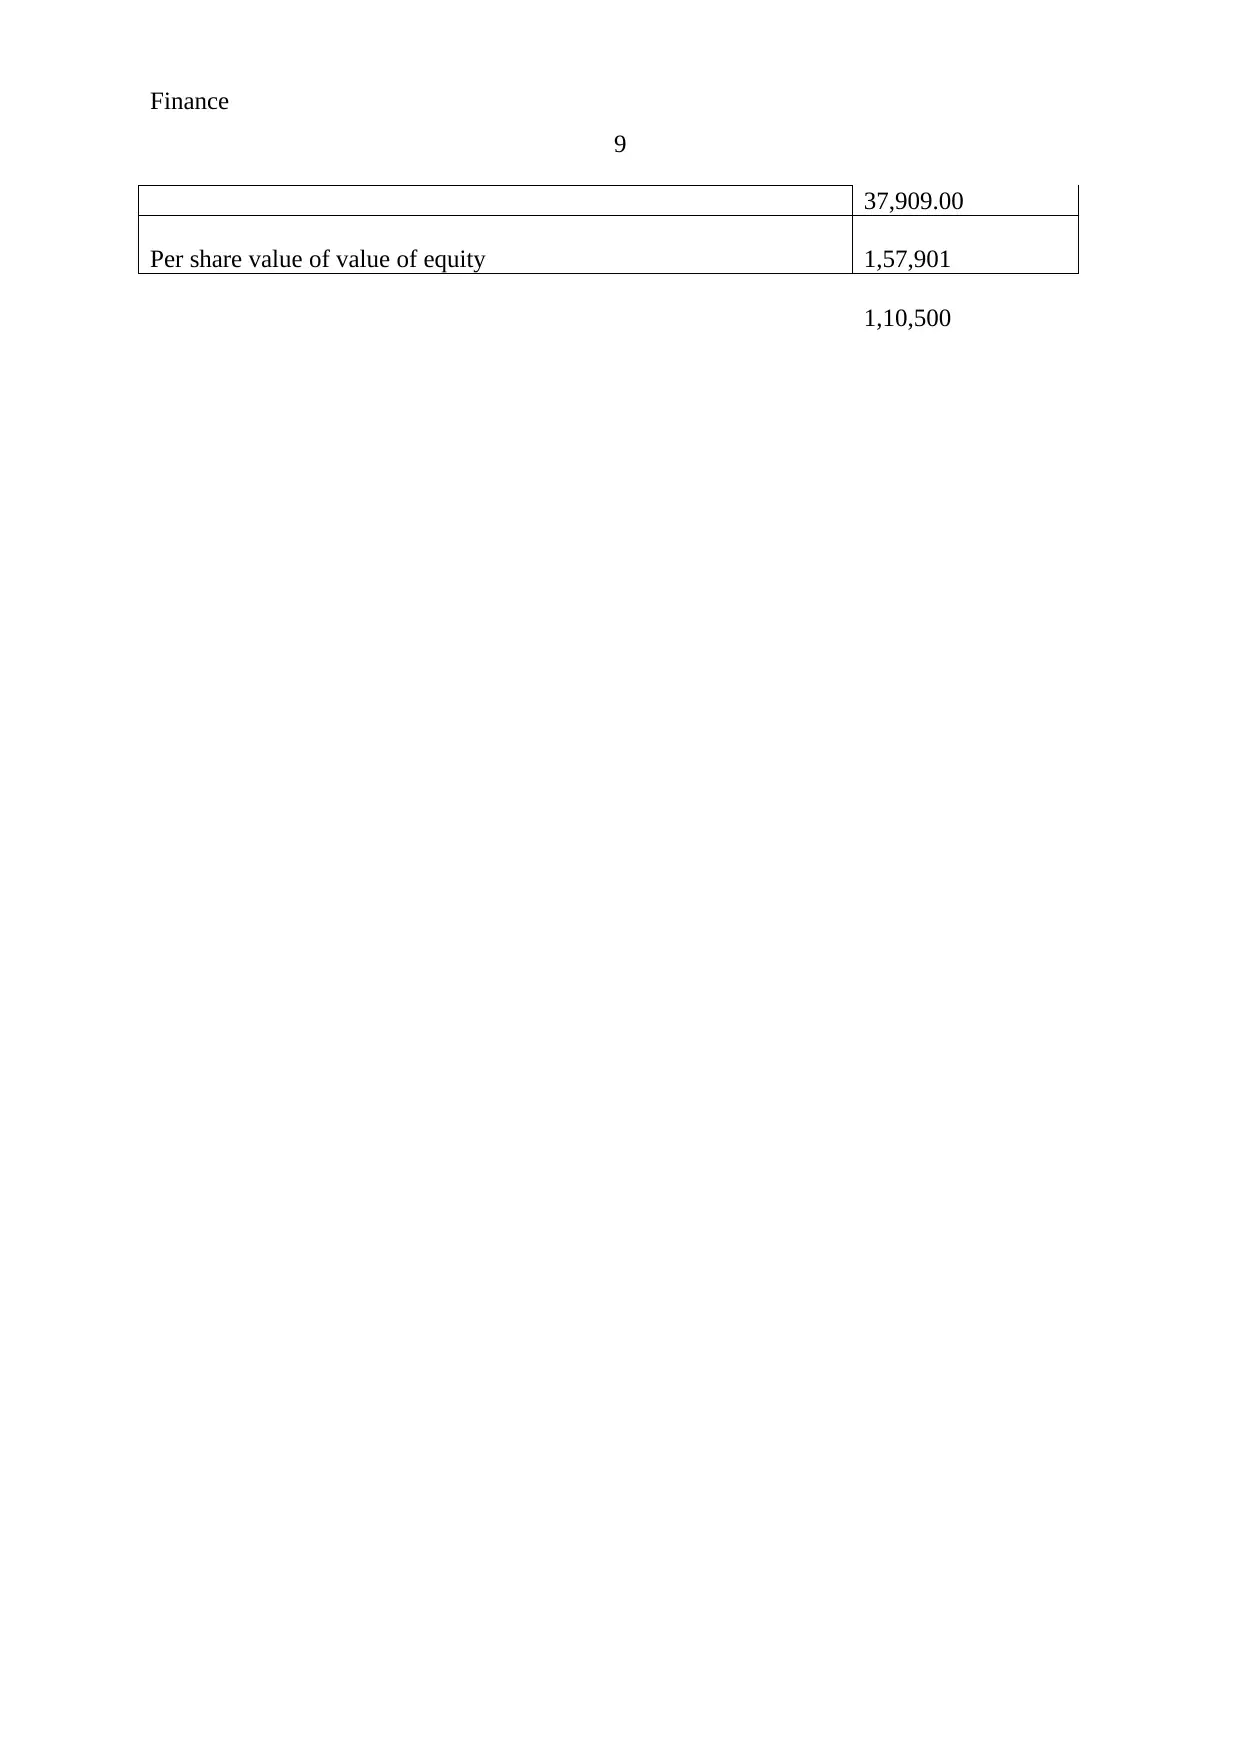
This project undertakes a financial analysis of Hotel Shilla Co Limited, focusing on the calculation of its Weighted Average Cost of Capital (WACC) and the application of Discounted Cash Flow (DCF) analysis to determine the firm's equity value. The WACC calculation incorporates the cost of equity, derived using the Capital Asset Pricing Model (CAPM) considering beta, risk-free rate, and market risk premium, and the cost of debt, based on the interest rate and tax rate. The appropriate weights of debt and equity are determined using Morningstar data. The DCF analysis estimates the company's equity value, projecting free cash flows for the firm and calculating the present value of these cash flows, including a terminal value. The project concludes with a valuation of the company's stock price, comparing it to the market price to assess whether the stock is undervalued or overvalued. The analysis uses financial data from various sources, including Yahoo Finance, Bloomberg, and Trading Economics, to support the calculations and conclusions.

Running Head: Finance
1
1
Paraphrase This Document
Need a fresh take? Get an instant paraphrase of this document with our AI Paraphraser

Finance
2
Question-7:
1. Estimate WACC of the firm:
The WACC of the Hotel Shilla co Limited has been calculated to identify the total cost
of capital of the company. The cost of debt and cost of equity of the company has been
calculated firstly which are as follows:
Calculation of cost of equity:
Cost of equity has been calculated through CAPM model. The calculation of cost of
equity has been calculated on the basis of beta, risk free rate and market premium rate. The
cost of equity of the company is 2.85%.
Calculation of cost of equity
(CAPM)
RF 2.69%
RM 9.04%
Beta 0.025491904
Required rate of
return 2.85%
Calculation of CAPM item:
The beta of the company has been calculated through evaluating the historical data of
the company of last one year and the stock price of the company has been compared with the
stock price of S&P 500. The beta of the company is 0.025 (yahoo finance, 2018).
Calculations have been given in the appendix.
Further, the market risk premium of the company is 9.04% which has been found
from market risk premia, 2018. The risk free rate has been taken from (Bloomberg, 2018)
which is 2.69%. Thus the cost of capital of the equity is 2.85%.
Cost of debt:
Cost of equity has been calculated through evaluating the interest rate and tax rate.
The calculation of cost of equity has been calculated on the basis of interest rate and tax rate.
The cost of equity of the company is 3.00%, the calculations of cost of debt of the company is
as follows:
Calculation of cost of debt

Finance
3
Outstanding
debt 64,85,51,363
interest rate 4.00%
Tax rate 25.0%
Kd 3.00%
(Trading economics, 2018)
Appropriate weight of debt and equity:
On the basis of the Morningstar (2018), it has been found that the appropriate weight
of debt and equity of the company is 0.49 and 0.51 respectively. The calculation of weight of
debt and equity are as follows:
Appropriate weight of debt and equity
Price Weight
Debt 64,85,51,363 0.49
Equity 66,74,85,508 0.51
1,31,60,36,871
WACC:
Thus, the WACC of the company is 2.92%.
Capital structure of Hotel shilla Co
Price Cost Weight WACC
Debt 64,85,51,363 3.00% 0.492806 0.014784
Equity 66,74,85,508 2.85% 0.507194 0.014465
1,31,60,36,871 Kd 2.92%
⊘ This is a preview!⊘
Do you want full access?
Subscribe today to unlock all pages.

Trusted by 1+ million students worldwide

Finance
4
2. Discounted cash flow statement:
The discounted cash flow statement process has been done further to evaluate the
equity position of the company. On the basis of discounted cash flow of the company, it has
been evaluated that the total value of the equity of the company should be 5,98,58,53,686.78.
It explains that the stock price per share of the company should be 1,57,901 which is
1,10,500. It briefs that the stock position and the market position of the company is quite
better. The equity of the company is undervalued. Calculations of DCF have been given in
the appendix.
Paraphrase This Document
Need a fresh take? Get an instant paraphrase of this document with our AI Paraphraser

Finance
5
References:
Morningstar. 2018. Hotel Shilla co. (Online). Available at:
http://financials.morningstar.com/income-statement/is.html?t=0P0000B4VR&culture=en-
US&platform=sal (Accessed as on 29th April 2018).
Trading economy. 2018. Tax rates. (Online). Available at:
https://tradingeconomics.com/south-korea/corporate-tax-rate (Accessed as on 29th April
2018).
Bloomberg. 2018. Rates and bonds. (Online). Available at:
https://www.bloomberg.com/markets/rates-bonds (Accessed as on 29th April 2018).
Market risk premia. 2018. Market risk. (Online). Available at: http://www.market-risk-
premia.com/kp.html (Accessed as on 29th April 2018).
Yahoo finance. 2018. Hotel Shilla co. (Online). Available at:
https://finance.yahoo.com/quote/%5EGSPC/history?
period1=1493454585&period2=1524990585&interval=1d&filter=history&frequency=1d
(Accessed as on 29th April 2018).

Finance
6
Appendix:
Date
Hotel
Shilla Return
S&P
500 Return
29-03-
2018 92000 2640.87
30-03-
2018 95900 4.239% 2581.88 -2.234%
02-04-
2018 102000 6.361% 2614.45 1.261%
03-04-
2018 104000 1.961% 2644.69 1.157%
04-04-
2018 100500 -3.365% 2662.84 0.686%
05-04-
2018 102000 1.493% 2604.47 -2.192%
06-04-
2018 100500 -1.471% 2613.16 0.334%
09-04-
2018 103000 2.488% 2656.87 1.673%
10-04-
2018 105500 2.427% 2642.19 -0.553%
11-04-
2018 105000 -0.474% 2663.99 0.825%
12-04-
2018 100000 -4.762% 2656.3 -0.289%
13-04-
2018 104000 4.000% 2677.84 0.811%
16-04-
2018 105500 1.442% 2706.39 1.066%
17-04-
2018 103500 -1.896% 2708.64 0.083%
18-04-
2018 102500 -0.966% 2693.13 -0.573%
19-04-
2018 102000 -0.488% 2670.14 -0.854%
20-04-
2018 102500 0.490% 2670.29 0.006%
23-04-
2018 104000 1.463% 2634.56 -1.338%
24-04-
2018 107500 3.365% 2639.4 0.184%
25-04-
2018 106000 -1.395% 2666.94 1.043%
26-04-
2018 109500 3.302% 2669.91 0.111%
27-04-
2018 110500 0.913% 2639.4 -1.143%
⊘ This is a preview!⊘
Do you want full access?
Subscribe today to unlock all pages.

Trusted by 1+ million students worldwide

Finance
7
SUMMARY OUTPUT
Regression Statistics
Multiple R
0.0103
99
R Square
0.0001
08
Adjusted R
Square
-
0.0525
2
Standard
Error
0.0276
98
Observatio
ns 21
ANOVA
df SS MS F
Significa
nce F
Regression 1 1.58E-06
1.58
E-06
0.002
055
0.96431
5
Residual 19 0.014577
0.000
767
Total 20 0.014578
Coeffic
ients
Standard
Error t Stat
P-
value
Lower
95%
Upper
95%
Lower
95.0%
Upper
95.0%
Intercept
0.0091
08 0.006044
1.506
792
0.148
31 -0.00354
0.0217
58
-
0.00354
0.02175
8
X Variable
1
0.0254
92 0.562331
0.045
333
0.964
315 -1.15148
1.2024
65
-
1.15148
1.20246
5
Valuation of equity taking free cash flows of firm
Past average
FCFF ($M)
2,43,58,226.
60
Paraphrase This Document
Need a fresh take? Get an instant paraphrase of this document with our AI Paraphraser

Finance
8
Discrete free cash flow growth 1.37%
Applied for next 5
years
Permanent growth rate free
cash flow 3.33%
Applied after 5
years
Estimated Free cash flows for firm
Year FCFF ($M)
2017 2,46,91,159.70
2018 2,50,28,643.39
2019 2,53,70,739.87
2020 2,57,17,512.20
2021 2,60,69,024.29
2022 2,64,25,340.91
Terminal cash
flows 2,67,86,527.73
Present value of discrete cash flows for next 5 years
Year FCFF ($M) PVF @8% PV of Cash Flows
1 2,46,91,159.70 0.926
2,28,62,184
.90
2 2,50,28,643.39 0.857
2,14,58,027
.60
3 2,53,70,739.87 0.794
2,01,40,111
.29
4 2,57,17,512.20 0.735
1,89,03,139
.21
5 2,60,69,024.29 0.681
1,77,42,139
.89
Total
10,11,05,602
.89
Present value of terminal cash flows
Terminal cash
flows 2,67,86,527.73 6,53,32,99,446.89
Total value of Firm ($M) 6,63,44,05,049.78
Less: Value of Debt 64,85,51,363.00
Total value of Equity 5,98,58,53,686.78
No of Shares Outstanding

Finance
9
37,909.00
Per share value of value of equity 1,57,901
1,10,500
9
37,909.00
Per share value of value of equity 1,57,901
1,10,500
⊘ This is a preview!⊘
Do you want full access?
Subscribe today to unlock all pages.

Trusted by 1+ million students worldwide

Finance
10
10
1 out of 10
Related Documents

Your All-in-One AI-Powered Toolkit for Academic Success.
 +13062052269
info@desklib.com
Available 24*7 on WhatsApp / Email
Unlock your academic potential
Copyright © 2020–2025 A2Z Services. All Rights Reserved. Developed and managed by ZUCOL.