HOTS Simulation: Strategic Analysis of Hotel Performance & Future
VerifiedAdded on 2023/06/16
|13
|1782
|301
Report
AI Summary
This report evaluates the operational planning and performance of a hotel using the HOTS simulation over a three-year period, analyzing key metrics such as Gross Operating Profit, Guest Satisfaction Index, Staff Satisfaction Index, Occupancy Rate, Hotel Quality Index, and Staff Turnover Rate. The analysis compares the hotel's performance before and after a management handover, highlighting improvements and projecting future performance. The report also discusses appropriate staffing levels, refreshment and maintenance costs, and provides an overall conclusion regarding the hotel's efficiency and potential for future profitability, recommending an extension of the lease based on the positive trends observed. Desklib provides access to this and other solved assignments for students.
Running head: OPERATIONAL PLANNING
OPERATIONAL PLANNING
Name of the Student
Name of the University
Author Note
OPERATIONAL PLANNING
Name of the Student
Name of the University
Author Note
Paraphrase This Document
Need a fresh take? Get an instant paraphrase of this document with our AI Paraphraser
1OPERATIONAL PLANNING
Table of Contents
Introduction................................................................................................................................2
Gross Operating Profit...........................................................................................................2
Guest Satisfaction Index........................................................................................................3
Staff Satisfaction Index..........................................................................................................5
Occupancy Rate Percentage...................................................................................................6
Hotel Quality Index................................................................................................................7
Staff Turnover Rate................................................................................................................9
Conclusion................................................................................................................................11
References................................................................................................................................12
2OPERATIONAL PLANNING
Introduction
This report throws light on the operational planning of the hotel as maintained on the
software (Kotas, 2014). The various parameters that have been present in the operations. An
analysis has been done.
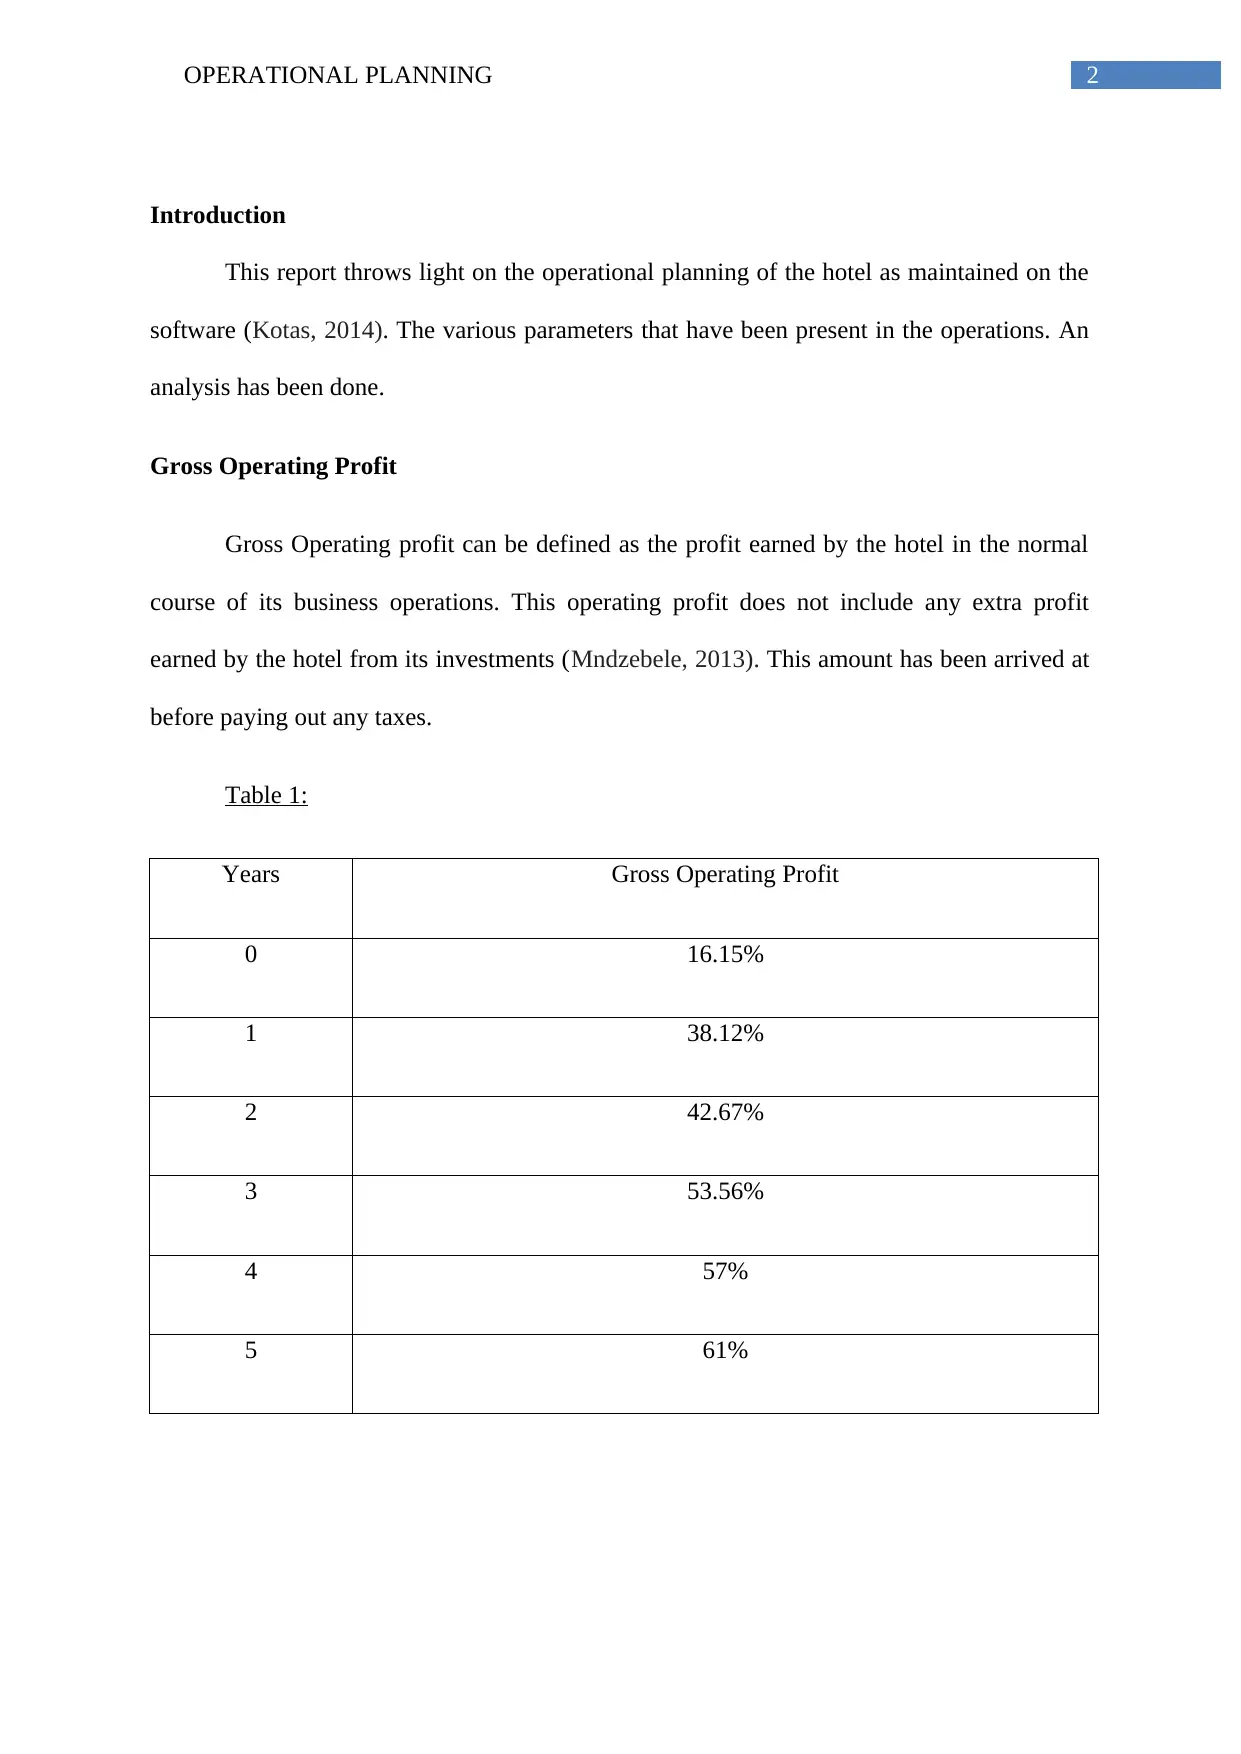
Gross Operating Profit
Gross Operating profit can be defined as the profit earned by the hotel in the normal
course of its business operations. This operating profit does not include any extra profit
earned by the hotel from its investments (Mndzebele, 2013). This amount has been arrived at
before paying out any taxes.
Table 1:
Years Gross Operating Profit
0 16.15%
1 38.12%
2 42.67%
3 53.56%
4 57%
5 61%
Introduction
This report throws light on the operational planning of the hotel as maintained on the
software (Kotas, 2014). The various parameters that have been present in the operations. An
analysis has been done.
Gross Operating Profit
Gross Operating profit can be defined as the profit earned by the hotel in the normal
course of its business operations. This operating profit does not include any extra profit
earned by the hotel from its investments (Mndzebele, 2013). This amount has been arrived at
before paying out any taxes.
Table 1:
Years Gross Operating Profit
0 16.15%
1 38.12%
2 42.67%
3 53.56%
4 57%
5 61%
⊘ This is a preview!⊘
Do you want full access?
Subscribe today to unlock all pages.
Trusted by 1+ million students worldwide
3OPERATIONAL PLANNING
0 1 2 3 4 5
0.00%
10.00%
20.00%
30.00%
40.00%
50.00%
60.00%
70.00%
16.15%
38.12%
42.67%
53.56% 57.00%
61.00%
Gross Operating Profit
Gross Operating Profit
Years
Pre-
Handov
er
Management
Period
Projection
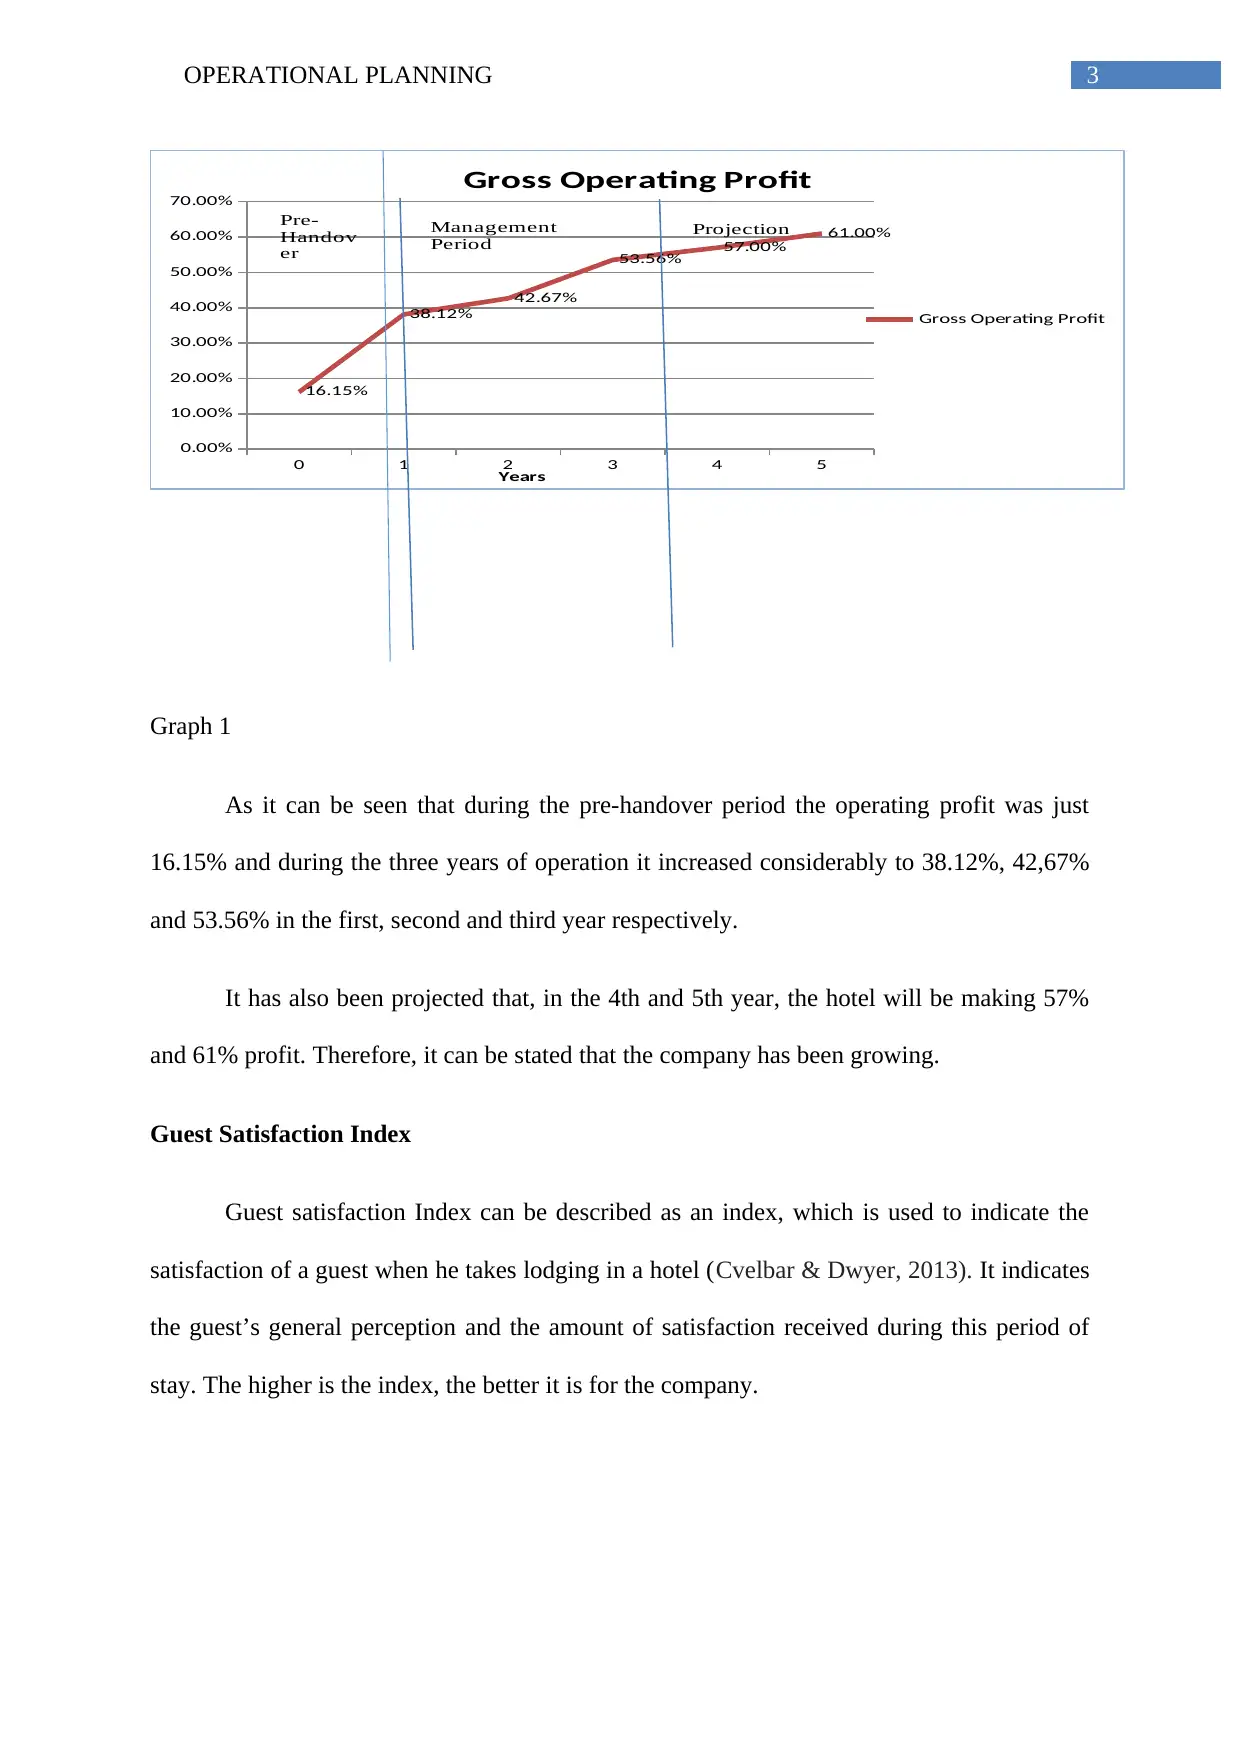
Graph 1
As it can be seen that during the pre-handover period the operating profit was just
16.15% and during the three years of operation it increased considerably to 38.12%, 42,67%
and 53.56% in the first, second and third year respectively.
It has also been projected that, in the 4th and 5th year, the hotel will be making 57%
and 61% profit. Therefore, it can be stated that the company has been growing.
Guest Satisfaction Index
Guest satisfaction Index can be described as an index, which is used to indicate the
satisfaction of a guest when he takes lodging in a hotel (Cvelbar & Dwyer, 2013). It indicates
the guest’s general perception and the amount of satisfaction received during this period of
stay. The higher is the index, the better it is for the company.
0 1 2 3 4 5
0.00%
10.00%
20.00%
30.00%
40.00%
50.00%
60.00%
70.00%
16.15%
38.12%
42.67%
53.56% 57.00%
61.00%
Gross Operating Profit
Gross Operating Profit
Years
Pre-
Handov
er
Management
Period
Projection
Graph 1
As it can be seen that during the pre-handover period the operating profit was just
16.15% and during the three years of operation it increased considerably to 38.12%, 42,67%
and 53.56% in the first, second and third year respectively.
It has also been projected that, in the 4th and 5th year, the hotel will be making 57%
and 61% profit. Therefore, it can be stated that the company has been growing.
Guest Satisfaction Index
Guest satisfaction Index can be described as an index, which is used to indicate the
satisfaction of a guest when he takes lodging in a hotel (Cvelbar & Dwyer, 2013). It indicates
the guest’s general perception and the amount of satisfaction received during this period of
stay. The higher is the index, the better it is for the company.
Paraphrase This Document
Need a fresh take? Get an instant paraphrase of this document with our AI Paraphraser
4OPERATIONAL PLANNING
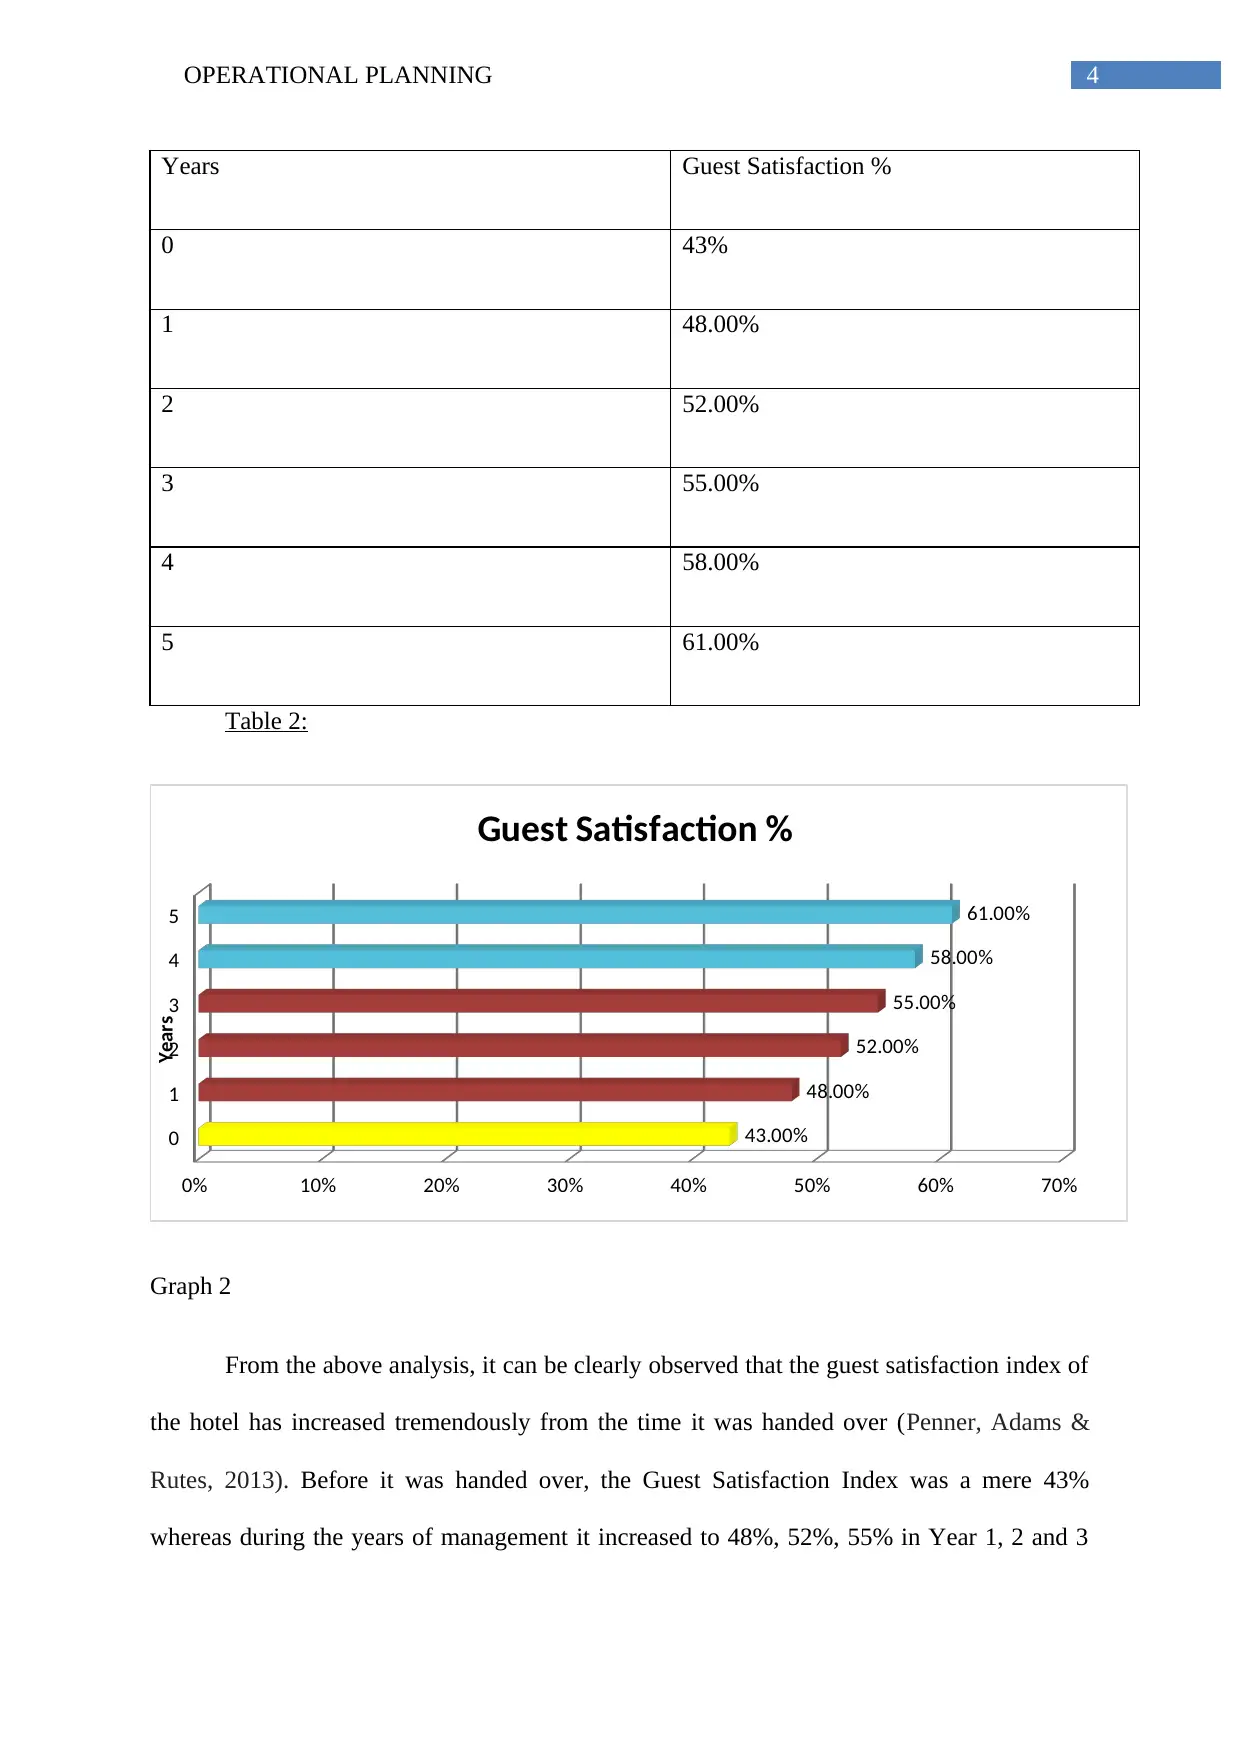
Years Guest Satisfaction %
0 43%
1 48.00%
2 52.00%
3 55.00%
4 58.00%
5 61.00%
Table 2:
0
1
2
3
4
5
0% 10% 20% 30% 40% 50% 60% 70%
43.00%
48.00%
52.00%
55.00%
58.00%
61.00%
Guest Satisfaction %
Years
Graph 2
From the above analysis, it can be clearly observed that the guest satisfaction index of
the hotel has increased tremendously from the time it was handed over (Penner, Adams &
Rutes, 2013). Before it was handed over, the Guest Satisfaction Index was a mere 43%
whereas during the years of management it increased to 48%, 52%, 55% in Year 1, 2 and 3
5OPERATIONAL PLANNING
respectively. It has also been predicted that during the years 4 and 5, the index will increase
to 59% and 61% respectively.
Therefore, it can be stated that that the hotel has been running well with the guest
satisfaction Index increasing significantly over the last few years.
Staff Satisfaction Index
The Staff Satisfaction Index can be described as a method where the hotel gets an
overall idea of how satisfied the employees are at their workplace (Albert & Grzeda, 2015).
The method to calculate this is easy and aims to identify the satisfaction rate of the
employees.
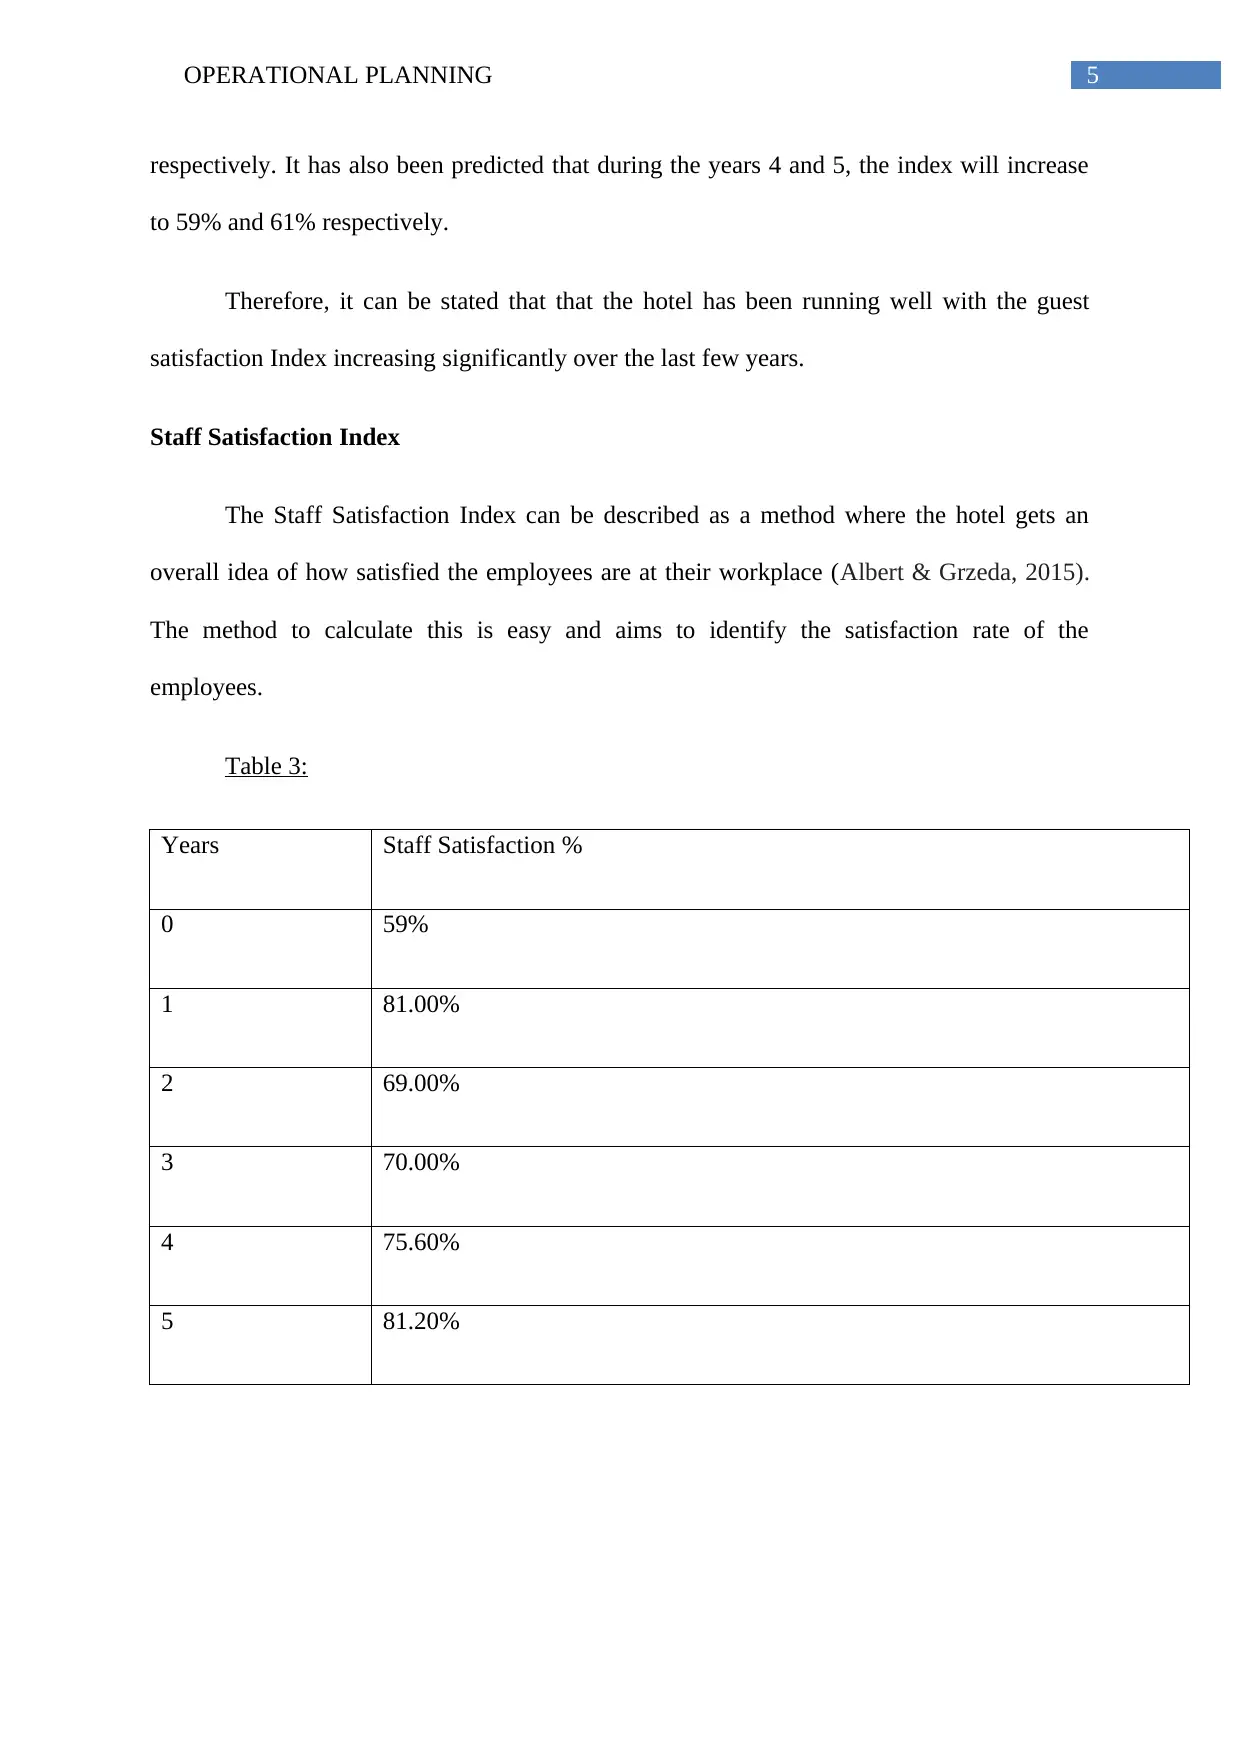
Table 3:
Years Staff Satisfaction %
0 59%
1 81.00%
2 69.00%
3 70.00%
4 75.60%
5 81.20%
respectively. It has also been predicted that during the years 4 and 5, the index will increase
to 59% and 61% respectively.
Therefore, it can be stated that that the hotel has been running well with the guest
satisfaction Index increasing significantly over the last few years.
Staff Satisfaction Index
The Staff Satisfaction Index can be described as a method where the hotel gets an
overall idea of how satisfied the employees are at their workplace (Albert & Grzeda, 2015).
The method to calculate this is easy and aims to identify the satisfaction rate of the
employees.
Table 3:
Years Staff Satisfaction %
0 59%
1 81.00%
2 69.00%
3 70.00%
4 75.60%
5 81.20%
⊘ This is a preview!⊘
Do you want full access?
Subscribe today to unlock all pages.
Trusted by 1+ million students worldwide
6OPERATIONAL PLANNING
0 1 2 3 4 5
0%
10%
20%
30%
40%
50%
60%
70%
80%
90%
Staff Satisfaction %
Years
Graph 3
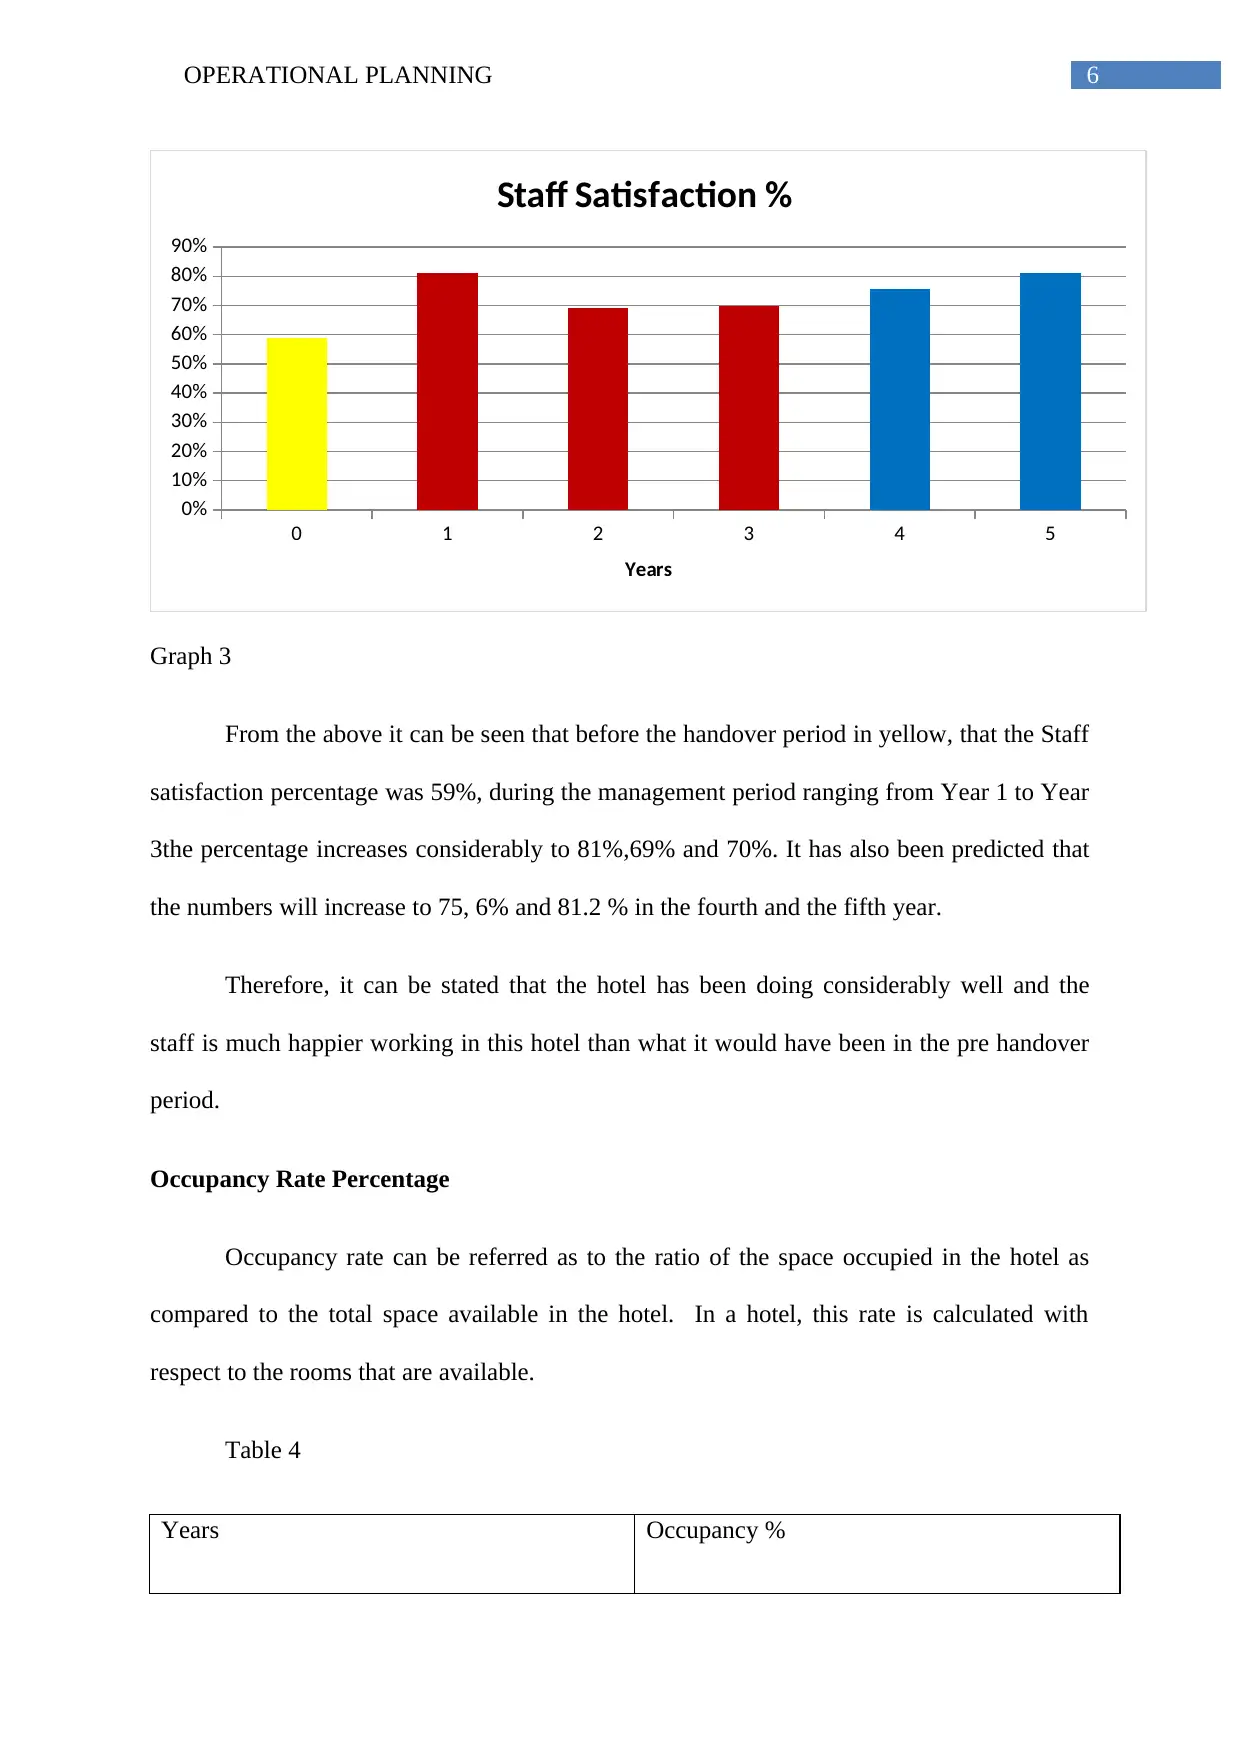
From the above it can be seen that before the handover period in yellow, that the Staff
satisfaction percentage was 59%, during the management period ranging from Year 1 to Year
3the percentage increases considerably to 81%,69% and 70%. It has also been predicted that
the numbers will increase to 75, 6% and 81.2 % in the fourth and the fifth year.
Therefore, it can be stated that the hotel has been doing considerably well and the
staff is much happier working in this hotel than what it would have been in the pre handover
period.
Occupancy Rate Percentage
Occupancy rate can be referred as to the ratio of the space occupied in the hotel as
compared to the total space available in the hotel. In a hotel, this rate is calculated with
respect to the rooms that are available.
Table 4
Years Occupancy %
0 1 2 3 4 5
0%
10%
20%
30%
40%
50%
60%
70%
80%
90%
Staff Satisfaction %
Years
Graph 3
From the above it can be seen that before the handover period in yellow, that the Staff
satisfaction percentage was 59%, during the management period ranging from Year 1 to Year
3the percentage increases considerably to 81%,69% and 70%. It has also been predicted that
the numbers will increase to 75, 6% and 81.2 % in the fourth and the fifth year.
Therefore, it can be stated that the hotel has been doing considerably well and the
staff is much happier working in this hotel than what it would have been in the pre handover
period.
Occupancy Rate Percentage
Occupancy rate can be referred as to the ratio of the space occupied in the hotel as
compared to the total space available in the hotel. In a hotel, this rate is calculated with
respect to the rooms that are available.
Table 4
Years Occupancy %
Paraphrase This Document
Need a fresh take? Get an instant paraphrase of this document with our AI Paraphraser
7OPERATIONAL PLANNING
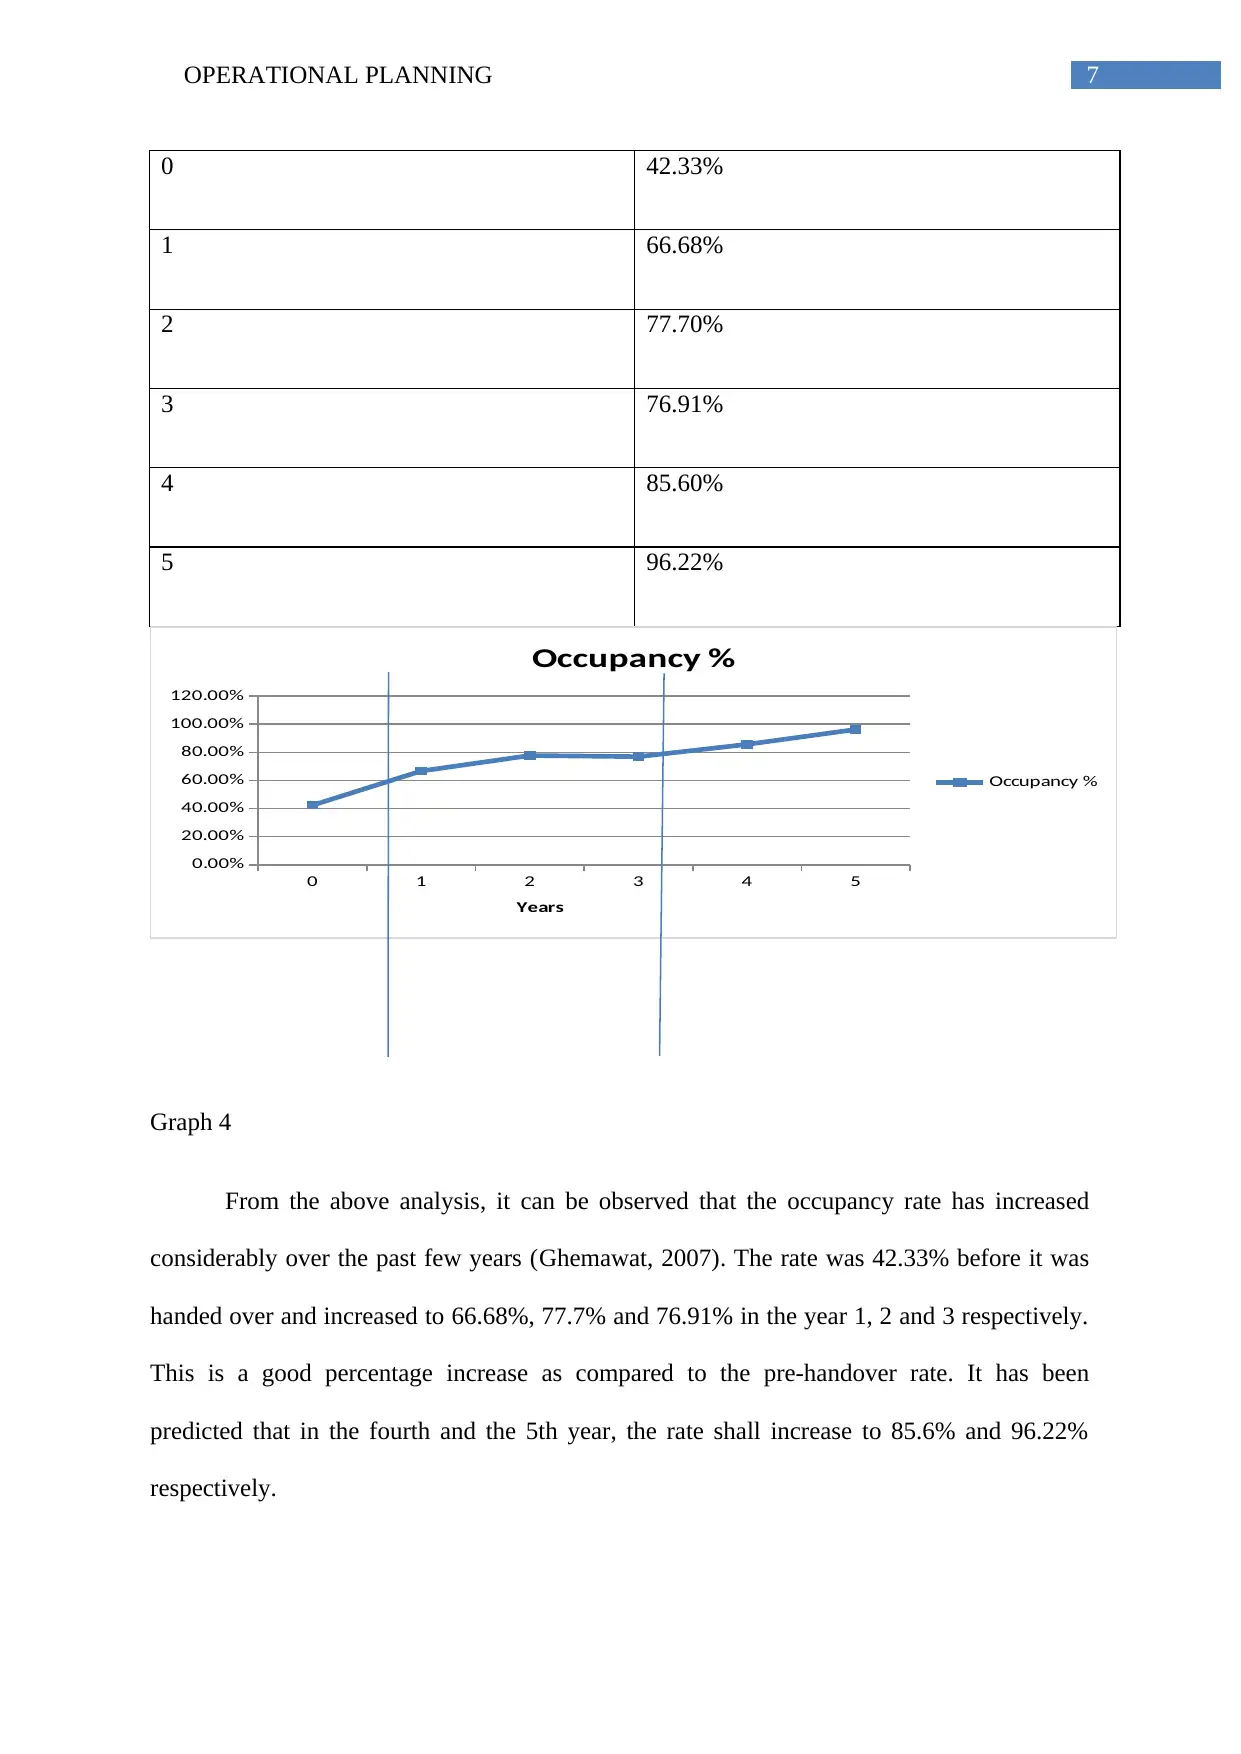
0 42.33%
1 66.68%
2 77.70%
3 76.91%
4 85.60%
5 96.22%
0 1 2 3 4 5
0.00%
20.00%
40.00%
60.00%
80.00%
100.00%
120.00%
Occupancy %
Occupancy %
Years
Graph 4
From the above analysis, it can be observed that the occupancy rate has increased
considerably over the past few years (Ghemawat, 2007). The rate was 42.33% before it was
handed over and increased to 66.68%, 77.7% and 76.91% in the year 1, 2 and 3 respectively.
This is a good percentage increase as compared to the pre-handover rate. It has been
predicted that in the fourth and the 5th year, the rate shall increase to 85.6% and 96.22%
respectively.
8OPERATIONAL PLANNING
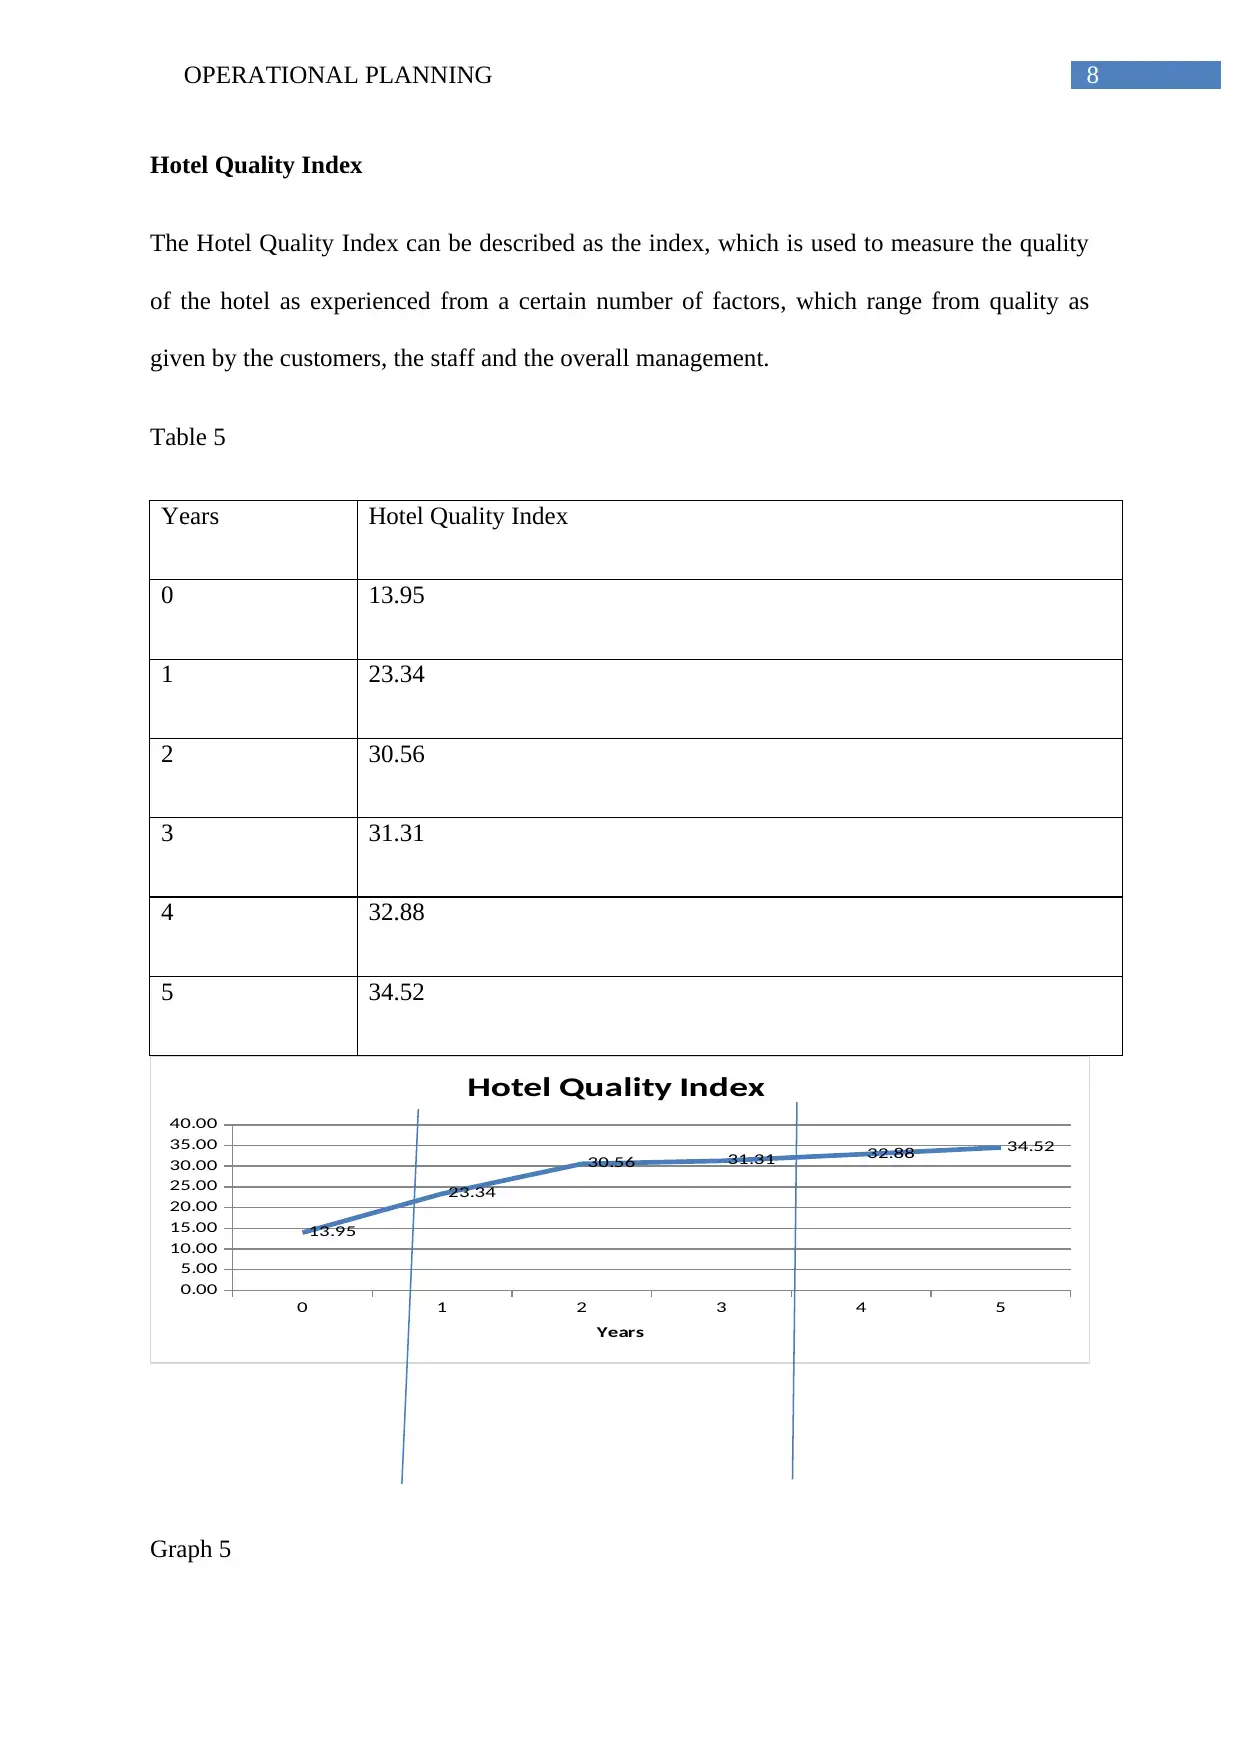
Hotel Quality Index
The Hotel Quality Index can be described as the index, which is used to measure the quality
of the hotel as experienced from a certain number of factors, which range from quality as
given by the customers, the staff and the overall management.
Table 5
Years Hotel Quality Index
0 13.95
1 23.34
2 30.56
3 31.31
4 32.88
5 34.52
0 1 2 3 4 5
0.00
5.00
10.00
15.00
20.00
25.00
30.00
35.00
40.00
13.95
23.34
30.56 31.31 32.88 34.52
Hotel Quality Index
Years
Graph 5
Hotel Quality Index
The Hotel Quality Index can be described as the index, which is used to measure the quality
of the hotel as experienced from a certain number of factors, which range from quality as
given by the customers, the staff and the overall management.
Table 5
Years Hotel Quality Index
0 13.95
1 23.34
2 30.56
3 31.31
4 32.88
5 34.52
0 1 2 3 4 5
0.00
5.00
10.00
15.00
20.00
25.00
30.00
35.00
40.00
13.95
23.34
30.56 31.31 32.88 34.52
Hotel Quality Index
Years
Graph 5
⊘ This is a preview!⊘
Do you want full access?
Subscribe today to unlock all pages.
Trusted by 1+ million students worldwide
9OPERATIONAL PLANNING
From the above analysis, it can be stated that the Hotel Quality Index has increased
considerably since the past few years with the index being 23.34 in year one, 30.56 in year 2
and 31.3 in year 3. The index has been predicted to rise to 32.88 in the year 4 and 34.52 in the
year 5. Therefore, it can be stated that staff is being doing considerably well.
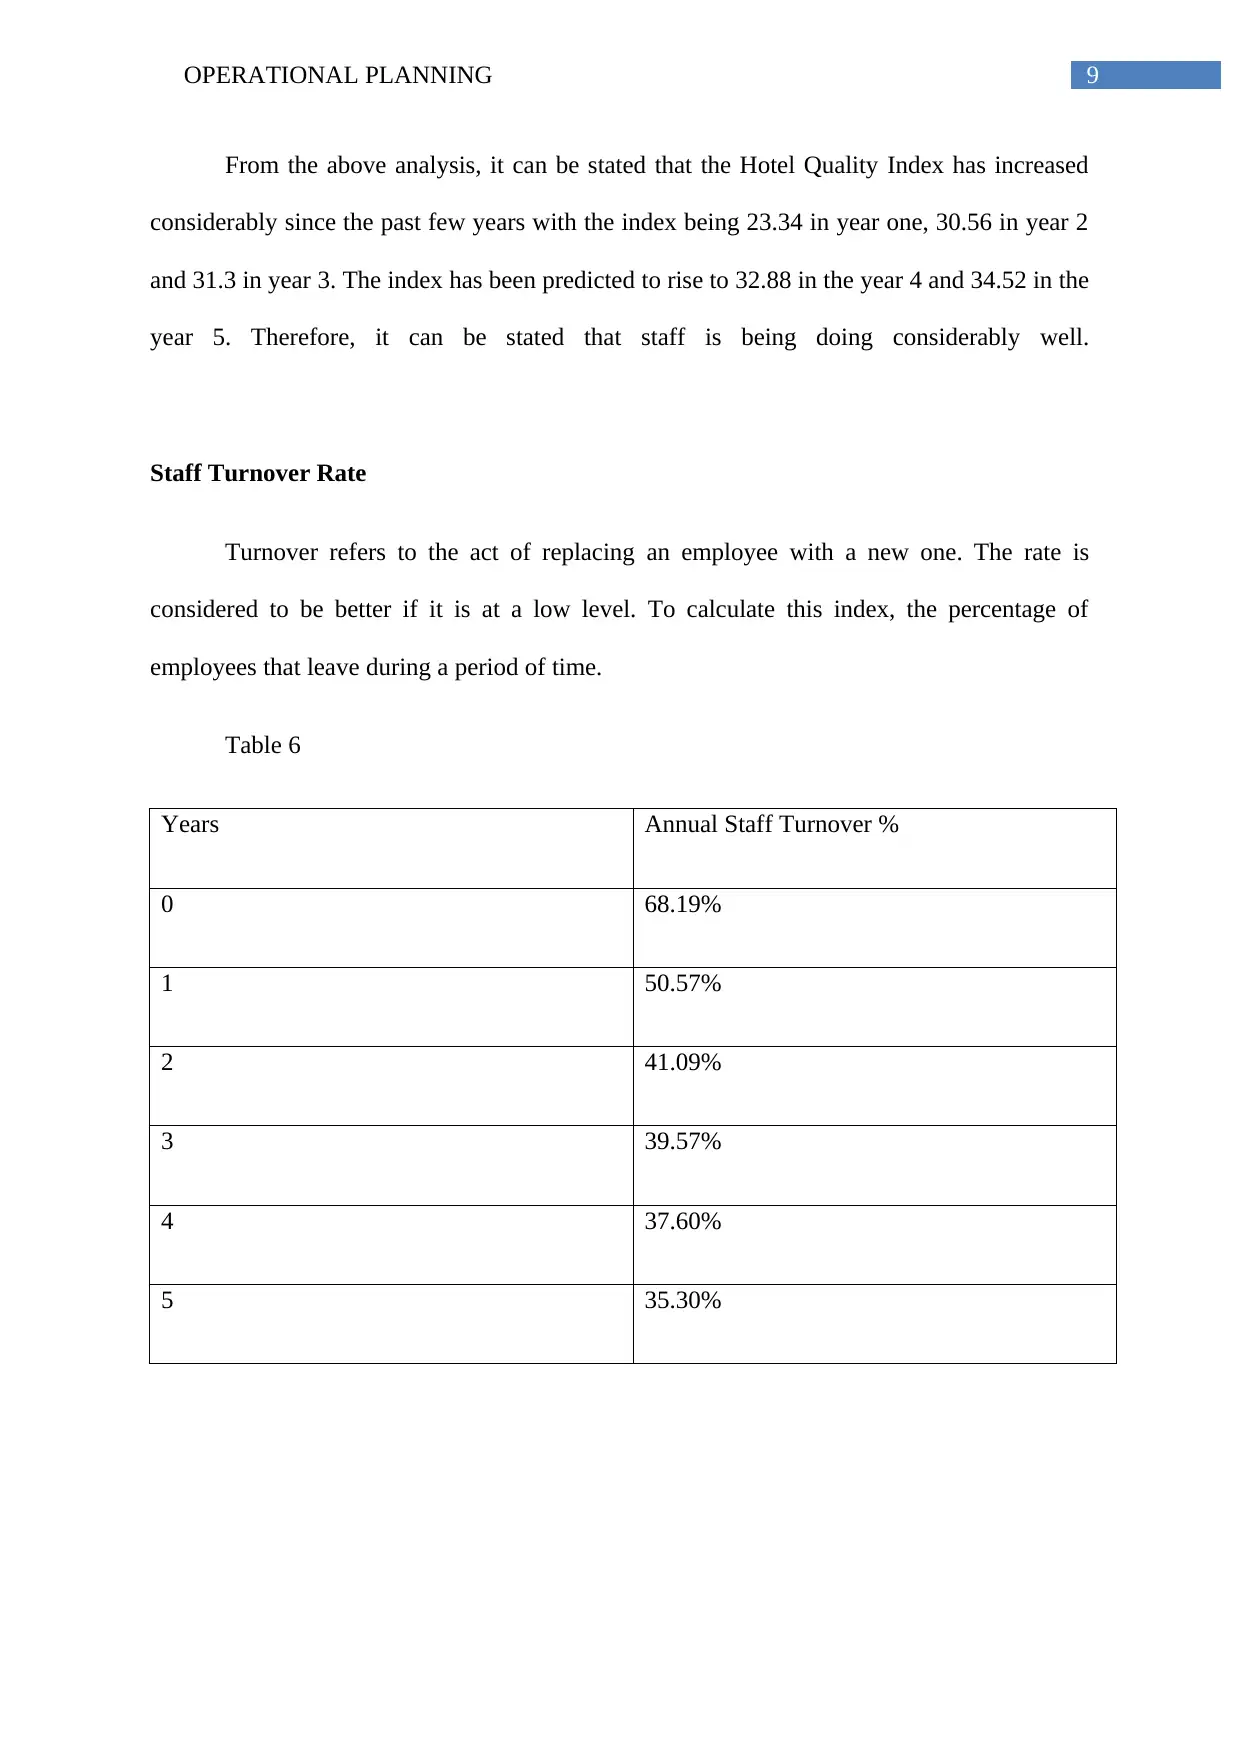
Staff Turnover Rate
Turnover refers to the act of replacing an employee with a new one. The rate is
considered to be better if it is at a low level. To calculate this index, the percentage of
employees that leave during a period of time.
Table 6
Years Annual Staff Turnover %
0 68.19%
1 50.57%
2 41.09%
3 39.57%
4 37.60%
5 35.30%
From the above analysis, it can be stated that the Hotel Quality Index has increased
considerably since the past few years with the index being 23.34 in year one, 30.56 in year 2
and 31.3 in year 3. The index has been predicted to rise to 32.88 in the year 4 and 34.52 in the
year 5. Therefore, it can be stated that staff is being doing considerably well.
Staff Turnover Rate
Turnover refers to the act of replacing an employee with a new one. The rate is
considered to be better if it is at a low level. To calculate this index, the percentage of
employees that leave during a period of time.
Table 6
Years Annual Staff Turnover %
0 68.19%
1 50.57%
2 41.09%
3 39.57%
4 37.60%
5 35.30%
Paraphrase This Document
Need a fresh take? Get an instant paraphrase of this document with our AI Paraphraser
10OPERATIONAL PLANNING
0 1 2 3 4 5
0.00%
10.00%
20.00%
30.00%
40.00%
50.00%
60.00%
70.00%
80.00%
Annual Staff Turnover %
Annual Staff Turnover %
Years
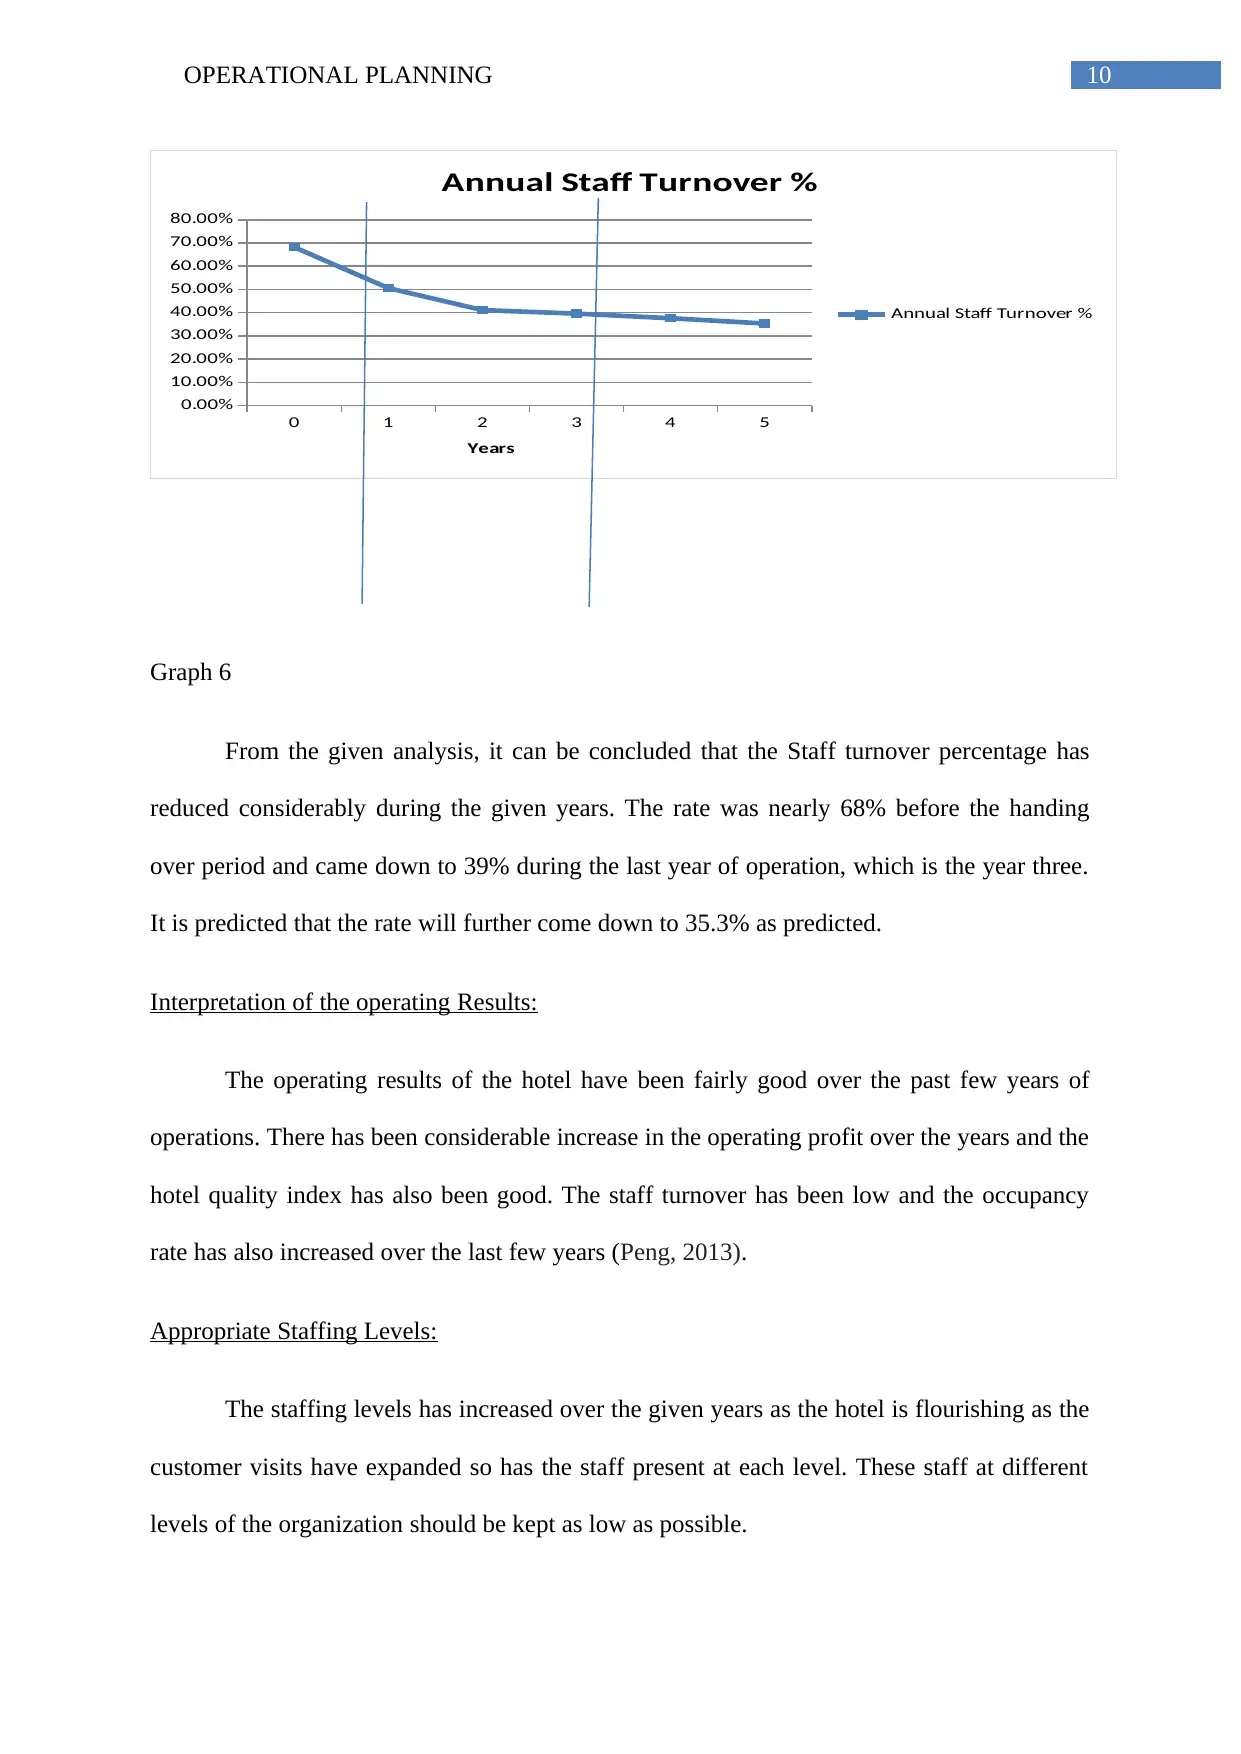
Graph 6
From the given analysis, it can be concluded that the Staff turnover percentage has
reduced considerably during the given years. The rate was nearly 68% before the handing
over period and came down to 39% during the last year of operation, which is the year three.
It is predicted that the rate will further come down to 35.3% as predicted.
Interpretation of the operating Results:
The operating results of the hotel have been fairly good over the past few years of
operations. There has been considerable increase in the operating profit over the years and the
hotel quality index has also been good. The staff turnover has been low and the occupancy
rate has also increased over the last few years (Peng, 2013).
Appropriate Staffing Levels:
The staffing levels has increased over the given years as the hotel is flourishing as the
customer visits have expanded so has the staff present at each level. These staff at different
levels of the organization should be kept as low as possible.
0 1 2 3 4 5
0.00%
10.00%
20.00%
30.00%
40.00%
50.00%
60.00%
70.00%
80.00%
Annual Staff Turnover %
Annual Staff Turnover %
Years
Graph 6
From the given analysis, it can be concluded that the Staff turnover percentage has
reduced considerably during the given years. The rate was nearly 68% before the handing
over period and came down to 39% during the last year of operation, which is the year three.
It is predicted that the rate will further come down to 35.3% as predicted.
Interpretation of the operating Results:
The operating results of the hotel have been fairly good over the past few years of
operations. There has been considerable increase in the operating profit over the years and the
hotel quality index has also been good. The staff turnover has been low and the occupancy
rate has also increased over the last few years (Peng, 2013).
Appropriate Staffing Levels:
The staffing levels has increased over the given years as the hotel is flourishing as the
customer visits have expanded so has the staff present at each level. These staff at different
levels of the organization should be kept as low as possible.
11OPERATIONAL PLANNING
Refreshments and Maintenance Costs
The refreshment and maintenance cost has also varied differently during the last few
years without any constant rate.
Conclusion
Therefore, it can be said that the hotel has been doing well and running efficiently. If
the hotel is given an opportunity to extend the lease to the next two years as well then it will
be a profitable venture.
⊘ This is a preview!⊘
Do you want full access?
Subscribe today to unlock all pages.
Trusted by 1+ million students worldwide
1 out of 13
Your All-in-One AI-Powered Toolkit for Academic Success.
+13062052269
info@desklib.com
Available 24*7 on WhatsApp / Email
![[object Object]](/_next/static/media/star-bottom.7253800d.svg)
Unlock your academic potential
Copyright © 2020–2025 A2Z Services. All Rights Reserved. Developed and managed by ZUCOL.