HOTS: Comprehensive Financial and Strategic Plan Performance Report
VerifiedAdded on 2023/01/18
|13
|5368
|45
Report
AI Summary
This report provides a detailed analysis of the HOTS hotel's financial and managerial performance over two years, focusing on key performance indicators (KPIs) such as REVPAR, gross operating profit, market share, ROCE, guest satisfaction, and staff satisfaction. The analysis is structured around eight different teams, comparing their performances and identifying areas for improvement. The report highlights the importance of financial calculations in understanding the hotel's performance, reviews the balanced scorecard comparisons, and discusses strategic plans. It reveals a positive trend in REVPAR, although the first year's results were weaker than the second. The report examines each team's performance across various metrics, identifying strengths and weaknesses, and emphasizing the impact of strategic changes on financial outcomes. The analysis underscores the significance of market share, ROCE, and guest/staff satisfaction for the overall success of the hotel, offering insights into how the hotel can improve its financial health and performance.
HOTS STRATEGIC PLAN
Introduction:
Every hotel has both financial and managerial aspects that are needed to analysed
and worked on. Like every other business, both internal and external factors affect the
hospitality industry. Concentrating on just one aspect would confine the benefits and
sometimes hinder the overall performance as each element would be supporting and affecting
each other directly or indirectly (Alexander, 2016). If the technical aspects are strong, but if
the hotel fails to focus on managerial and financial issues, then it would be of no use. Here,
we are going to see all the necessary financial calculations that help us to recognise the
performance of the HOTS. Also, it is divided into eight different teams and each one has its
unique performance that has a need to understand and rectify. So, there will be a ranking
allotted to individual team in very individual aspect and it would be easy to compare their
performances and understand where they are exactly lagging. Apart from the rankings, all the
rates are needed to be calculated to actually derive the financial performance of the hotel for
two years and notice their retrospective effect with the changes happened. Later, all the key
strategic plans are mentioned and elaborated in an informative manner.
Reviewing key performance indicators from the
balanced score card
REV PAR (REVENUE PER AVAILABLE ROOM)
It is one of the most important ratios used in the hotel. It is a ratio between occupancy and
room rates and it also gives us a clear picture about how well the rooms are filled and how
good are they charged. Based on HOTS, REVPAR results show a very good positive trend. If
you have a look at the tables you can see that the first year results are poor comparing to the
second year (Arnott, Lizama, & Song, 2017).
BALANCED SCORECARD
COMPARISON OT TEAM RESULTS
KEY INDICATORS
YEAR 1
TEAM1 TEAM2 TEAM3 TEAM4 TEAM5 TEAM6 TEAM7 TEAM8
Team1b 666 Team3 GRACE abc Druk110
00
F7 Team8a
Ave
rage
Ra
nk
Ave
rage
Ra
nk
Ave
rage
Ra
nk
Ave
rage
Ra
nk
Ave
rage
Ra
nk
Ave
rage
Ra
nk
Ave
rage
Ra
nk
Ave
rage
Ra
nk
OPERA
TIONS
Paraphrase This Document
Need a fresh take? Get an instant paraphrase of this document with our AI Paraphraser
REVPA
R($)
59.07 2 60.37 1 48.57 4 44.86 5 50.17 3 42.74 7 44.20 6 37.30 8
Gross
Operati
ng
Profit
(IBFC
%)
2.39 3 -9.30 7 -11.52 8 -1.08 6 12.88 1 1.96 4 0.06 5 8.34 2
Rooms
Market
Share
%
( Transi
ent
Busines
s)
9.49 1 9.22 2 9.23 2 7.77 6 8.36 4 7.56 7 7.89 5 5.63 8
Relative
Market
Share
%
14.6 14.2 14.2 11.9 12.8 11.6 12.1 8.6
OWNE
R
ROCE
% - Pre-
tax
profit/C
apital
Employ
ed
-12.08 4 -19.69 8 -19.07 7 -15.59 6 -6.58 1 -11.42 3 -12.63 5 -9.21 2
Guest
Satisfac
tion
Survey
(%)
49 1 47 2 47 3 45 4 45 5 45 6 44 7 42 8
Staff
Relatio
nship
Survey
(%)
75 3 76 2 62 7 74 4 77 1 63 6 71 5 60 8
OVER
ALL
RANKI
NG
1 3 4 4 2 6 6 8
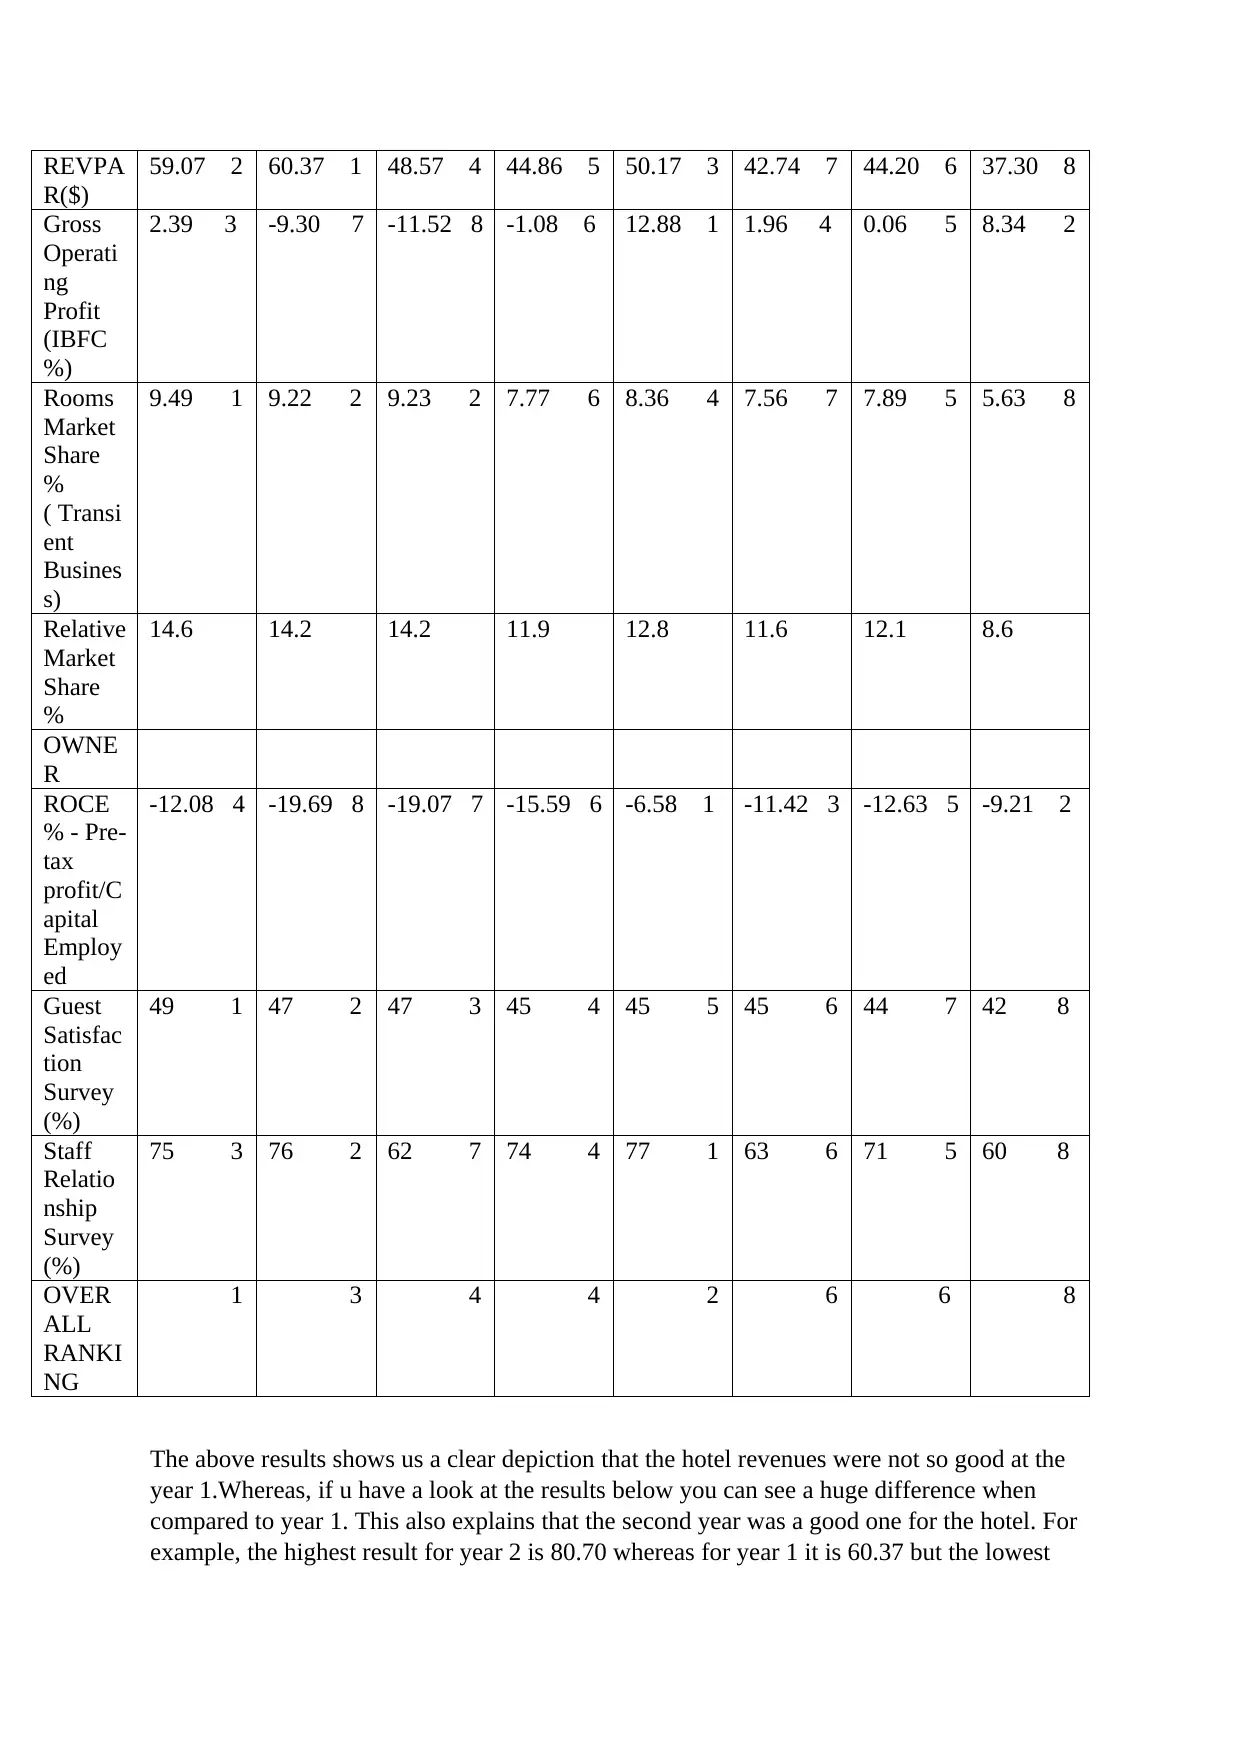
The above results shows us a clear depiction that the hotel revenues were not so good at the
year 1.Whereas, if u have a look at the results below you can see a huge difference when
compared to year 1. This also explains that the second year was a good one for the hotel. For
example, the highest result for year 2 is 80.70 whereas for year 1 it is 60.37 but the lowest
R($)
59.07 2 60.37 1 48.57 4 44.86 5 50.17 3 42.74 7 44.20 6 37.30 8
Gross
Operati
ng
Profit
(IBFC
%)
2.39 3 -9.30 7 -11.52 8 -1.08 6 12.88 1 1.96 4 0.06 5 8.34 2
Rooms
Market
Share
%
( Transi
ent
Busines
s)
9.49 1 9.22 2 9.23 2 7.77 6 8.36 4 7.56 7 7.89 5 5.63 8
Relative
Market
Share
%
14.6 14.2 14.2 11.9 12.8 11.6 12.1 8.6
OWNE
R
ROCE
% - Pre-
tax
profit/C
apital
Employ
ed
-12.08 4 -19.69 8 -19.07 7 -15.59 6 -6.58 1 -11.42 3 -12.63 5 -9.21 2
Guest
Satisfac
tion
Survey
(%)
49 1 47 2 47 3 45 4 45 5 45 6 44 7 42 8
Staff
Relatio
nship
Survey
(%)
75 3 76 2 62 7 74 4 77 1 63 6 71 5 60 8
OVER
ALL
RANKI
NG
1 3 4 4 2 6 6 8
The above results shows us a clear depiction that the hotel revenues were not so good at the
year 1.Whereas, if u have a look at the results below you can see a huge difference when
compared to year 1. This also explains that the second year was a good one for the hotel. For
example, the highest result for year 2 is 80.70 whereas for year 1 it is 60.37 but the lowest
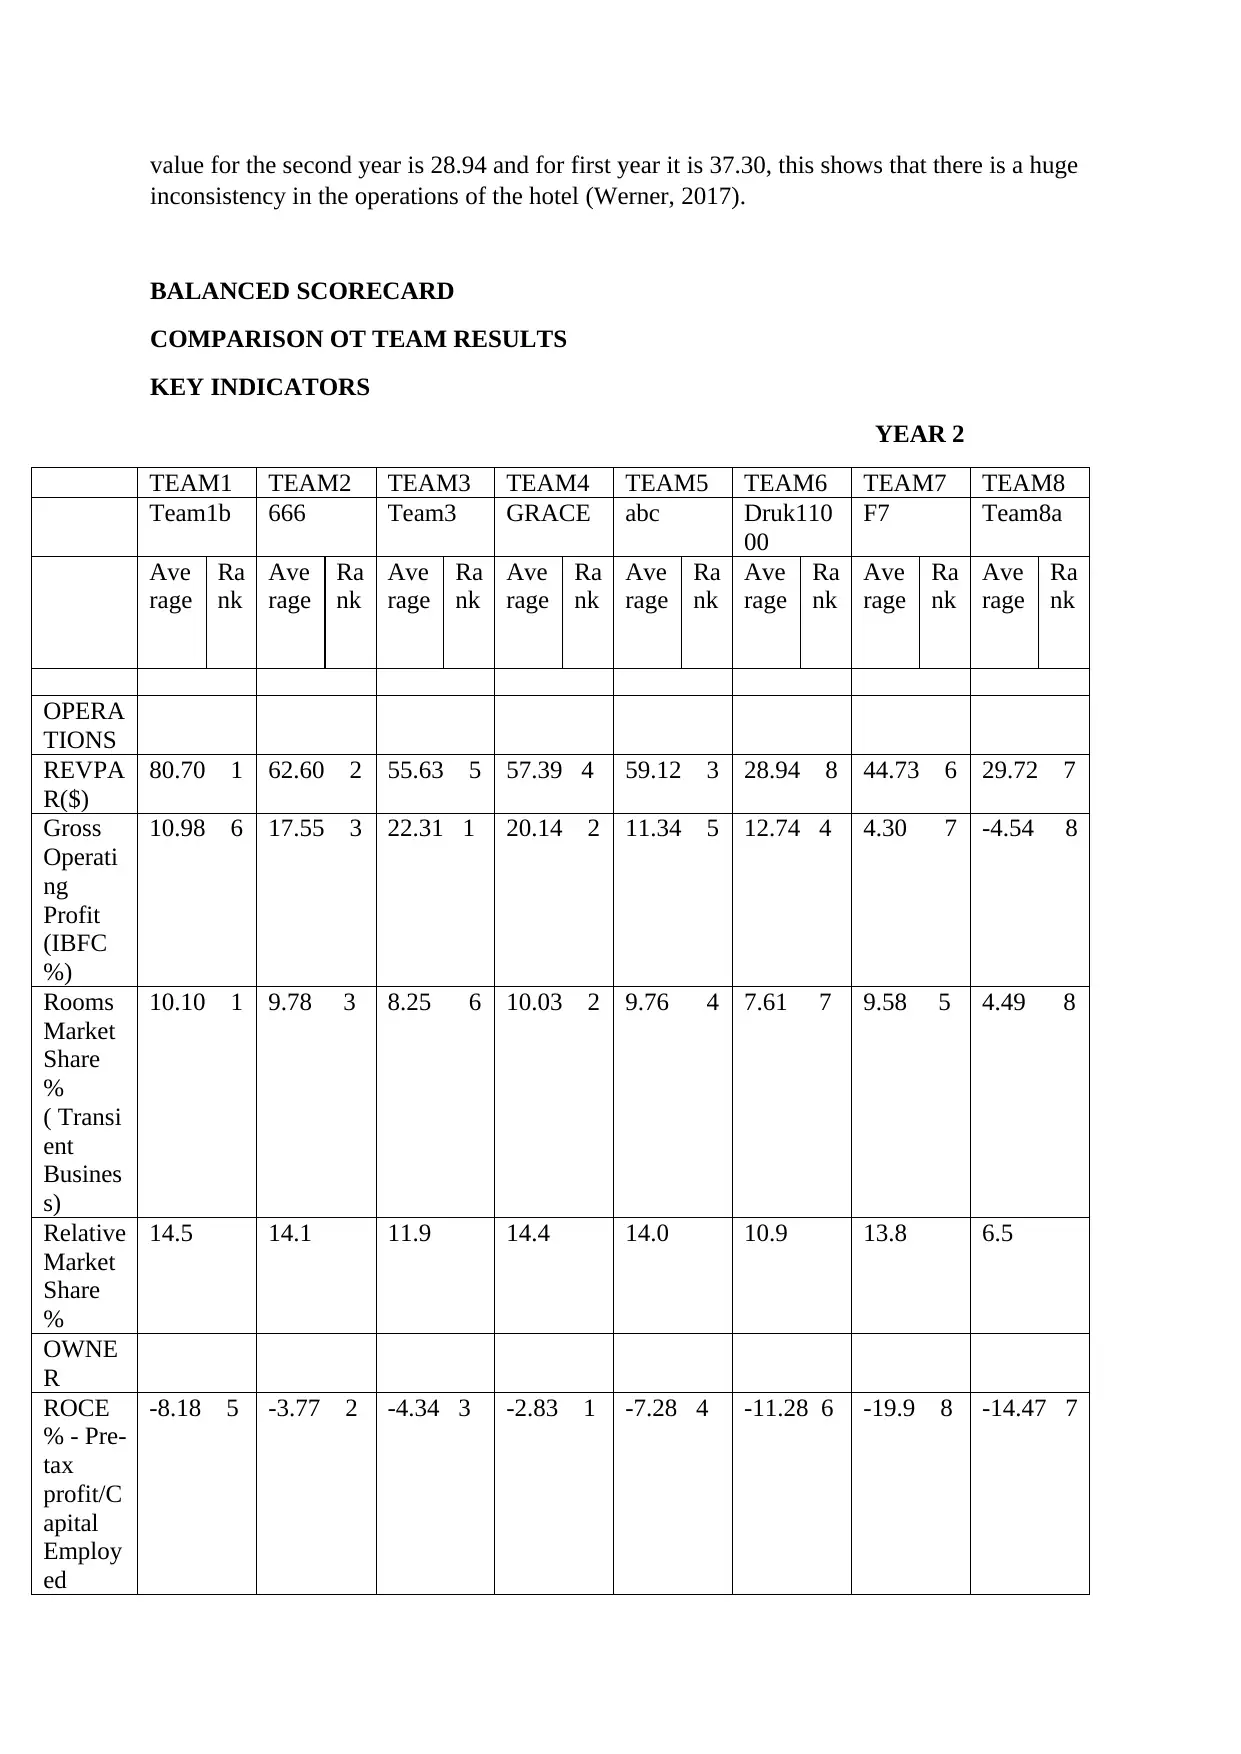
value for the second year is 28.94 and for first year it is 37.30, this shows that there is a huge
inconsistency in the operations of the hotel (Werner, 2017).
BALANCED SCORECARD
COMPARISON OT TEAM RESULTS
KEY INDICATORS
YEAR 2
TEAM1 TEAM2 TEAM3 TEAM4 TEAM5 TEAM6 TEAM7 TEAM8
Team1b 666 Team3 GRACE abc Druk110
00
F7 Team8a
Ave
rage
Ra
nk
Ave
rage
Ra
nk
Ave
rage
Ra
nk
Ave
rage
Ra
nk
Ave
rage
Ra
nk
Ave
rage
Ra
nk
Ave
rage
Ra
nk
Ave
rage
Ra
nk
OPERA
TIONS
REVPA
R($)
80.70 1 62.60 2 55.63 5 57.39 4 59.12 3 28.94 8 44.73 6 29.72 7
Gross
Operati
ng
Profit
(IBFC
%)
10.98 6 17.55 3 22.31 1 20.14 2 11.34 5 12.74 4 4.30 7 -4.54 8
Rooms
Market
Share
%
( Transi
ent
Busines
s)
10.10 1 9.78 3 8.25 6 10.03 2 9.76 4 7.61 7 9.58 5 4.49 8
Relative
Market
Share
%
14.5 14.1 11.9 14.4 14.0 10.9 13.8 6.5
OWNE
R
ROCE
% - Pre-
tax
profit/C
apital
Employ
ed
-8.18 5 -3.77 2 -4.34 3 -2.83 1 -7.28 4 -11.28 6 -19.9 8 -14.47 7
⊘ This is a preview!⊘
Do you want full access?
Subscribe today to unlock all pages.
Trusted by 1+ million students worldwide
Guest
Satisfac
tion
Survey
(%)
60 1 48 6 50 3 56 2 49 5 44 7 50 4 41 8
Staff
Relatio
nship
Survey
(%)
83 1 82 2 65 6 80 4 82 3 55 8 73 5 65 7
OVER
ALL
RANKI
NG
1 3 4 1 4 7 6 8
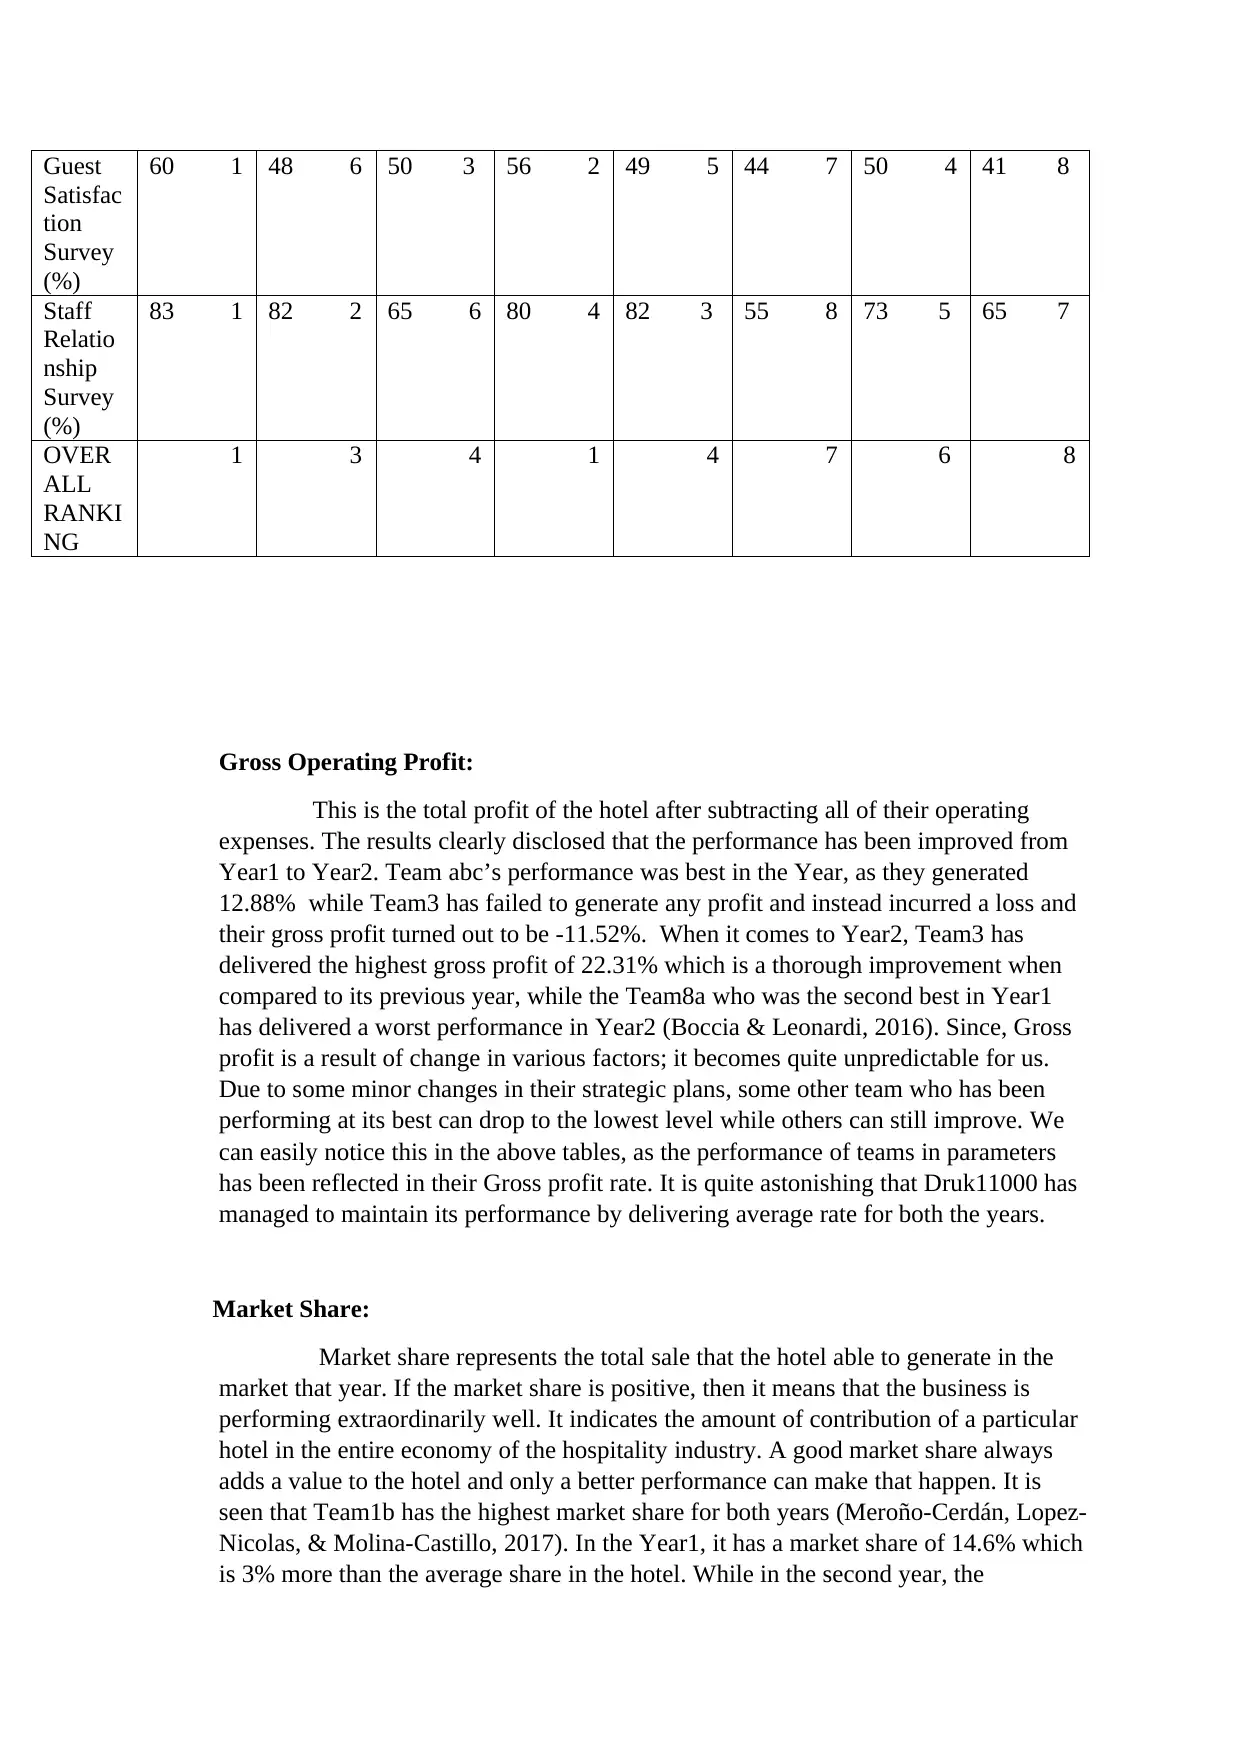
Gross Operating Profit:
This is the total profit of the hotel after subtracting all of their operating
expenses. The results clearly disclosed that the performance has been improved from
Year1 to Year2. Team abc’s performance was best in the Year, as they generated
12.88% while Team3 has failed to generate any profit and instead incurred a loss and
their gross profit turned out to be -11.52%. When it comes to Year2, Team3 has
delivered the highest gross profit of 22.31% which is a thorough improvement when
compared to its previous year, while the Team8a who was the second best in Year1
has delivered a worst performance in Year2 (Boccia & Leonardi, 2016). Since, Gross
profit is a result of change in various factors; it becomes quite unpredictable for us.
Due to some minor changes in their strategic plans, some other team who has been
performing at its best can drop to the lowest level while others can still improve. We
can easily notice this in the above tables, as the performance of teams in parameters
has been reflected in their Gross profit rate. It is quite astonishing that Druk11000 has
managed to maintain its performance by delivering average rate for both the years.
Market Share:
Market share represents the total sale that the hotel able to generate in the
market that year. If the market share is positive, then it means that the business is
performing extraordinarily well. It indicates the amount of contribution of a particular
hotel in the entire economy of the hospitality industry. A good market share always
adds a value to the hotel and only a better performance can make that happen. It is
seen that Team1b has the highest market share for both years (Meroño-Cerdán, Lopez-
Nicolas, & Molina-Castillo, 2017). In the Year1, it has a market share of 14.6% which
is 3% more than the average share in the hotel. While in the second year, the
Satisfac
tion
Survey
(%)
60 1 48 6 50 3 56 2 49 5 44 7 50 4 41 8
Staff
Relatio
nship
Survey
(%)
83 1 82 2 65 6 80 4 82 3 55 8 73 5 65 7
OVER
ALL
RANKI
NG
1 3 4 1 4 7 6 8
Gross Operating Profit:
This is the total profit of the hotel after subtracting all of their operating
expenses. The results clearly disclosed that the performance has been improved from
Year1 to Year2. Team abc’s performance was best in the Year, as they generated
12.88% while Team3 has failed to generate any profit and instead incurred a loss and
their gross profit turned out to be -11.52%. When it comes to Year2, Team3 has
delivered the highest gross profit of 22.31% which is a thorough improvement when
compared to its previous year, while the Team8a who was the second best in Year1
has delivered a worst performance in Year2 (Boccia & Leonardi, 2016). Since, Gross
profit is a result of change in various factors; it becomes quite unpredictable for us.
Due to some minor changes in their strategic plans, some other team who has been
performing at its best can drop to the lowest level while others can still improve. We
can easily notice this in the above tables, as the performance of teams in parameters
has been reflected in their Gross profit rate. It is quite astonishing that Druk11000 has
managed to maintain its performance by delivering average rate for both the years.
Market Share:
Market share represents the total sale that the hotel able to generate in the
market that year. If the market share is positive, then it means that the business is
performing extraordinarily well. It indicates the amount of contribution of a particular
hotel in the entire economy of the hospitality industry. A good market share always
adds a value to the hotel and only a better performance can make that happen. It is
seen that Team1b has the highest market share for both years (Meroño-Cerdán, Lopez-
Nicolas, & Molina-Castillo, 2017). In the Year1, it has a market share of 14.6% which
is 3% more than the average share in the hotel. While in the second year, the
Paraphrase This Document
Need a fresh take? Get an instant paraphrase of this document with our AI Paraphraser
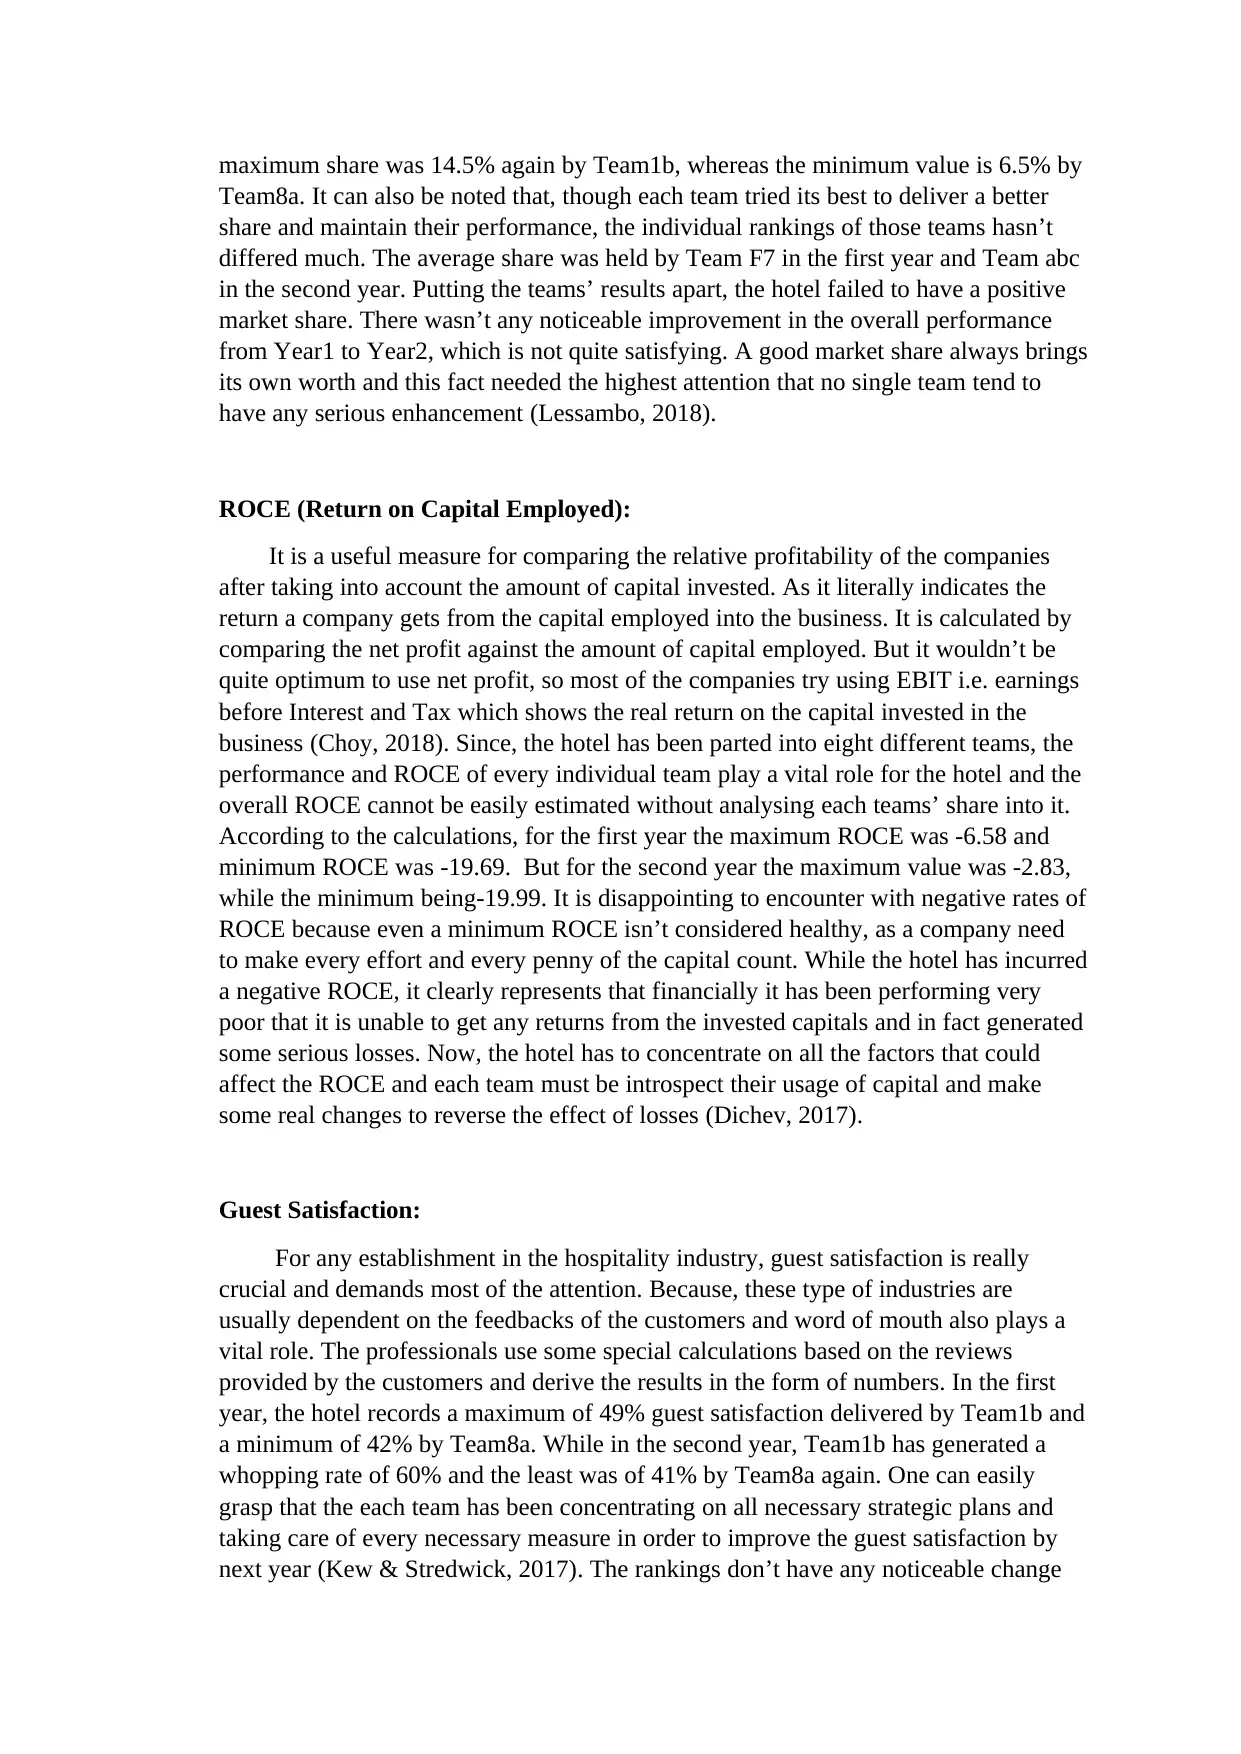
maximum share was 14.5% again by Team1b, whereas the minimum value is 6.5% by
Team8a. It can also be noted that, though each team tried its best to deliver a better
share and maintain their performance, the individual rankings of those teams hasn’t
differed much. The average share was held by Team F7 in the first year and Team abc
in the second year. Putting the teams’ results apart, the hotel failed to have a positive
market share. There wasn’t any noticeable improvement in the overall performance
from Year1 to Year2, which is not quite satisfying. A good market share always brings
its own worth and this fact needed the highest attention that no single team tend to
have any serious enhancement (Lessambo, 2018).
ROCE (Return on Capital Employed):
It is a useful measure for comparing the relative profitability of the companies
after taking into account the amount of capital invested. As it literally indicates the
return a company gets from the capital employed into the business. It is calculated by
comparing the net profit against the amount of capital employed. But it wouldn’t be
quite optimum to use net profit, so most of the companies try using EBIT i.e. earnings
before Interest and Tax which shows the real return on the capital invested in the
business (Choy, 2018). Since, the hotel has been parted into eight different teams, the
performance and ROCE of every individual team play a vital role for the hotel and the
overall ROCE cannot be easily estimated without analysing each teams’ share into it.
According to the calculations, for the first year the maximum ROCE was -6.58 and
minimum ROCE was -19.69. But for the second year the maximum value was -2.83,
while the minimum being-19.99. It is disappointing to encounter with negative rates of
ROCE because even a minimum ROCE isn’t considered healthy, as a company need
to make every effort and every penny of the capital count. While the hotel has incurred
a negative ROCE, it clearly represents that financially it has been performing very
poor that it is unable to get any returns from the invested capitals and in fact generated
some serious losses. Now, the hotel has to concentrate on all the factors that could
affect the ROCE and each team must be introspect their usage of capital and make
some real changes to reverse the effect of losses (Dichev, 2017).
Guest Satisfaction:
For any establishment in the hospitality industry, guest satisfaction is really
crucial and demands most of the attention. Because, these type of industries are
usually dependent on the feedbacks of the customers and word of mouth also plays a
vital role. The professionals use some special calculations based on the reviews
provided by the customers and derive the results in the form of numbers. In the first
year, the hotel records a maximum of 49% guest satisfaction delivered by Team1b and
a minimum of 42% by Team8a. While in the second year, Team1b has generated a
whopping rate of 60% and the least was of 41% by Team8a again. One can easily
grasp that the each team has been concentrating on all necessary strategic plans and
taking care of every necessary measure in order to improve the guest satisfaction by
next year (Kew & Stredwick, 2017). The rankings don’t have any noticeable change

from Year1 to year2, but it can be noted that the significant improvement speaks a lot
about the efforts made by all teams. If this continues to happen, then the hotel can
eventually manage to improve financially and enhance their gross profit and ROCE
rates by increasing number of customers.
Staff Satisfaction:
Staff satisfaction is also considered necessary in the hotels and a similar
calculation is used by the respective professionals to generate it in numbers and rates.
Every review is acknowledged and again a thorough analysis is performed to reflect
their feedback in the rates. The above results show that for the first year, the highest
staff satisfaction rate was 77% by Team abc and the least was 60% by Team8a. During
the second year, the highest value recorded was 83% by Team1b and the lowest was
55% generated by Team Druk 11000 (Fukukawa & Mock, 2011). One can make out
that there is a tough yet healthy competition between individual teams when it comes
to staff satisfaction rates. Each team strived to its own extent to improve their staff
satisfaction and the rates show a vast difference when compared to the previous year.
Also, it had become unpredictable this time, as the team which was generating an
average staff satisfaction has improved to a great level and delivered the highest rate in
the following year. This is a positive outcome, but when you gain consider individual
teams, some teams has shown a slow degree of improvement which can be rectified by
taking and following some necessary measures mentioned by the staff.
ADR (Average Daily Room):
It is a statistical method used by hoteliers to measure the performance of the
hotel. It is directly proportional to REVPAR, as it is quite obvious to guess that if
ADR increases then REVPAR increases. On the other hand, if ADR falls then
REVPAR also decreases (Goldmann, 2016). If we can pay some serious attention,
then we can notice that guest satisfaction rates also play a significant role in increasing
ADR. According to our results REVPAR has been inconsistent in both years, which
directly reflects that ADR would also have been inconsistent. Though you can make a
guess of ADR while calculating REVPAR, you can only bring a change in ADR by
concentrating on other factors like I have mentioned guest satisfaction and many other
capable strategic plans that can actually increase the number of customers visiting the
hotel. This again improves the financial parameters like Gross profit rate and market
share which represents the healthy growth of a company.
Occupancy Rate:
Every hotel management measure an average occupancy in the hotel rooms.
Occupancy rate and ADR are combined together to form REVPAR. It is also directly
proportional to REVPAR, which means if occupancy rate increases then REVPAR
also increases and it is the same in the opposite case. From the results obtained
REVPAR was quite inconsistent and no team has made any serious effort in improving
⊘ This is a preview!⊘
Do you want full access?
Subscribe today to unlock all pages.
Trusted by 1+ million students worldwide
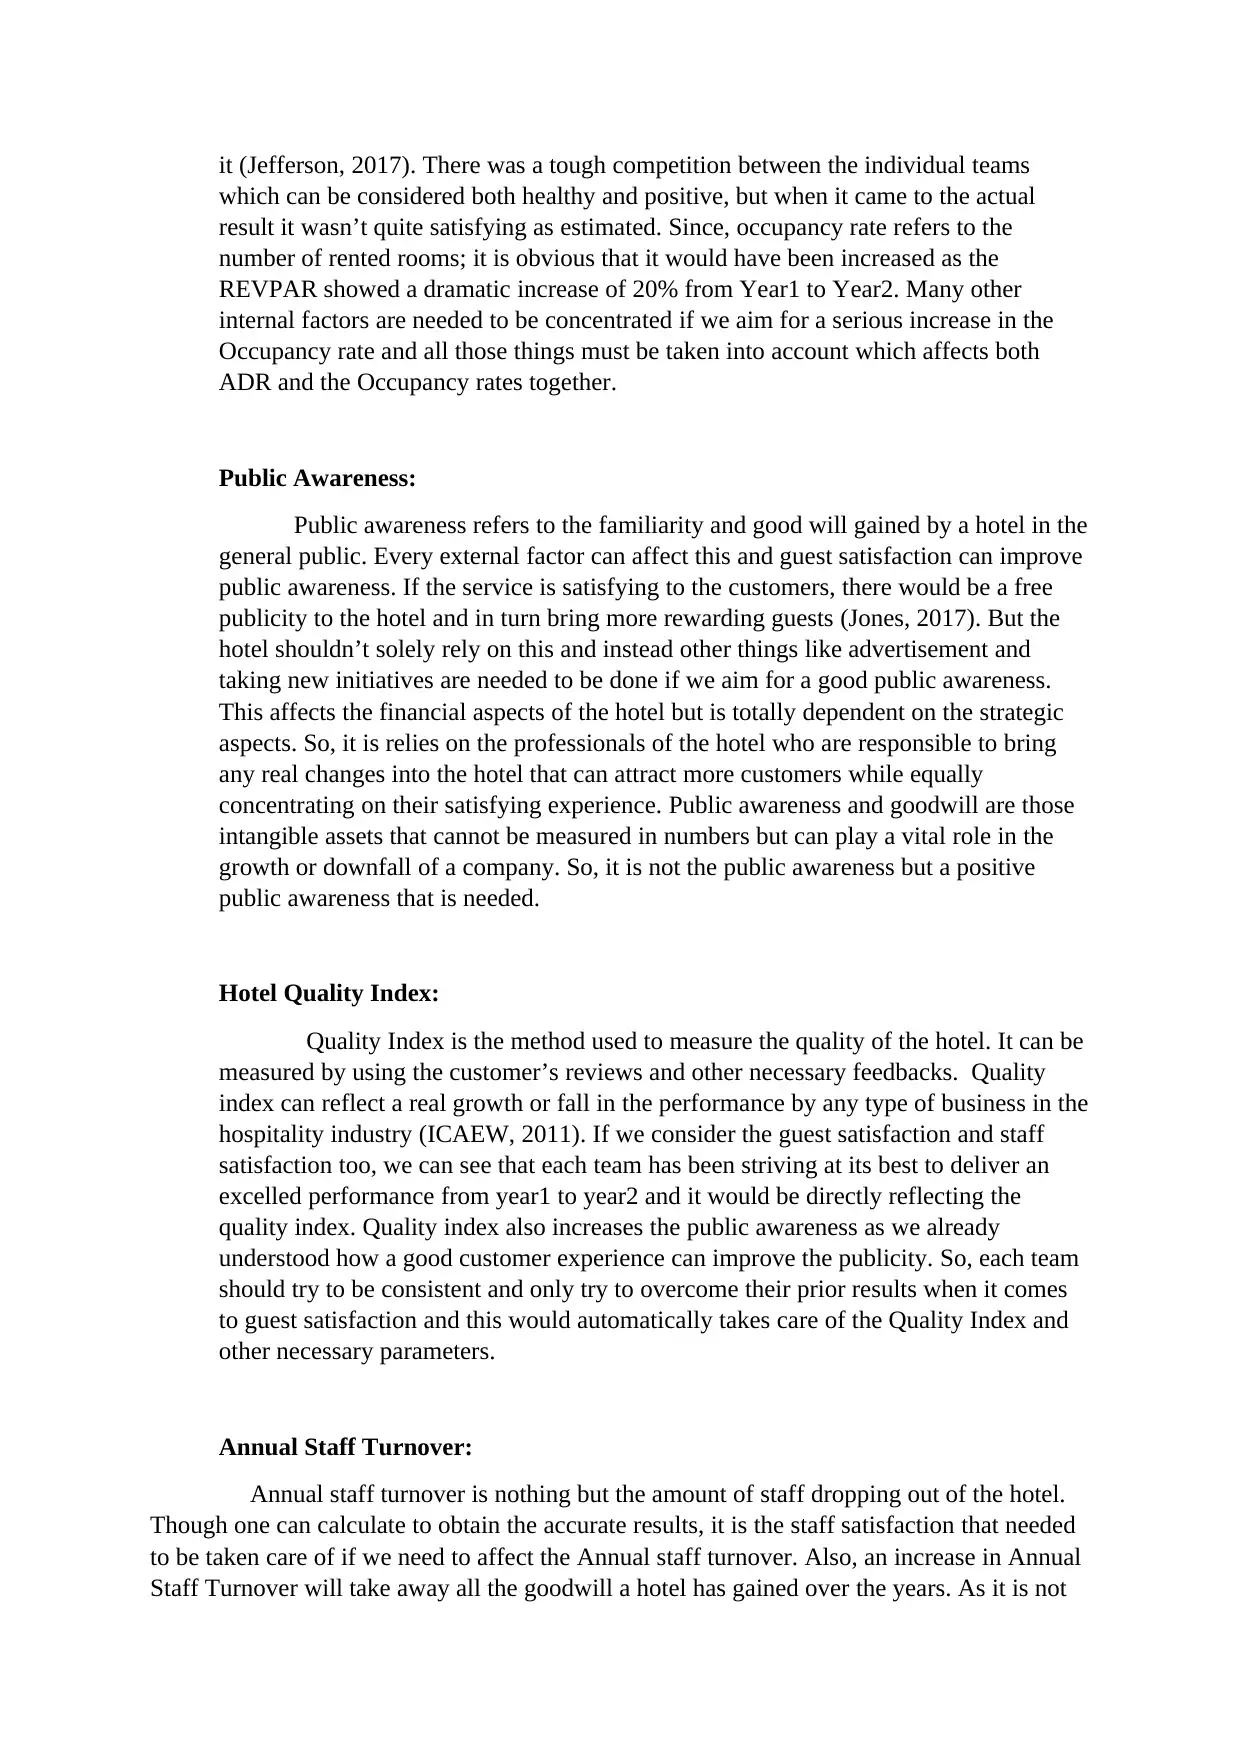
it (Jefferson, 2017). There was a tough competition between the individual teams
which can be considered both healthy and positive, but when it came to the actual
result it wasn’t quite satisfying as estimated. Since, occupancy rate refers to the
number of rented rooms; it is obvious that it would have been increased as the
REVPAR showed a dramatic increase of 20% from Year1 to Year2. Many other
internal factors are needed to be concentrated if we aim for a serious increase in the
Occupancy rate and all those things must be taken into account which affects both
ADR and the Occupancy rates together.
Public Awareness:
Public awareness refers to the familiarity and good will gained by a hotel in the
general public. Every external factor can affect this and guest satisfaction can improve
public awareness. If the service is satisfying to the customers, there would be a free
publicity to the hotel and in turn bring more rewarding guests (Jones, 2017). But the
hotel shouldn’t solely rely on this and instead other things like advertisement and
taking new initiatives are needed to be done if we aim for a good public awareness.
This affects the financial aspects of the hotel but is totally dependent on the strategic
aspects. So, it is relies on the professionals of the hotel who are responsible to bring
any real changes into the hotel that can attract more customers while equally
concentrating on their satisfying experience. Public awareness and goodwill are those
intangible assets that cannot be measured in numbers but can play a vital role in the
growth or downfall of a company. So, it is not the public awareness but a positive
public awareness that is needed.
Hotel Quality Index:
Quality Index is the method used to measure the quality of the hotel. It can be
measured by using the customer’s reviews and other necessary feedbacks. Quality
index can reflect a real growth or fall in the performance by any type of business in the
hospitality industry (ICAEW, 2011). If we consider the guest satisfaction and staff
satisfaction too, we can see that each team has been striving at its best to deliver an
excelled performance from year1 to year2 and it would be directly reflecting the
quality index. Quality index also increases the public awareness as we already
understood how a good customer experience can improve the publicity. So, each team
should try to be consistent and only try to overcome their prior results when it comes
to guest satisfaction and this would automatically takes care of the Quality Index and
other necessary parameters.
Annual Staff Turnover:
Annual staff turnover is nothing but the amount of staff dropping out of the hotel.
Though one can calculate to obtain the accurate results, it is the staff satisfaction that needed
to be taken care of if we need to affect the Annual staff turnover. Also, an increase in Annual
Staff Turnover will take away all the goodwill a hotel has gained over the years. As it is not
Paraphrase This Document
Need a fresh take? Get an instant paraphrase of this document with our AI Paraphraser
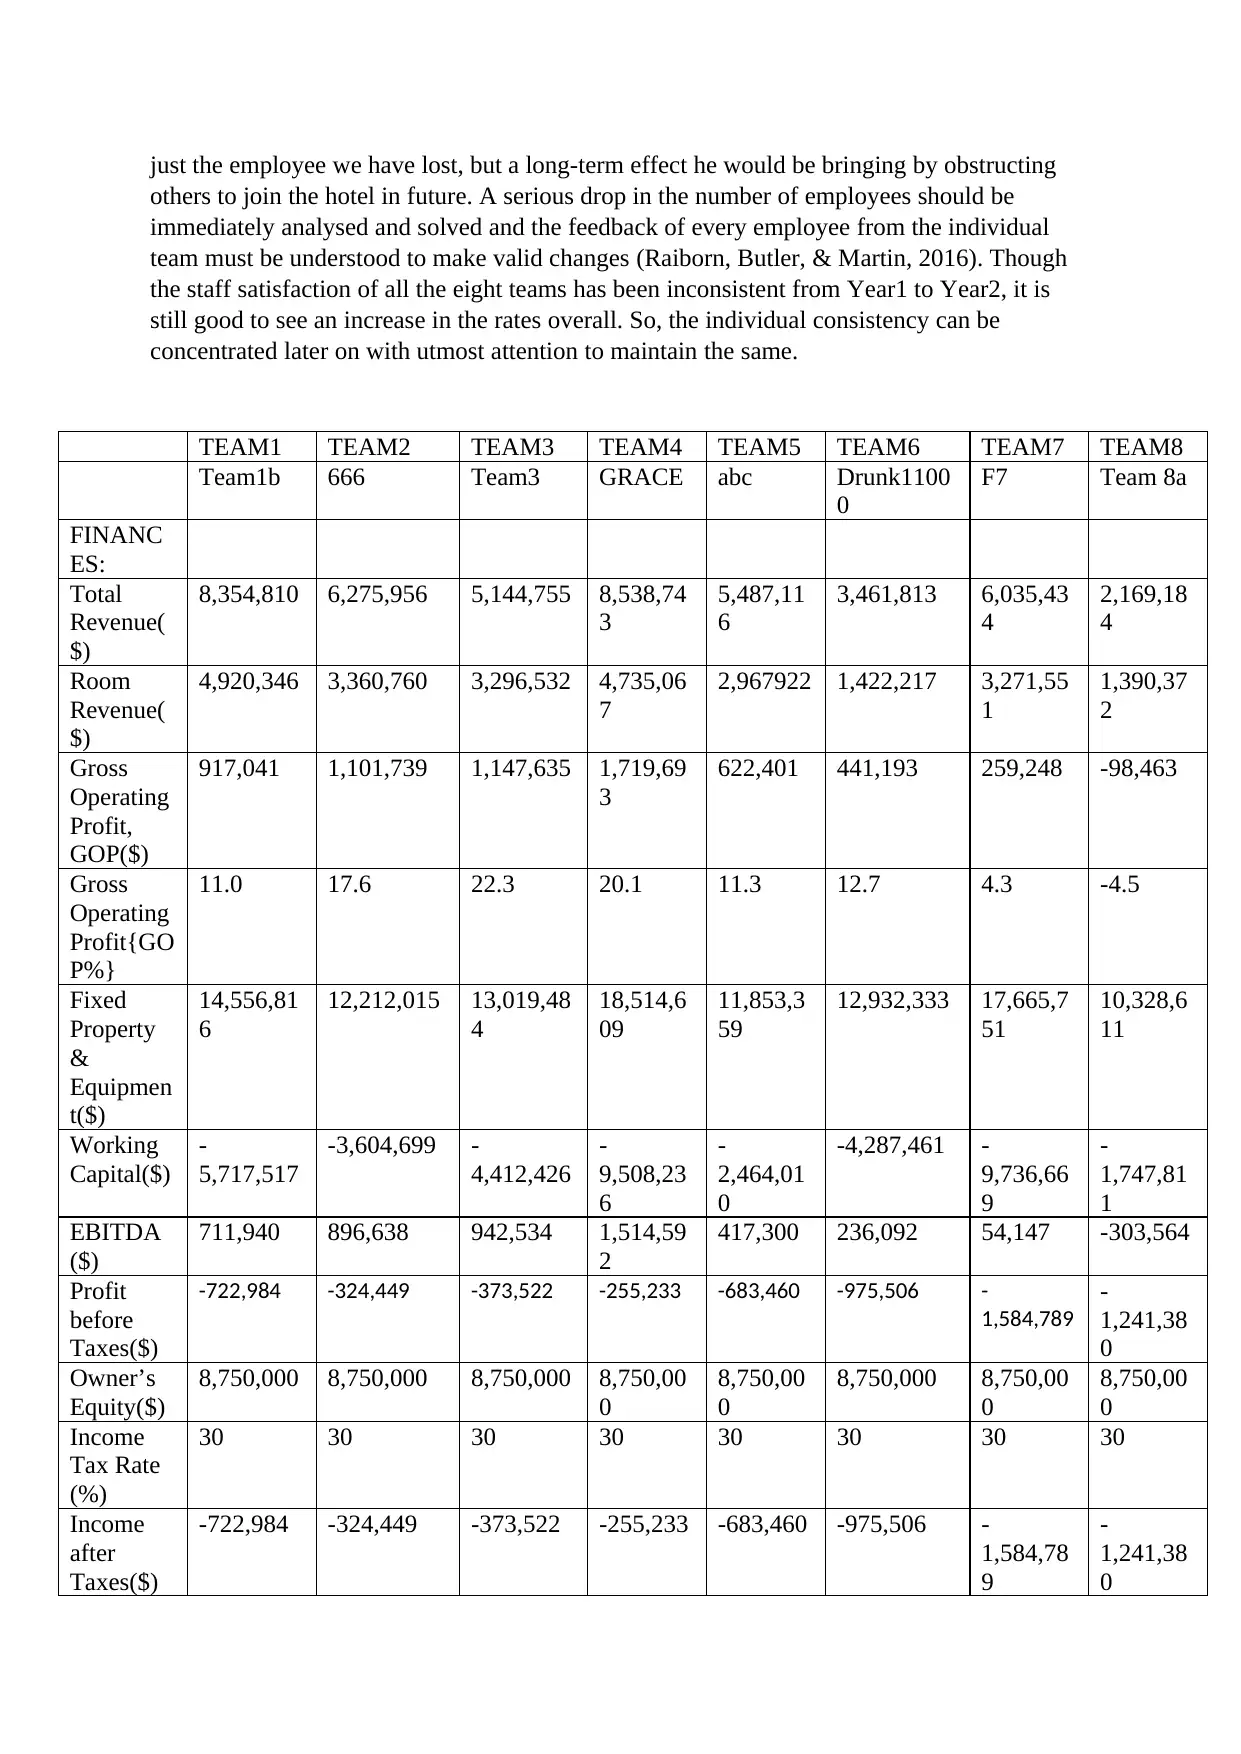
just the employee we have lost, but a long-term effect he would be bringing by obstructing
others to join the hotel in future. A serious drop in the number of employees should be
immediately analysed and solved and the feedback of every employee from the individual
team must be understood to make valid changes (Raiborn, Butler, & Martin, 2016). Though
the staff satisfaction of all the eight teams has been inconsistent from Year1 to Year2, it is
still good to see an increase in the rates overall. So, the individual consistency can be
concentrated later on with utmost attention to maintain the same.
TEAM1 TEAM2 TEAM3 TEAM4 TEAM5 TEAM6 TEAM7 TEAM8
Team1b 666 Team3 GRACE abc Drunk1100
0
F7 Team 8a
FINANC
ES:
Total
Revenue(
$)
8,354,810 6,275,956 5,144,755 8,538,74
3
5,487,11
6
3,461,813 6,035,43
4
2,169,18
4
Room
Revenue(
$)
4,920,346 3,360,760 3,296,532 4,735,06
7
2,967922 1,422,217 3,271,55
1
1,390,37
2
Gross
Operating
Profit,
GOP($)
917,041 1,101,739 1,147,635 1,719,69
3
622,401 441,193 259,248 -98,463
Gross
Operating
Profit{GO
P%}
11.0 17.6 22.3 20.1 11.3 12.7 4.3 -4.5
Fixed
Property
&
Equipmen
t($)
14,556,81
6
12,212,015 13,019,48
4
18,514,6
09
11,853,3
59
12,932,333 17,665,7
51
10,328,6
11
Working
Capital($)
-
5,717,517
-3,604,699 -
4,412,426
-
9,508,23
6
-
2,464,01
0
-4,287,461 -
9,736,66
9
-
1,747,81
1
EBITDA
($)
711,940 896,638 942,534 1,514,59
2
417,300 236,092 54,147 -303,564
Profit
before
Taxes($)
-722,984 -324,449 -373,522 -255,233 -683,460 -975,506 -
1,584,789
-
1,241,38
0
Owner’s
Equity($)
8,750,000 8,750,000 8,750,000 8,750,00
0
8,750,00
0
8,750,000 8,750,00
0
8,750,00
0
Income
Tax Rate
(%)
30 30 30 30 30 30 30 30
Income
after
Taxes($)
-722,984 -324,449 -373,522 -255,233 -683,460 -975,506 -
1,584,78
9
-
1,241,38
0
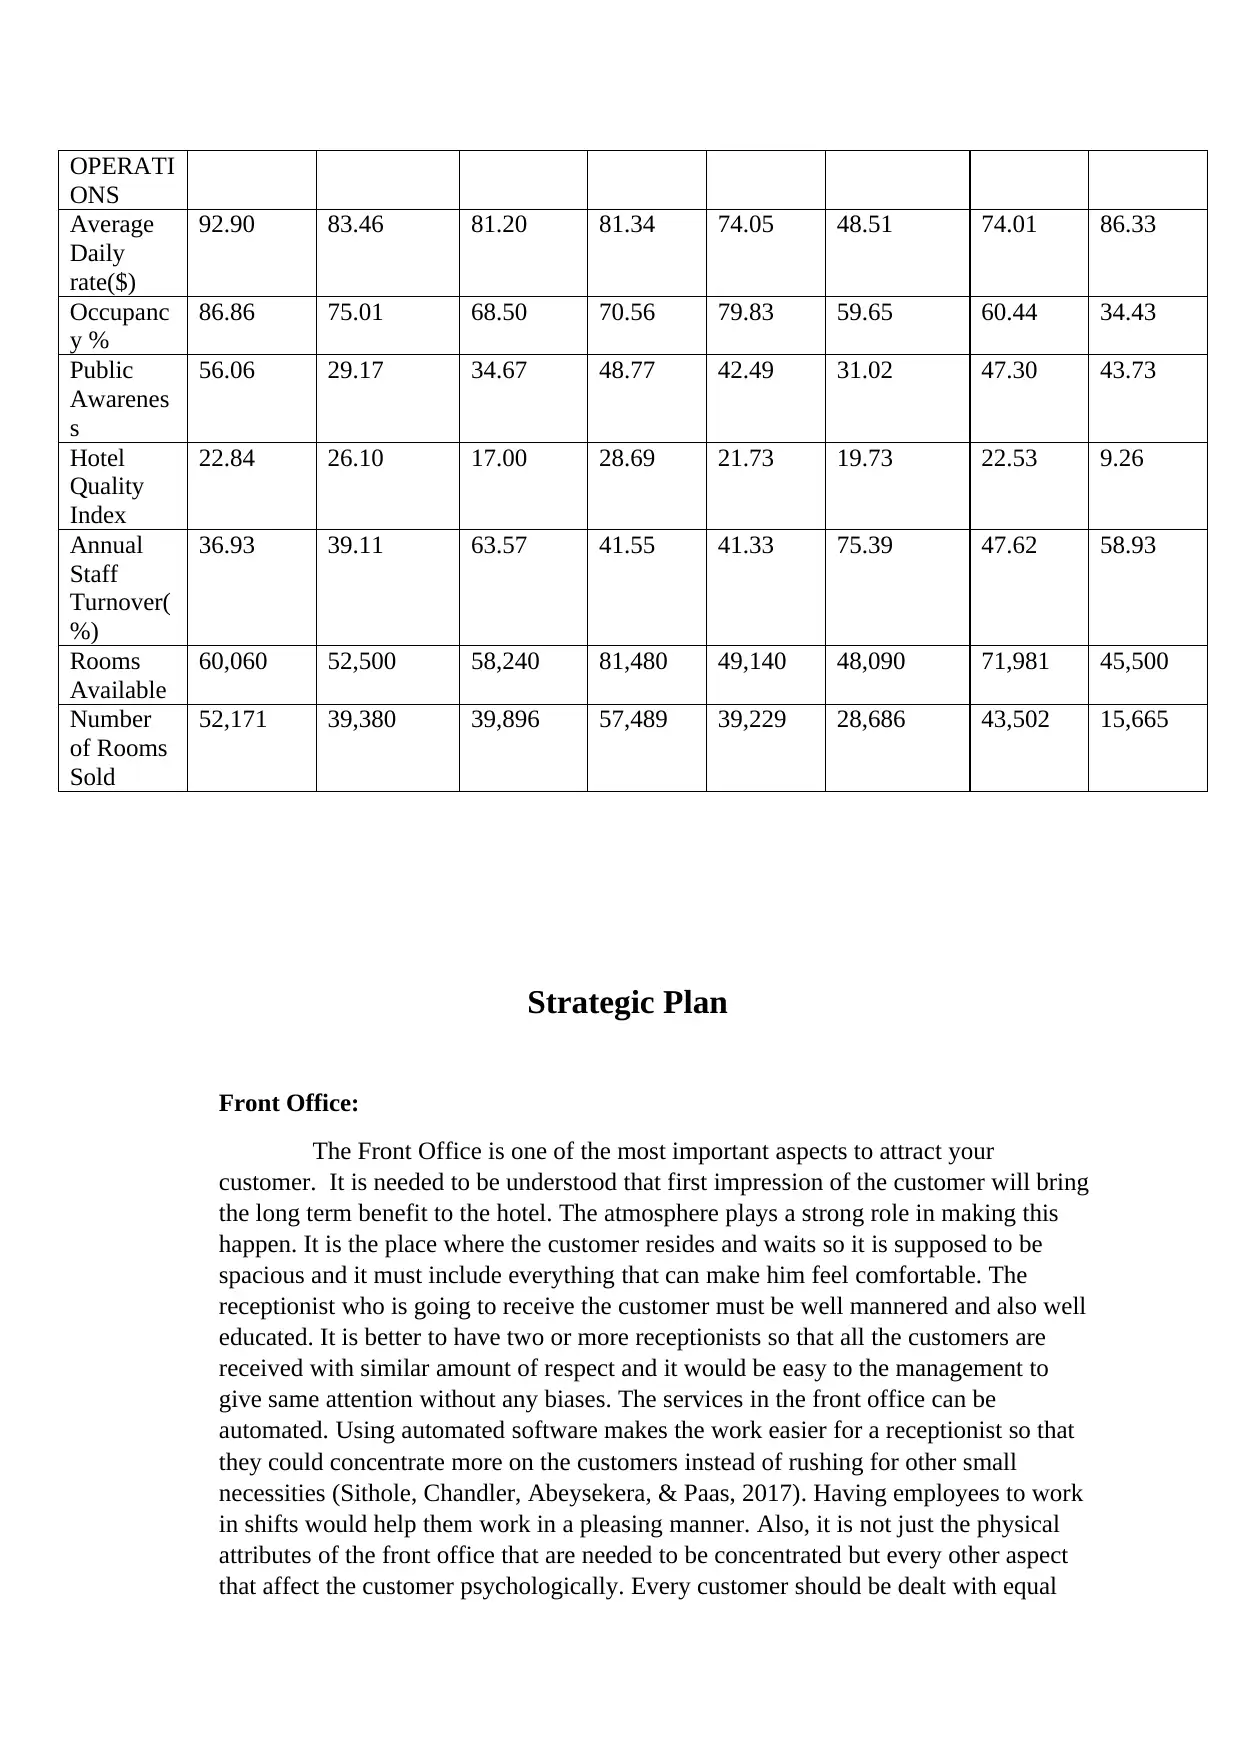
OPERATI
ONS
Average
Daily
rate($)
92.90 83.46 81.20 81.34 74.05 48.51 74.01 86.33
Occupanc
y %
86.86 75.01 68.50 70.56 79.83 59.65 60.44 34.43
Public
Awarenes
s
56.06 29.17 34.67 48.77 42.49 31.02 47.30 43.73
Hotel
Quality
Index
22.84 26.10 17.00 28.69 21.73 19.73 22.53 9.26
Annual
Staff
Turnover(
%)
36.93 39.11 63.57 41.55 41.33 75.39 47.62 58.93
Rooms
Available
60,060 52,500 58,240 81,480 49,140 48,090 71,981 45,500
Number
of Rooms
Sold
52,171 39,380 39,896 57,489 39,229 28,686 43,502 15,665
Strategic Plan
Front Office:
The Front Office is one of the most important aspects to attract your
customer. It is needed to be understood that first impression of the customer will bring
the long term benefit to the hotel. The atmosphere plays a strong role in making this
happen. It is the place where the customer resides and waits so it is supposed to be
spacious and it must include everything that can make him feel comfortable. The
receptionist who is going to receive the customer must be well mannered and also well
educated. It is better to have two or more receptionists so that all the customers are
received with similar amount of respect and it would be easy to the management to
give same attention without any biases. The services in the front office can be
automated. Using automated software makes the work easier for a receptionist so that
they could concentrate more on the customers instead of rushing for other small
necessities (Sithole, Chandler, Abeysekera, & Paas, 2017). Having employees to work
in shifts would help them work in a pleasing manner. Also, it is not just the physical
attributes of the front office that are needed to be concentrated but every other aspect
that affect the customer psychologically. Every customer should be dealt with equal
⊘ This is a preview!⊘
Do you want full access?
Subscribe today to unlock all pages.
Trusted by 1+ million students worldwide
attention and it is to be noted that a person shouldn’t return out of discomfort before
checking into the hotel.
Housekeeping:
For hotels, housekeeping can directly improve the revenue. It might seem
silly or small when compared to other major aspects, but if the house keeping is taken
care of, then it can promote guest satisfaction more than any other element in the hotel.
The housekeepers must take every measure to keep every individual room clean and
tidy. The housekeepers must have a good knowledge about all the equipment used in
the hotel. They should be polite and quite responding to the customer’s requests.
Meetings must be often arranged for housekeepers to teach them about all the premises
of the hotel and they must be acknowledged with all necessary updates from time to
time (Linden & Freeman, 2017). The Manager must check the housekeepers during
their work hours to make sure of their discipline and dedication in getting the work
done. The hotel must hire housekeepers from highly technical background where they
are aware of all sort of sophisticated aspects. The housekeepers must be given
continuous training which would make them deliver the work with necessary
improvements every time. It is also important to inform them that every room must be
treated equally and giving up on a single individual will cost the hotel in future. Along
with all these implications, it must also be noted that their feedbacks are equally
important in the prosperity of the hotel. With a good amount of concentration on all
these elements of housekeeping, it can be easily made a reliable and sustainable
department in generating good revenue.
F & B (Food and Beverages Department):
Food and Beverages Department plays a key role in hotel. The Managers
should often undergo inspections in order to make sure cleanliness. If not it would
create stomach ache to customers which would be a bad omen. It must be made sure
that the food has been delivered on time to the customers. Delaying the food would
make the customers frustrated. It’s better to have sufficient number of employee in this
department. There should be a head to this department, who is both reliable and
determined. Time plays a crucial role in this department and that’s where he would be
helping everything get done (Harold & James, 2017).
Marketing:
Marketing helps the hotel to reach to maximum people; it is simply the public
awareness as mentioned and discussed above. But marketing includes a healthy public
awareness where every individual would recognise the hotel about its positive aspects.
One must make sure that marketing is given proper funding and attention and not a
single penny pent would be waste on quality marketing. Marketing helps the hotel to
get increased number of bookings, ADR, REVPAR, Occupancy rates. Marketing
should be done on the appropriate platform in order to seek attention of the larger
Paraphrase This Document
Need a fresh take? Get an instant paraphrase of this document with our AI Paraphraser
audience. Today internet is a part of everyone’s life, so it would be better to go for
digital marketing by employing technically strong individuals to bring some change.
There are many social media platforms like Facebook, Twitter and Instagram and each
of these can be used to market the hotel and it would immediately spread like a
wildfire within a short span (Raiborn, Butler, & Martin, 2016). The hotel should also
have an official website in where all the booking facilities and other amenities can be
provided. Despite of this, entire hotel staff can also use pamphlets, billboards and
brochures whenever possible without hindering customer experience for marketing.
So, this would guarantee that maximum amount of customers who leave the hotel will
bring more visitors in the future. But it must be noted that a good marketing would be
of no use if the customer satisfaction is not equally concentrated. So, each of the
crucial aspects must be complimenting each other.
Human Resource:
Human resource is a vital department for any business. It is the department that
is responsible for hiring employee. The employee in this department must be well
educated and highly reliable as he would be bringing several other employees into the
hotel. It must also be noted that he must be aware about every single department and
aspect involved in a hospitality industry as he will hire an employee based on the same
knowledge. This department is also responsible to analyse and understand whether any
of the departments are having staff lees or more than required numbers. The Human
resource department must listen to the queries of the employee and make sort them out
within a short span. They are supposed to take important subjects to the Manager so
that they could clarify further (Farmer, 2018). This department has to come up with
policies that benefit the employees, so that they could work with more enthusiasm. So,
indirectly they would also be affecting the staff satisfaction to a greater extent. The
Human resource department structures the culture of the hotel and help it represent the
vision and mission of the business among public.
Conclusion:
We have considered the REVPAR, Gross profit rates, Relative market shares,
ROCE, guest and staff satisfaction of all teams. It depicts their individual contribution to the
hotel and their performance would be directly affecting the establishment. Also, it is needed
to be understood that there isn’t any consistency in their performance and thus there is no use
of any predictability. But instead all the elements where they are lacking must be
concentrated and some changes must be employed in order to bring an improvement. When it
comes to overall ranking, Team1b has been performing exceptionally well in all the
departments in Year1 and Team8a has failed to deliver any satisfying results when it comes
to REVPAR and ROCE crucially. The situation hasn’t changed in the Year2, though the
performance of individual team has been improved. It can be clearly seen that the other
team’s lack a competitive spirit leading to their average performances in the both years
without any real struggle to enhance and excel when compared to the leading Team. Team
GRACE has been consistently average which can considered positively that it took the
maximum care to maintain its performance but a necessary care would be appreciated. When
it comes to Team3, Team Druk11000, Team abc and TeamF7 there was a bit of competition,
but every team was overcoming the other in different aspects. If the strategic plans are given
the utmost importance along with the financial aspects, then we can see a steady growth in
the overall performance of the hotel.
References
Alexander, F. (2016). The Changing Face of Accountability. The Journal of Higher Education, 71(4),
411-431.
Arnott, D., Lizama, F., & Song, Y. (2017). Patterns of business intelligence systems use in
organizations. Decision Support Systems, 97, 58-68.
Boccia, F., & Leonardi, R. (2016). The Challenge of the Digital Economy. Markets, Taxation and
Appropriate Economic Models, 1-16.
Choy, Y. K. (2018). Cost-benefit Analysis, Values, Wellbeing and Ethics: An Indigenous Worldview
Analysis. Ecological Economics, 3(1), 145.
doi:https://doi.org/10.1016/j.ecolecon.2017.08.005
Dichev, I. (2017). On the conceptual foundations of financial reporting. Accounting and Business
Research, 47(6), 617-632. doi:https://doi.org/10.1080/00014788.2017.1299620
Farmer, Y. (2018). Ethical Decision Making and Reputation Management in Public Relations. Journal
of Media Ethics, 33(1), 1-12.
Fukukawa, H., & Mock, T. (2011). Audit risk assessments using belief versus probability. Auditing: A
Journal of Practice & Theory, 30(1), 75-99.
Goldmann, K. (2016). Financial Liquidity and Profitability Management in Practice of Polish Business.
Financial Environment and Business Development, 4(3), 103-112.
Harold, L., & James, L. (2017). Impact of Organizational culture on Employees Performance.
Industrial Engineering Letters, 5(9), 53.
ICAEW. (2011). Measurement of Financial Reporting. Financial Reporting Faculty, 6-22.
⊘ This is a preview!⊘
Do you want full access?
Subscribe today to unlock all pages.
Trusted by 1+ million students worldwide
1 out of 13
Related Documents


Your All-in-One AI-Powered Toolkit for Academic Success.
+13062052269
info@desklib.com
Available 24*7 on WhatsApp / Email
![[object Object]](/_next/static/media/star-bottom.7253800d.svg)
Unlock your academic potential
Copyright © 2020–2026 A2Z Services. All Rights Reserved. Developed and managed by ZUCOL.