Quality Control: Hounsfield Test Pieces and Process Capability Report

Verified

Added on  2022/08/31

|7
|1560
|25
Report
AI Summary
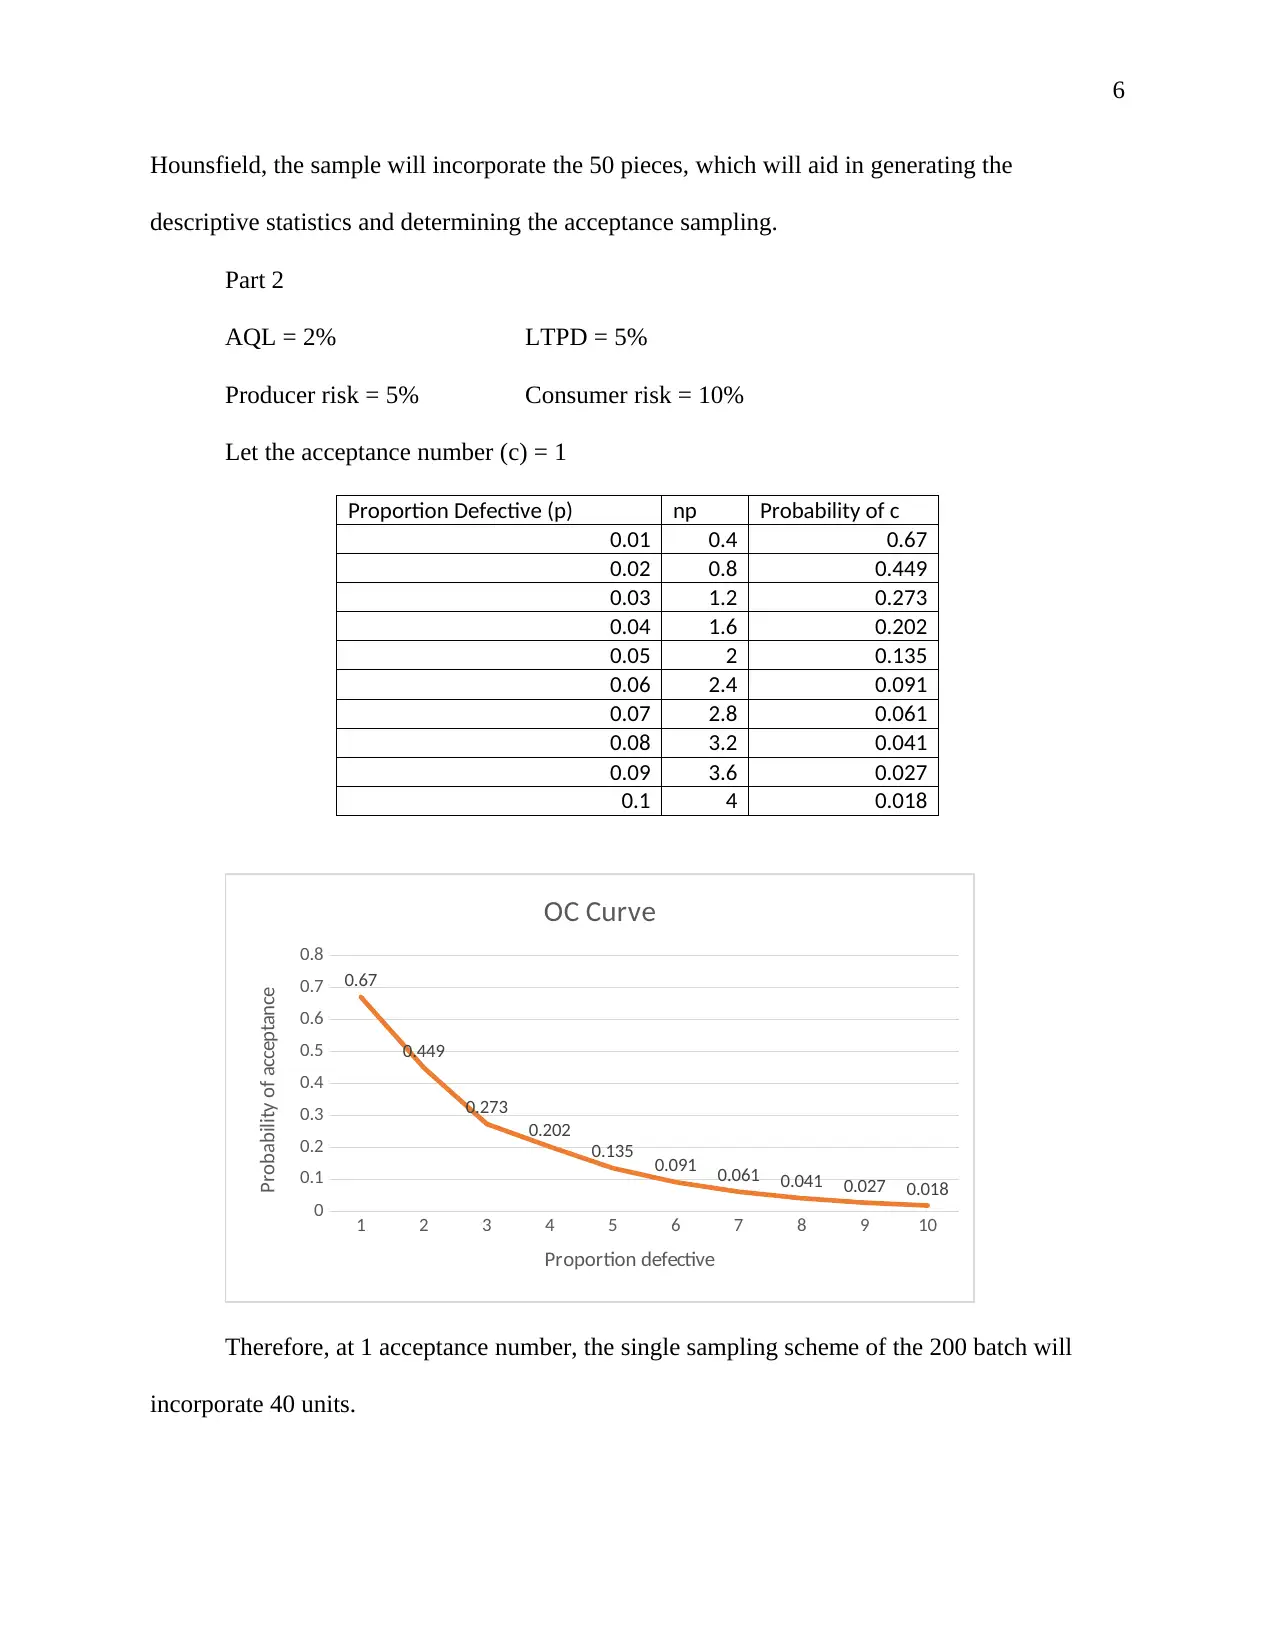
This report delves into the critical aspects of quality control within a manufacturing context, specifically addressing the production of Hounsfield Test Pieces. The report begins by defining quality and its importance in production, highlighting the use of quality control (QC) to meet customer demands and specifications. It explores two primary QC methods: inspection and statistical quality control (SQC), detailing their advantages and methodologies. The report then transitions to a practical application, analyzing a scenario where a company needs to produce 200 Hounsfield Test Pieces. It outlines the decision-making process of a control manager, including the selection of SQC techniques, such as descriptive statistics, statistical process control (SPC), and acceptance sampling, to ensure product quality. The report also includes a detailed analysis of the measurements, strategies, and calculations needed to determine the process capability index for the machines involved in the production. Furthermore, it provides a breakdown of the acceptance sampling plan based on AQL and LTPD values, determining the sample size required for the batch. Overall, the report offers a comprehensive overview of quality control principles and their practical application in a manufacturing setting, providing valuable insights for quality control managers.
Document Page
1
Quality Control
Name:
Institution:
tabler-icon-diamond-filled.svg

Secure Best Marks with AI Grader

Need help grading? Try our AI Grader for instant feedback on your assignments.
Document Page
2
Task1
There are no doubts quality is paramount in the production or manufacturing of products.
Quality involves specific predetermined attributes of a commodity, which include color, weight,
shape, composition, and dimensions, among others. Therefore, quality is performance of the
product as per the demands made by the producer to the clients or consumers (Sinha, 2019).
Notably, the demands by producers can be explicit through the terms of the expectations of
average consumer or written contract. On the other side, performance of a commodity involves
the sole function or services that the commodity offers to the end user (Sinha, 2019). Generally,
a commodity is defined as a quality product if it satisfies specific criteria for it functioning,
during its time of manufacture and over a period of its use.
As a result, both quality assurance and control measures are used by manufacturers to
ensure the products produced abide by the performance expectations. Quality control (QC) is a
strategy in which the products are produced to conform to the specifications determined by the
client’s demand and transforms into distribution and manufacturing requirements. Besides, the
strategy aids in making manufacturing process “right” instead of discovering or rejecting
deformed products (Sinha, 2019). Generally, QC is a technique in which products of uniform
acceptable quality are manufactured. There are various advantages of QC; for instance, it aids the
manufacturers in fixing responsibility of workers in the production process; besides, QC aid in
reducing the costs of production by improving efficiency, standardization, and working
conditions. Moreover, QC enables the manufacturer to evaluate whether the product conforms to
the set standards, which further aids in the adoption of necessary actions to comply with the set
standards.
Document Page
3
There are two major methods used in quality control, which include inspection and
statistical quality control (SQC). Inspection involves critical checking of products and the
process used; however, it is only applicable on small scale production. The method incorporates
three aspects, which include product inspection, process inspection, and inspection analysis
(Sinha, 2019). Product inspection involves the assessment of the final product to ensure it
complies with the set standard for quality, whereas process inspection ensures that the machines,
equipment, ad raw materials used in the production process comply with the standard quality.
The above aspect not only saves wastage of material by preventing process bottle necks but also
ensures the manufacture of quality commodity. On the other side, inspection analysis involves
the assessment of both product and process inspection, which aids the manufacturer to identify
the exact faulty points in manufacturing process. Generally, inspection has three stages, which
include input, work-in-progress, and final product inspection.
SQC involves the use of statistical techniques, such as probability, sampling, and graphs
to evaluate and control the quality of product. The method is mainly used in continuous process
industries and mass production process; besides, it incorporates a set of methods for ongoing
procedures, system, and outcomes (Toledo, Lizarelli, & Santana, 2017). There are three steps
involved in SQC, which include analysis of samples, control charts, and corrective measures.
Analysis of samples depends on the sampling techniques used, whereby a population of interest
is identified and a sample representing the population is drawn and analyzed. Among, the various
methods of sampling both simple and stratified random sampling are the most appropriate in
drawing a representative sample.
The results of any statistical analysis are efficiently represented in a graph or chart use
control charts. There are various graphical methods or tools that aid in the analysis of a given
Document Page
4
dataset, such as a scatter diagram, Pareto chart, control charts, and frequency plots (McClintock,
2016). Among the above, Control charts tend to be the most effective tool for SQC since they
comprise of two charts, the X-bar chart and R-chart The control charts are drawn through the
following steps; measuring the characteristics of the sample, computing the mean and standard
deviation of the sample, and plotting of the data in reference to the mean and standard deviation.
Notably, the control charts can be drawn using the SQC software, such as excel, SPSS, minitab,
and STATA, among others (Gejdoš, 2015).
The measures are entered into SQC software whereby both various descriptive statistics
are computed. Notably, the descriptive statistics, particularly the mean and standard deviation are
used in computing both the lower and upper control limits (standard units on either sides of the
mean) that are essential in creating an X-bar chart. The chart can be utilized to monitor or
evaluate the manufacturing process. Besides, the software can be used in creating another QC
chart known as the R chart that monitors whether the process is under control and forecast the
variation. (Gejdoš, 2015). The last step of SQC, corrective measure involves the identification of
points and causes of deviation thus enables the manufacturer to adopt measure to control the
quality of the product.
Task 2
As evident, the company involves in the production of batch quantities of small
components for local industry. Moreover, the company has received a request for 200 Hounsfield
Test Pieces in various specification. Therefore, as the control manager one should decide what
measurements, strategies, and analysis the company should carry out to calculate the process
capability index for the machines.
tabler-icon-diamond-filled.svg

Secure Best Marks with AI Grader

Need help grading? Try our AI Grader for instant feedback on your assignments.
Document Page
5
Part 1
Dear Production Manager,
It has come to my notice that we have received a request for approximately 200
Hounsfield Test Pieces in numerous material specifications. As our company policy states
“Quality and durability are ensured” it is our mandate to provide not only quality but also
durable products to the clients. Therefore, an effective quality control method will be used in
ensuring the batch conforms to the policy. Among the two QC methods the company will adopt
the SQC technique since it involves statistical analysis and interpretation of results. Notably for
the technique to provide adequate results, there three process that will be incorporated, which
include descriptive statistics, statistical process control (SPC), and acceptance sampling.
The descriptive statistics will be used to expose the quality characteristics and
relationships, which include average, range, standard deviation, and distribution of data. SPC
will aid in inspecting a random sample of the Hounsfield Test Pieces from the company’s
production unit and decide whether the manufacturing process in producing products with
characteristics that fall within the requested customer specifications. Consequently, acceptance
sampling will randomly assess a sample of Hounsfield and justify if it is prudent to accept the
entire lot based on the results (accepting or rejecting the products).
As exhibited, there are various measurements of Hounsfield Test Piece, which include
internal and external diameter and length. However, the above measurements have been
summarized by the cross-sectional area of the product, which is approximately 20mm2.
Therefore, to assess if the products conform to the set standards (quality) the cross-sectional area
of a random sample of the products will measured. Since the customer requires a total of 200
Document Page
6
Hounsfield, the sample will incorporate the 50 pieces, which will aid in generating the
descriptive statistics and determining the acceptance sampling.
Part 2
AQL = 2% LTPD = 5%
Producer risk = 5% Consumer risk = 10%
Let the acceptance number (c) = 1
Proportion Defective (p) np Probability of c
0.01 0.4 0.67
0.02 0.8 0.449
0.03 1.2 0.273
0.04 1.6 0.202
0.05 2 0.135
0.06 2.4 0.091
0.07 2.8 0.061
0.08 3.2 0.041
0.09 3.6 0.027
0.1 4 0.018
1 2 3 4 5 6 7 8 9 10
0
0.1
0.2
0.3
0.4
0.5
0.6
0.7
0.8
0.67
0.449
0.273
0.202
0.135 0.091 0.061 0.041 0.027 0.018
OC Curve
Proportion defective
Probability of acceptance
Therefore, at 1 acceptance number, the single sampling scheme of the 200 batch will
incorporate 40 units.
Document Page
7
References
Gejdoš, P. (2015). Continuous Quality Improvement by Statistical Process Control. Procedia
Economics and Finance, 565-572.
McClintock, T. (2016). Tools and Techniques Useful in Quality Planning, Assurance,
andControl. Global Knowledge.
Sinha, D. (2019). Quality Control (QC): Definition, Importance and Tools of Quality Control.
Retrieved from Your Article Library Website:
http://www.yourarticlelibrary.com/production-management/quality-control-qc-definition-
importance-and-tools-of-quality-control/41085
Toledo, J. C., Lizarelli, F. L., & Santana, M. B. (2017). Success factors in the implementation of
statistical process control: action research in a chemical plant. SciELO Analytics, 47-54.
chevron_up_icon
1 out of 7
circle_padding
hide_on_mobile
zoom_out_icon
logo.png

Your All-in-One AI-Powered Toolkit for Academic Success.

Available 24*7 on WhatsApp / Email

[object Object]