Accounting Financial Analysis Report: Singapore Luxury Watch Market
VerifiedAdded on 2020/05/16
|19
|3080
|51
Report
AI Summary
This report provides a comprehensive financial analysis of The Hour Glass and Cortina Holdings, two key players in the Singapore luxury watch market. The analysis covers the years 2015, 2016, and 2017, assessing their performance through various financial ratios, including solvency, profitability, and efficiency ratios. The report begins with an executive summary and market overview, introducing the companies and the market context. It then delves into sustainability and strategic considerations before comparing the financial structures, specifically focusing on long-term and short-term solvency risks. Performance analysis includes an examination of profitability, return on equity, return on assets, and price-earnings ratios. The conclusion offers financial and business perspectives, culminating in recommendations for improving performance. The report uses the financial data to compare the two companies and evaluate their financial health and market position.
Running head: ACCOUNTING FINANCIAL ANALYSIS REPORT
Accounting financial analysis report
Name of the student
Name of the university
Author note
Accounting financial analysis report
Name of the student
Name of the university
Author note
Paraphrase This Document
Need a fresh take? Get an instant paraphrase of this document with our AI Paraphraser
1ACCOUNTING FINANCIAL ANALYSIS REPORT
Table of Contents
1.0 Executive Summary........................................................................................................2
2.0 Introduction..........................................................................................................................3
2.1 Market overview..............................................................................................................3
2.2 Overview of The Hour Glass...........................................................................................3
2.3 Overview of Cortina Holdings Limited...........................................................................3
3.0 Sustainability and Strategy...................................................................................................4
4.0 Comparing the financial structure........................................................................................5
4.1 Long term solvency risk...................................................................................................5
4.2 Short-term solvency risk..................................................................................................6
5.0 Performance analysis...........................................................................................................8
5.1 Profitability......................................................................................................................8
5.2 Return on equity ratio.......................................................................................................9
5.3 Return on asset ratio.......................................................................................................10
5.4 Price earnings ratio.........................................................................................................10
6.0 Conclusion and recommendation.......................................................................................11
6.1 Financial perspective......................................................................................................11
6.2 Business perspective......................................................................................................12
7.0 Appendix............................................................................................................................13
Reference..................................................................................................................................14

2ACCOUNTING FINANCIAL ANALYSIS REPORT
⊘ This is a preview!⊘
Do you want full access?
Subscribe today to unlock all pages.
Trusted by 1+ million students worldwide
3ACCOUNTING FINANCIAL ANALYSIS REPORT
1.0 Executive Summary
The main objective of this report is to focus on the luxury watches market of Singapore and
analyse the performance of two companies in the same market for the last 3 years. for this
particular report focus will be on The Hour Glass and its performance will be compared with
its competitor Cortina Holdings to get an overview of the market. The performance of both
the companies will be assessed through various ratios like profitability ratios, efficiency
ratios and solvency ratios over the last three years that are 2015, 2016, 2017. Finally, based
on the performance analysis some recommendations will be provided to improve the
performance.
Paraphrase This Document
Need a fresh take? Get an instant paraphrase of this document with our AI Paraphraser
4ACCOUNTING FINANCIAL ANALYSIS REPORT
2.0 Introduction
2.1 Market overview
Singapore is not only renowned as the trading hub but also becoming the shopping
paradise for luxury goods. At present it ranked as number 7 all over the world as their luxury
watch imports increased by 33.9% since the year 2010 the value of Singapore watch market
is 98.7 million CHF. It is the leading market for Southeast Asia that is closely followed by
Thailand with the value of 36.7 million CHF and Malaysia with the value of 6.9 million CHF.
Tourists from China and India are ready to spend thousands of dollars for the watches from
Singapore (Atwal & Bryson, 2014).The reason behind this is the authenticity of luxury
watches and less chances of getting the fake item. The other factors are availability of
receiving the tax refunds and payment of much lower amount as compared to their own
country’s tax burden.
2.2 Overview of The Hour Glass
The Hour Glass was formed during the year 1979 in Singapore and currently
supporting more than 50 brands for watches all over Asia Pacific region. It is one of the
luxury retail group for watches in Asia pioneer with appreciation and awareness of the
culture, it attempts to lead the cultural retail enterprise in world. The multi-brand boutiques of
the company are located strategically in main retail walkway in Hong-Kong, Japan, Thailand,
Australia, Malaysia and Singapore. The expert team of the company are experienced in sales
consulting and assist the customers through the experience of watch purchase (The Hour
Glass - Leading Luxury Watch Retail Group, 2018).
5ACCOUNTING FINANCIAL ANALYSIS REPORT
2.3 Overview of Cortina Holdings Limited
Cortina Holdings Limited was established in the year 1972 and the company is based
in Singapore. It is the investment holding company that is engaged in retail and distribution
of the timepieces and related accessories in Russia, Taiwan, Hong Kong, Indonesia, Thailand,
Malaysia and Singapore. It operates through retail and wholesale segments. The retail
segment is engaged in retailing of the branded pens, time pieces and the accessories. On the
other hand, the wholesale segment is engaged in wholesaling of luxury brand accessories and
time pieces (Cortina Holdings Limited, 2018).
3.0 Sustainability and Strategy
The term sustainability means the corporate and social responsibility and the
sustainable development. It includes three aspects like social, economic and environmental.
The social aspect includes the impact of the organization on the communities and its
employees. The environmental impact is the effect on the environment and the economic
impact is the financial stability and wider indirect as well as direct impact (The Hour Glass,
2018). The board of the company is engaged with overall management of business affairs of
the company and sets overall policies and strategies of the company for long-term
sustainability of the company. It reviews the divestment and investment proposals, financial
performances, funding decisions, key operational initiatives and implementation of proper
systems for managing the business risks of the company. Other functions involve the
approving and considerations of re-nominations and nominations for the board, reviewing the
performance management and endorsing the framework. Engaging with Sustainability offers
the opportunity for the HR professionals for making strategic contribution towards the
organization. Through embedding the sustainability in the strategy of the people will assist
the company to prepare the strategies for employee engagement, retention and motivation. It
⊘ This is a preview!⊘
Do you want full access?
Subscribe today to unlock all pages.
Trusted by 1+ million students worldwide
6ACCOUNTING FINANCIAL ANALYSIS REPORT
has been realised that the company is required to enhance the awareness of the leaders for
opportunities and sustainability issues (The Hour Glass, 2018). It is required for enabling
them to take the ownership for required changes in the company to become successful under
low carbon economy and achieve the expectation of the customers.
The issue found is that the under the operating activities in sustainable way most of
the people struggle for moving beyond basics, for instance, recycling. However, if the
management gather their knowledge regarding measurable and successful green initiatives
they will gain the potential regarding fulfilling the requirements of the employees (D’arpizio
et al., 2015). While various companies have made the public stands with regard to the
environmental and social commitments, the reviews related to environment consciousness
will benefit the companies to form their policies.
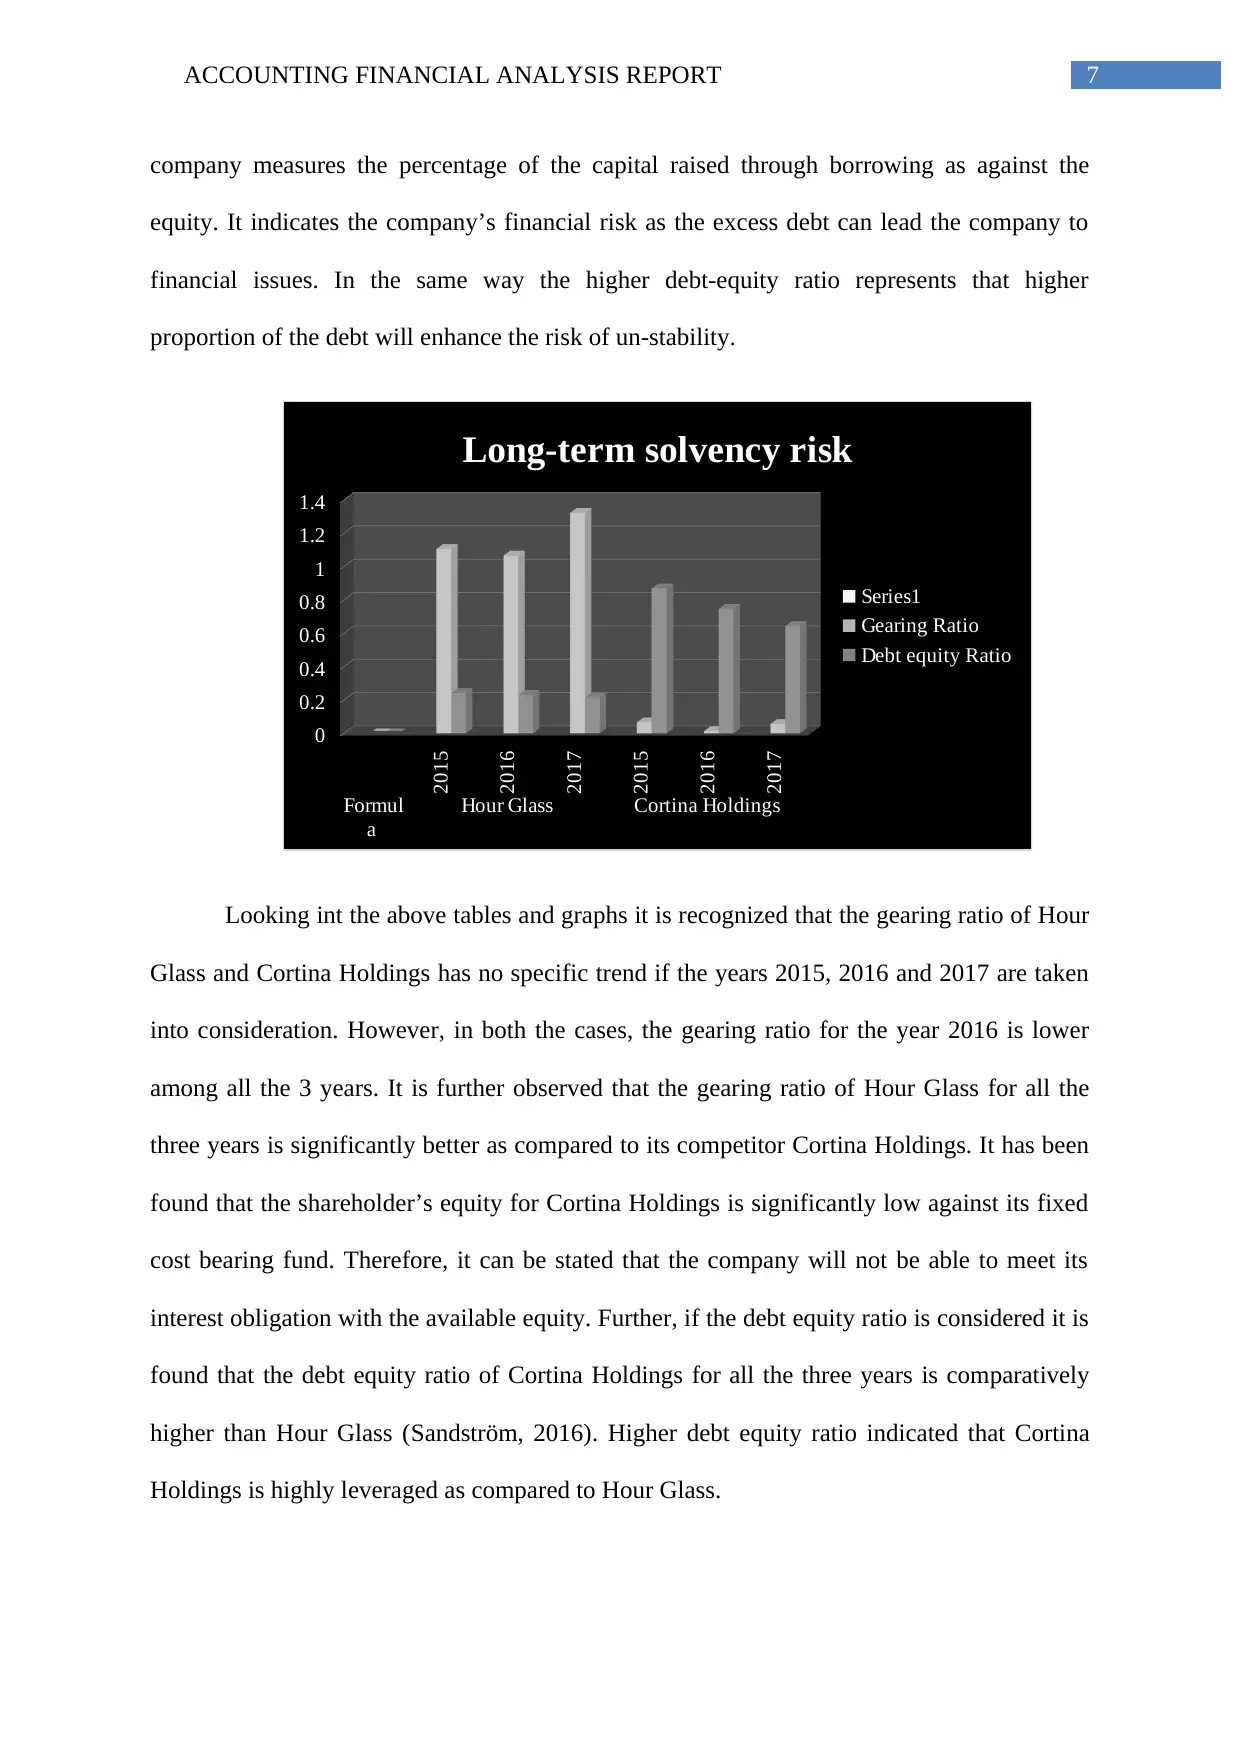
4.0 Comparing the financial structure
4.1 Long term solvency risk
Ratio Hour Glass Cortina Holdings
2015 2016 2017 2015 2016 2017
Long-term Solvency Risk
Gearing Ratio
1.11 1.07 1.32 0.07 0.01 0.06
Debt equity Ratio 0.24 0.23 0.21 0.87 0.75 0.64
The solvency ratios are the key metrics for measuring the company’s ability for
meeting its debt and various other obligations. Solvency ratio of the company indicates
whether the cash flow of the company is enough for meeting the long term as well as the
short term liabilities. When the solvency ratio of the company is lower the probability that the
company will default the debt obligation is higher (Brooks, 2015). The gearing ratio of the
has been realised that the company is required to enhance the awareness of the leaders for
opportunities and sustainability issues (The Hour Glass, 2018). It is required for enabling
them to take the ownership for required changes in the company to become successful under
low carbon economy and achieve the expectation of the customers.
The issue found is that the under the operating activities in sustainable way most of
the people struggle for moving beyond basics, for instance, recycling. However, if the
management gather their knowledge regarding measurable and successful green initiatives
they will gain the potential regarding fulfilling the requirements of the employees (D’arpizio
et al., 2015). While various companies have made the public stands with regard to the
environmental and social commitments, the reviews related to environment consciousness
will benefit the companies to form their policies.
4.0 Comparing the financial structure
4.1 Long term solvency risk
Ratio Hour Glass Cortina Holdings
2015 2016 2017 2015 2016 2017
Long-term Solvency Risk
Gearing Ratio
1.11 1.07 1.32 0.07 0.01 0.06
Debt equity Ratio 0.24 0.23 0.21 0.87 0.75 0.64
The solvency ratios are the key metrics for measuring the company’s ability for
meeting its debt and various other obligations. Solvency ratio of the company indicates
whether the cash flow of the company is enough for meeting the long term as well as the
short term liabilities. When the solvency ratio of the company is lower the probability that the
company will default the debt obligation is higher (Brooks, 2015). The gearing ratio of the
Paraphrase This Document
Need a fresh take? Get an instant paraphrase of this document with our AI Paraphraser
7ACCOUNTING FINANCIAL ANALYSIS REPORT
company measures the percentage of the capital raised through borrowing as against the
equity. It indicates the company’s financial risk as the excess debt can lead the company to
financial issues. In the same way the higher debt-equity ratio represents that higher
proportion of the debt will enhance the risk of un-stability.
2015
2016
2017
2015
2016
2017
Formul
a
Hour Glass Cortina Holdings
0
0.2
0.4
0.6
0.8
1
1.2
1.4
Long-term solvency risk
Series1
Gearing Ratio
Debt equity Ratio
Looking int the above tables and graphs it is recognized that the gearing ratio of Hour
Glass and Cortina Holdings has no specific trend if the years 2015, 2016 and 2017 are taken
into consideration. However, in both the cases, the gearing ratio for the year 2016 is lower
among all the 3 years. It is further observed that the gearing ratio of Hour Glass for all the
three years is significantly better as compared to its competitor Cortina Holdings. It has been
found that the shareholder’s equity for Cortina Holdings is significantly low against its fixed
cost bearing fund. Therefore, it can be stated that the company will not be able to meet its
interest obligation with the available equity. Further, if the debt equity ratio is considered it is
found that the debt equity ratio of Cortina Holdings for all the three years is comparatively
higher than Hour Glass (Sandström, 2016). Higher debt equity ratio indicated that Cortina
Holdings is highly leveraged as compared to Hour Glass.
8ACCOUNTING FINANCIAL ANALYSIS REPORT
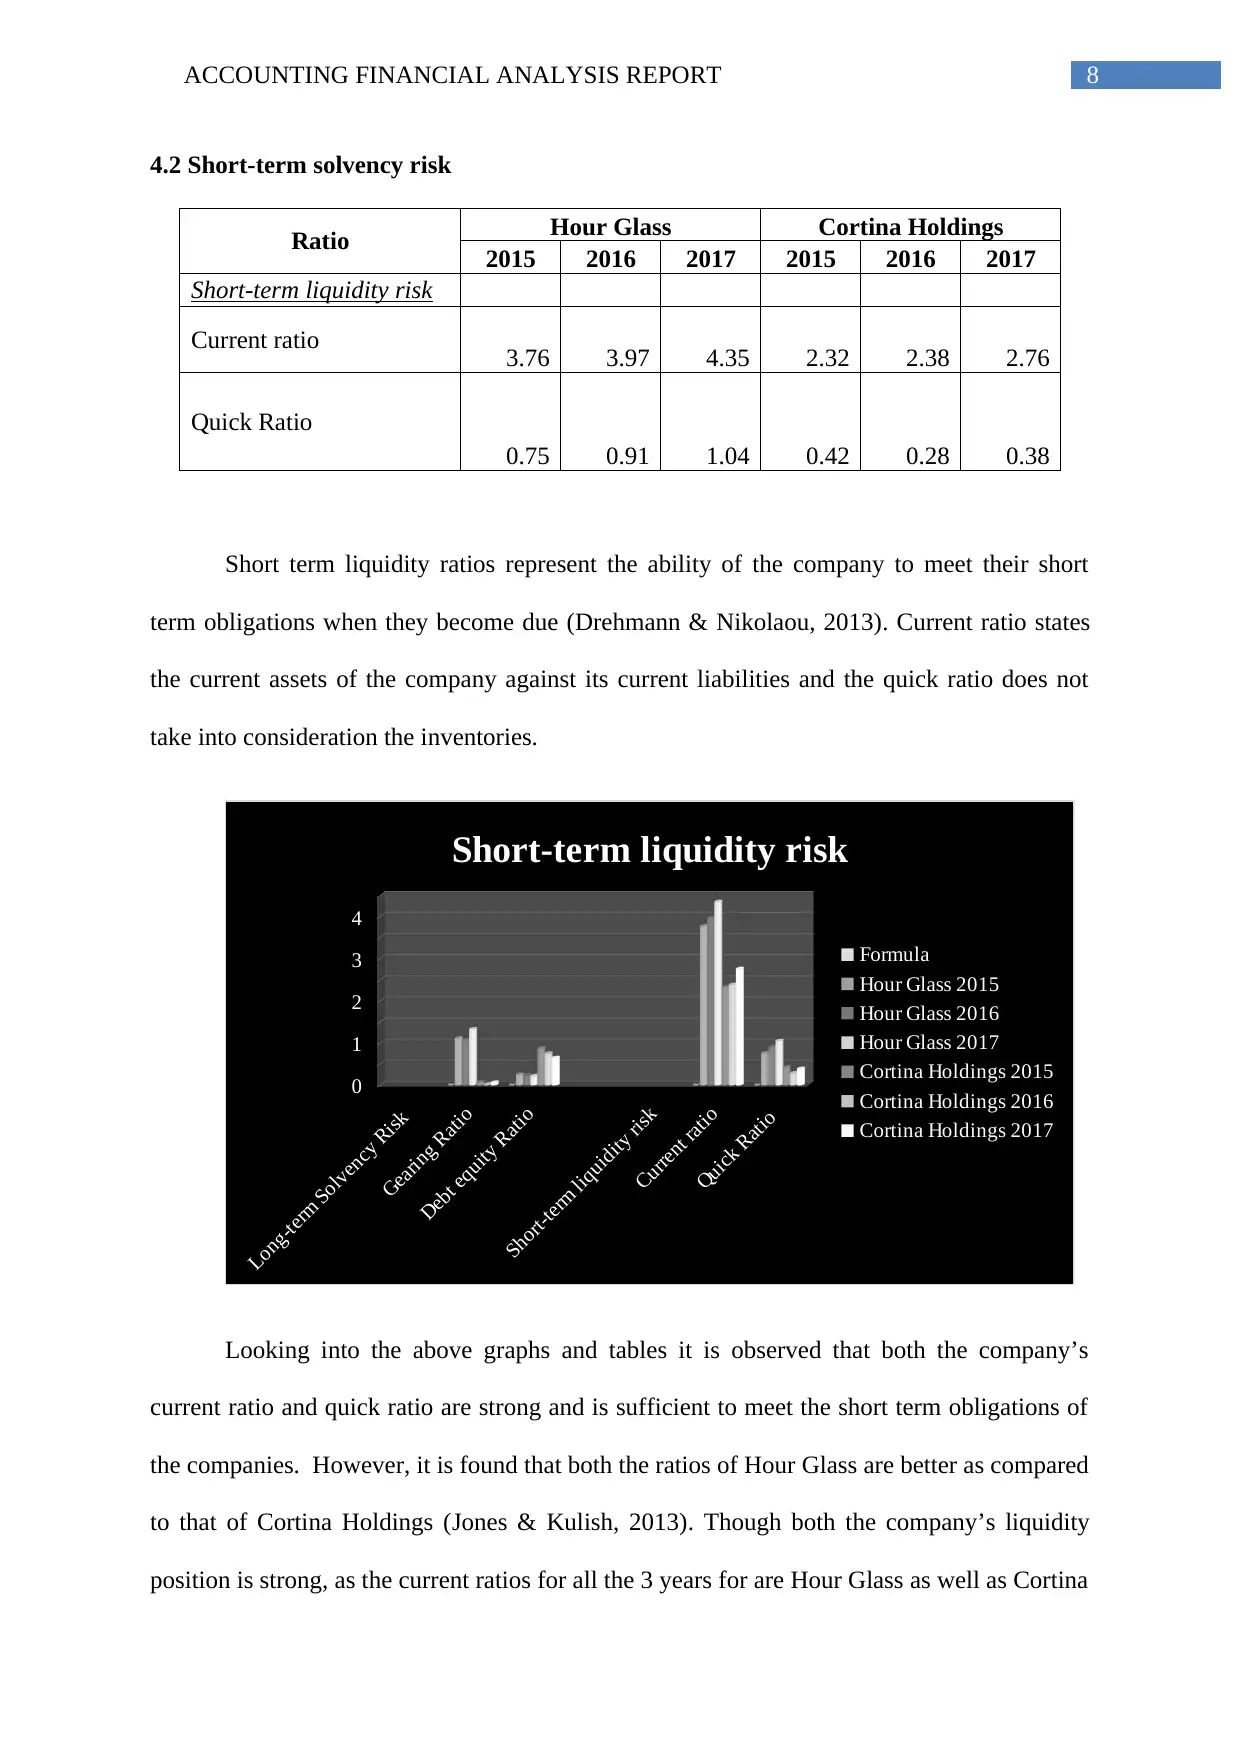
4.2 Short-term solvency risk
Ratio Hour Glass Cortina Holdings
2015 2016 2017 2015 2016 2017
Short-term liquidity risk
Current ratio 3.76 3.97 4.35 2.32 2.38 2.76
Quick Ratio
0.75 0.91 1.04 0.42 0.28 0.38
Short term liquidity ratios represent the ability of the company to meet their short
term obligations when they become due (Drehmann & Nikolaou, 2013). Current ratio states
the current assets of the company against its current liabilities and the quick ratio does not
take into consideration the inventories.
Long-term Solvency Risk
Gearing Ratio
Debt equity Ratio
Short-term liquidity risk
Current ratio
Quick Ratio
0
1
2
3
4
Short-term liquidity risk
Formula
Hour Glass 2015
Hour Glass 2016
Hour Glass 2017
Cortina Holdings 2015
Cortina Holdings 2016
Cortina Holdings 2017
Looking into the above graphs and tables it is observed that both the company’s
current ratio and quick ratio are strong and is sufficient to meet the short term obligations of
the companies. However, it is found that both the ratios of Hour Glass are better as compared
to that of Cortina Holdings (Jones & Kulish, 2013). Though both the company’s liquidity
position is strong, as the current ratios for all the 3 years for are Hour Glass as well as Cortina
⊘ This is a preview!⊘
Do you want full access?
Subscribe today to unlock all pages.
Trusted by 1+ million students worldwide
9ACCOUNTING FINANCIAL ANALYSIS REPORT
Holdings are quite high it is indicating that both are not using their working capital efficiently
and missing on the opportunities.
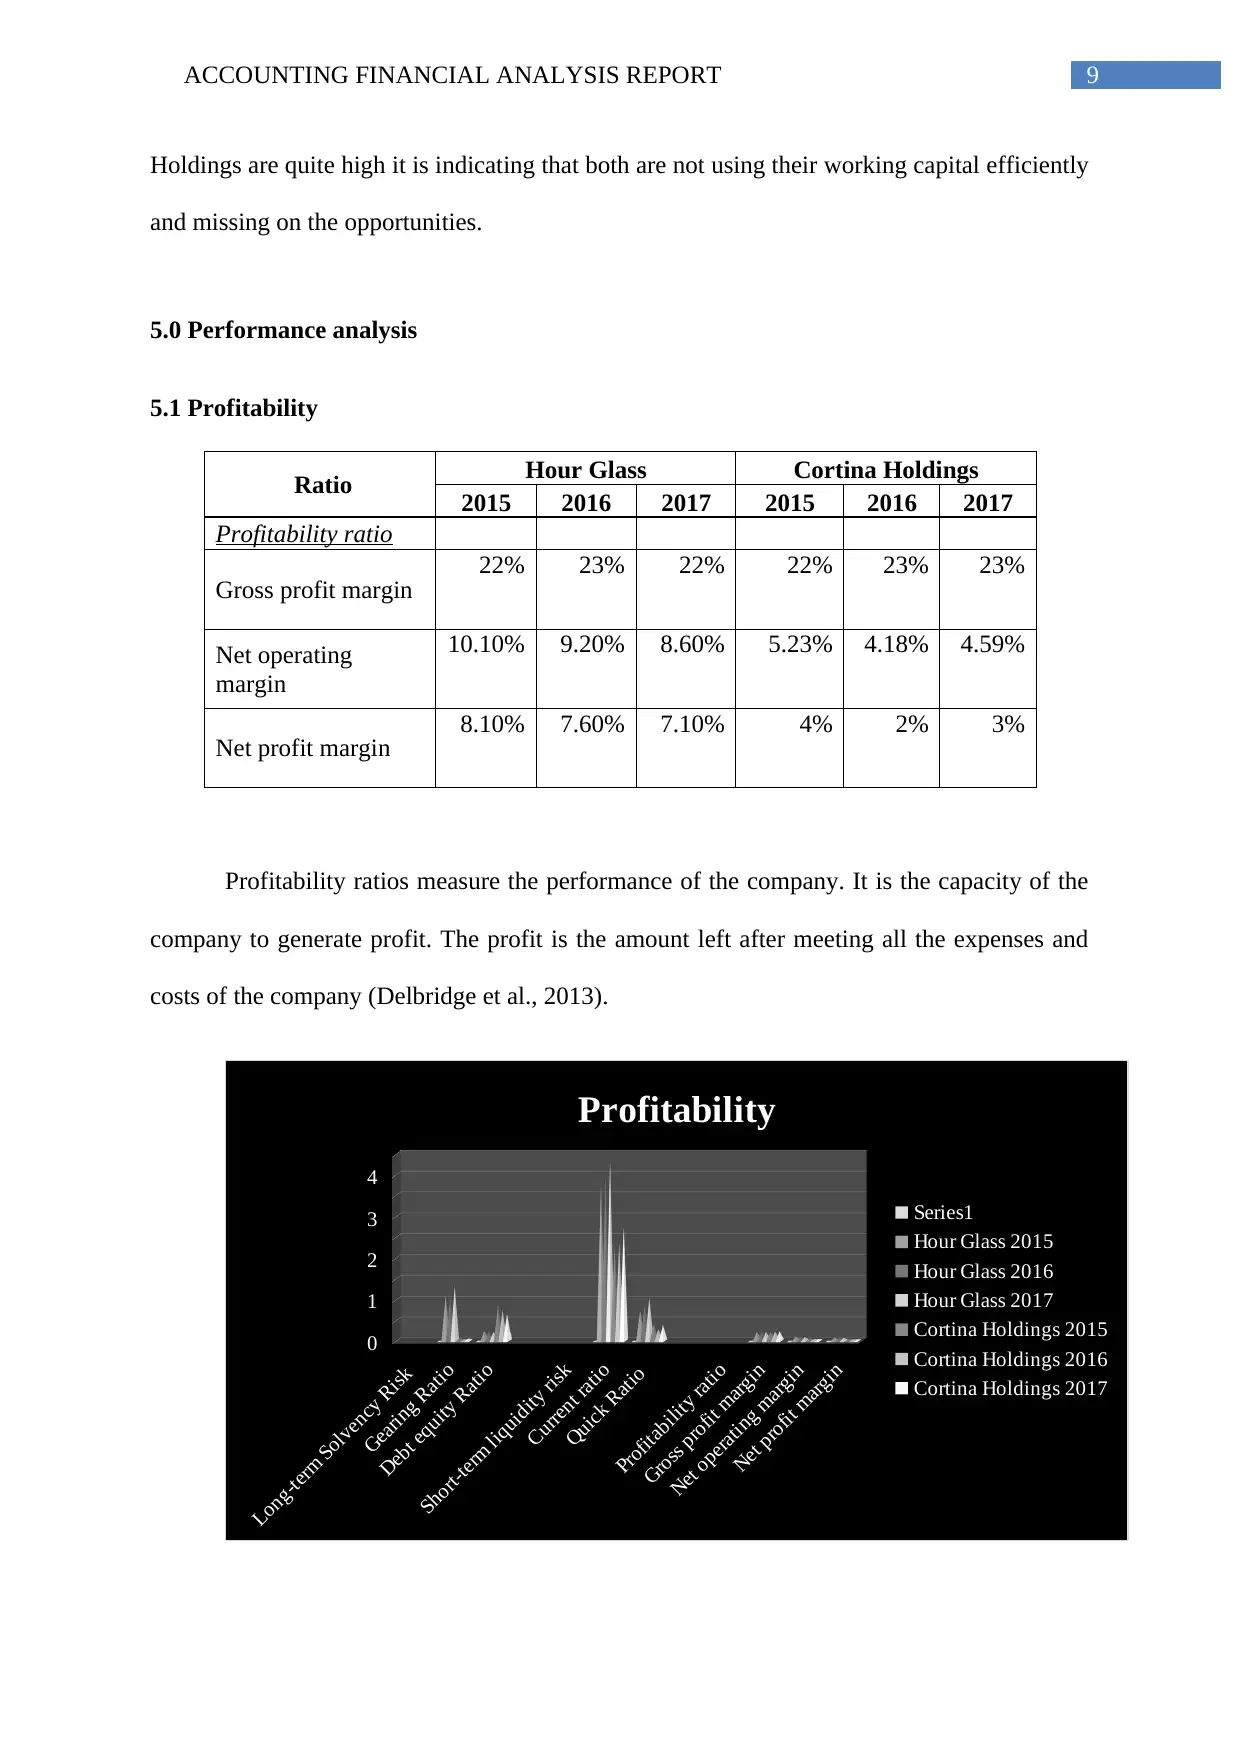
5.0 Performance analysis
5.1 Profitability
Ratio Hour Glass Cortina Holdings
2015 2016 2017 2015 2016 2017
Profitability ratio
Gross profit margin 22% 23% 22% 22% 23% 23%
Net operating
margin
10.10% 9.20% 8.60% 5.23% 4.18% 4.59%
Net profit margin 8.10% 7.60% 7.10% 4% 2% 3%
Profitability ratios measure the performance of the company. It is the capacity of the
company to generate profit. The profit is the amount left after meeting all the expenses and
costs of the company (Delbridge et al., 2013).
Long-term Solvency Risk
Gearing Ratio
Debt equity Ratio
Short-term liquidity risk
Current ratio
Quick Ratio
Profitability ratio
Gross profit margin
Net operating margin
Net profit margin
0
1
2
3
4
Profitability
Series1
Hour Glass 2015
Hour Glass 2016
Hour Glass 2017
Cortina Holdings 2015
Cortina Holdings 2016
Cortina Holdings 2017
Holdings are quite high it is indicating that both are not using their working capital efficiently
and missing on the opportunities.
5.0 Performance analysis
5.1 Profitability
Ratio Hour Glass Cortina Holdings
2015 2016 2017 2015 2016 2017
Profitability ratio
Gross profit margin 22% 23% 22% 22% 23% 23%
Net operating
margin
10.10% 9.20% 8.60% 5.23% 4.18% 4.59%
Net profit margin 8.10% 7.60% 7.10% 4% 2% 3%
Profitability ratios measure the performance of the company. It is the capacity of the
company to generate profit. The profit is the amount left after meeting all the expenses and
costs of the company (Delbridge et al., 2013).
Long-term Solvency Risk
Gearing Ratio
Debt equity Ratio
Short-term liquidity risk
Current ratio
Quick Ratio
Profitability ratio
Gross profit margin
Net operating margin
Net profit margin
0
1
2
3
4
Profitability
Series1
Hour Glass 2015
Hour Glass 2016
Hour Glass 2017
Cortina Holdings 2015
Cortina Holdings 2016
Cortina Holdings 2017
Paraphrase This Document
Need a fresh take? Get an instant paraphrase of this document with our AI Paraphraser
10ACCOUNTING FINANCIAL ANALYSIS REPORT
It is observed from the above that the gross profit margins of both the companies are
almost same and moving around 22%-23%. However, if the net operating margin is
considered it can be observed that is significantly better for Hour Glass as compared to that of
Cortina Holdings (Čermák, 2015). Therefore, it can be stated that the operating expenses of
Cortina Glass is quite high as compared to Hour Glass. Moreover, the net profit margin of
Hour Glass is moving between 7% and 9% whereas the same for Cortina Holdings is moving
between 2% and 4%. Therefore, the profitability position of Hour Glass is considerable better
as compared to its competitor Cortina Holdings (Maga, Canale & Bohe, 2013).
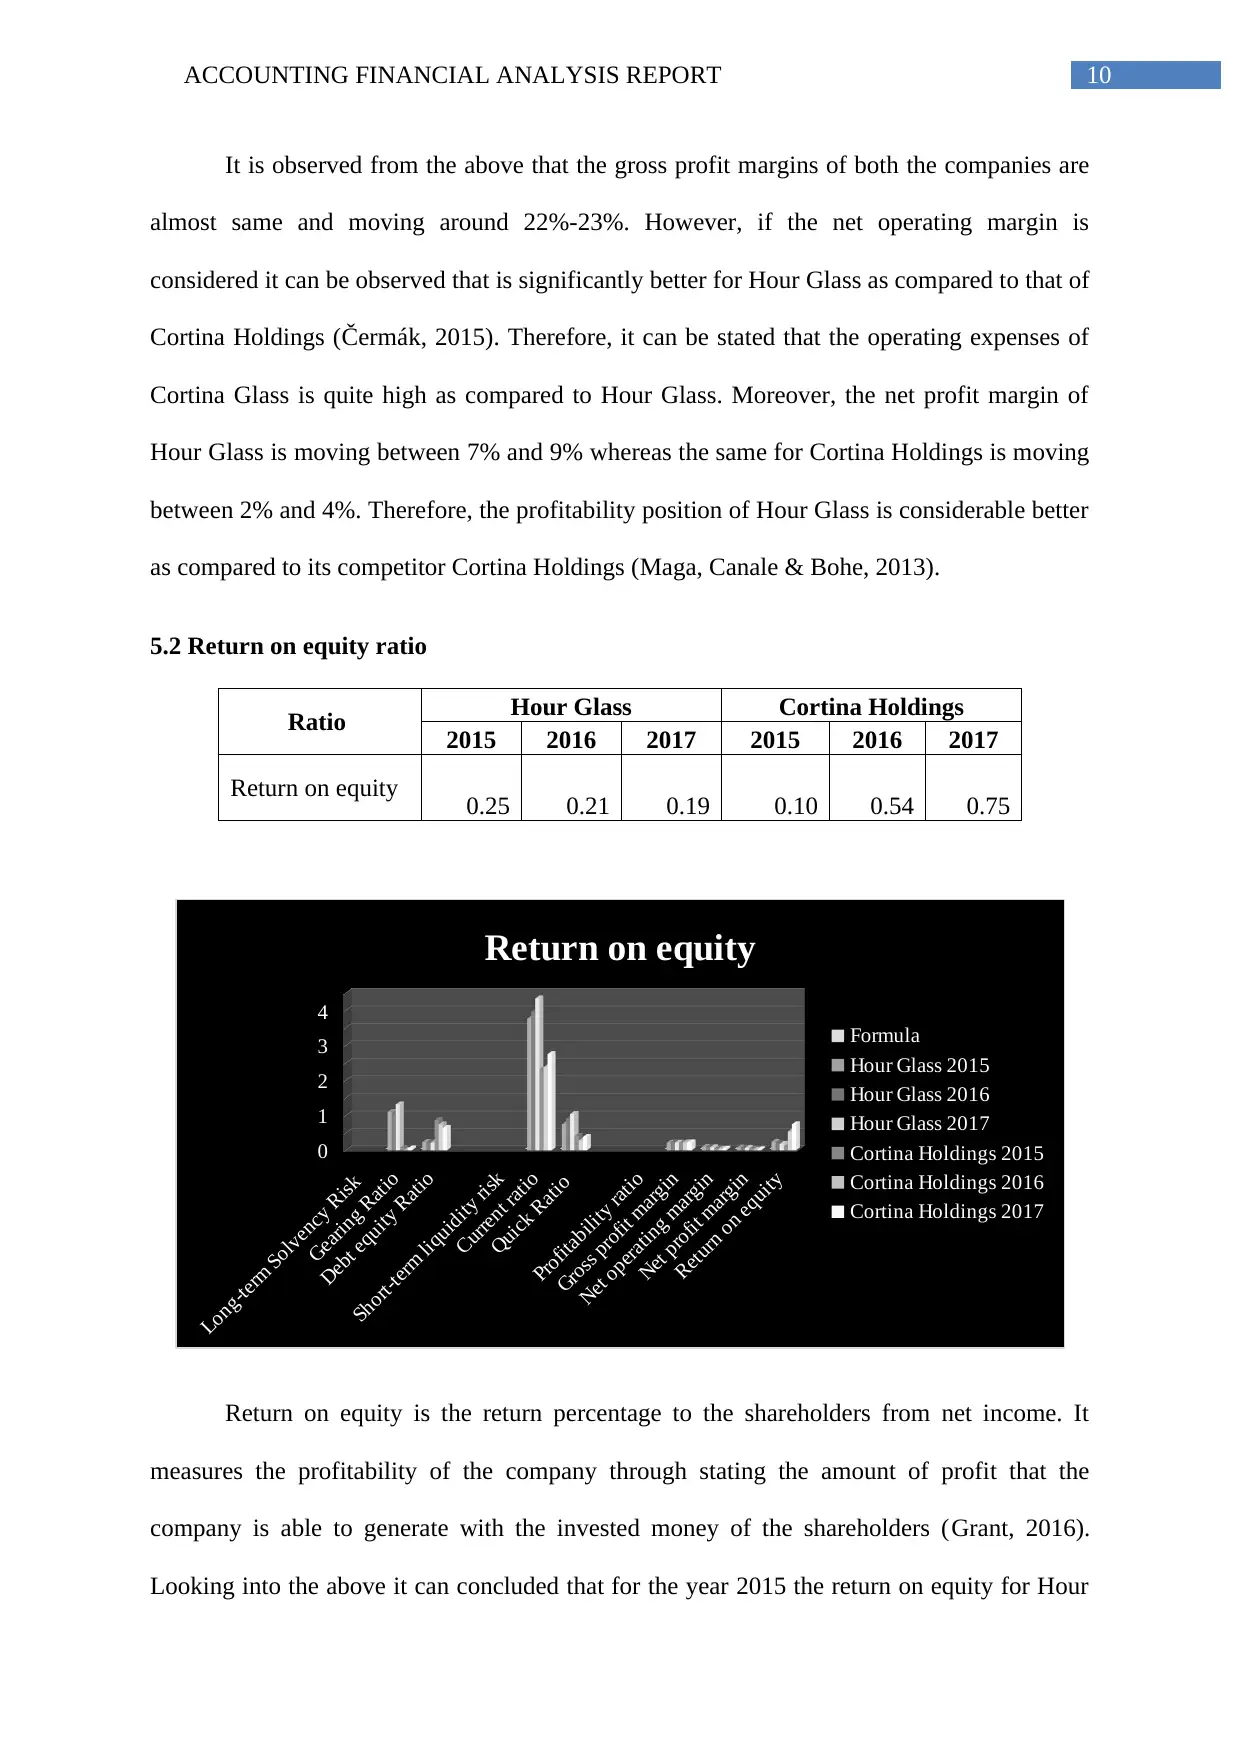
5.2 Return on equity ratio
Ratio Hour Glass Cortina Holdings
2015 2016 2017 2015 2016 2017
Return on equity 0.25 0.21 0.19 0.10 0.54 0.75
Long-term Solvency Risk
Gearing Ratio
Debt equity Ratio
Short-term liquidity risk
Current ratio
Quick Ratio
Profitability ratio
Gross profit margin
Net operating margin
Net profit margin
Return on equity
0
1
2
3
4
Return on equity
Formula
Hour Glass 2015
Hour Glass 2016
Hour Glass 2017
Cortina Holdings 2015
Cortina Holdings 2016
Cortina Holdings 2017
Return on equity is the return percentage to the shareholders from net income. It
measures the profitability of the company through stating the amount of profit that the
company is able to generate with the invested money of the shareholders (Grant, 2016).
Looking into the above it can concluded that for the year 2015 the return on equity for Hour
It is observed from the above that the gross profit margins of both the companies are
almost same and moving around 22%-23%. However, if the net operating margin is
considered it can be observed that is significantly better for Hour Glass as compared to that of
Cortina Holdings (Čermák, 2015). Therefore, it can be stated that the operating expenses of
Cortina Glass is quite high as compared to Hour Glass. Moreover, the net profit margin of
Hour Glass is moving between 7% and 9% whereas the same for Cortina Holdings is moving
between 2% and 4%. Therefore, the profitability position of Hour Glass is considerable better
as compared to its competitor Cortina Holdings (Maga, Canale & Bohe, 2013).
5.2 Return on equity ratio
Ratio Hour Glass Cortina Holdings
2015 2016 2017 2015 2016 2017
Return on equity 0.25 0.21 0.19 0.10 0.54 0.75
Long-term Solvency Risk
Gearing Ratio
Debt equity Ratio
Short-term liquidity risk
Current ratio
Quick Ratio
Profitability ratio
Gross profit margin
Net operating margin
Net profit margin
Return on equity
0
1
2
3
4
Return on equity
Formula
Hour Glass 2015
Hour Glass 2016
Hour Glass 2017
Cortina Holdings 2015
Cortina Holdings 2016
Cortina Holdings 2017
Return on equity is the return percentage to the shareholders from net income. It
measures the profitability of the company through stating the amount of profit that the
company is able to generate with the invested money of the shareholders (Grant, 2016).
Looking into the above it can concluded that for the year 2015 the return on equity for Hour
11ACCOUNTING FINANCIAL ANALYSIS REPORT
Glass is better than Cortina Holdings. However, for other 2 years this ratio for Cortina
Holdings is significantly better than Hour glass. Therefore, Cortina is more efficient in
generating income on shareholder’s investment (Hevert, 2013).
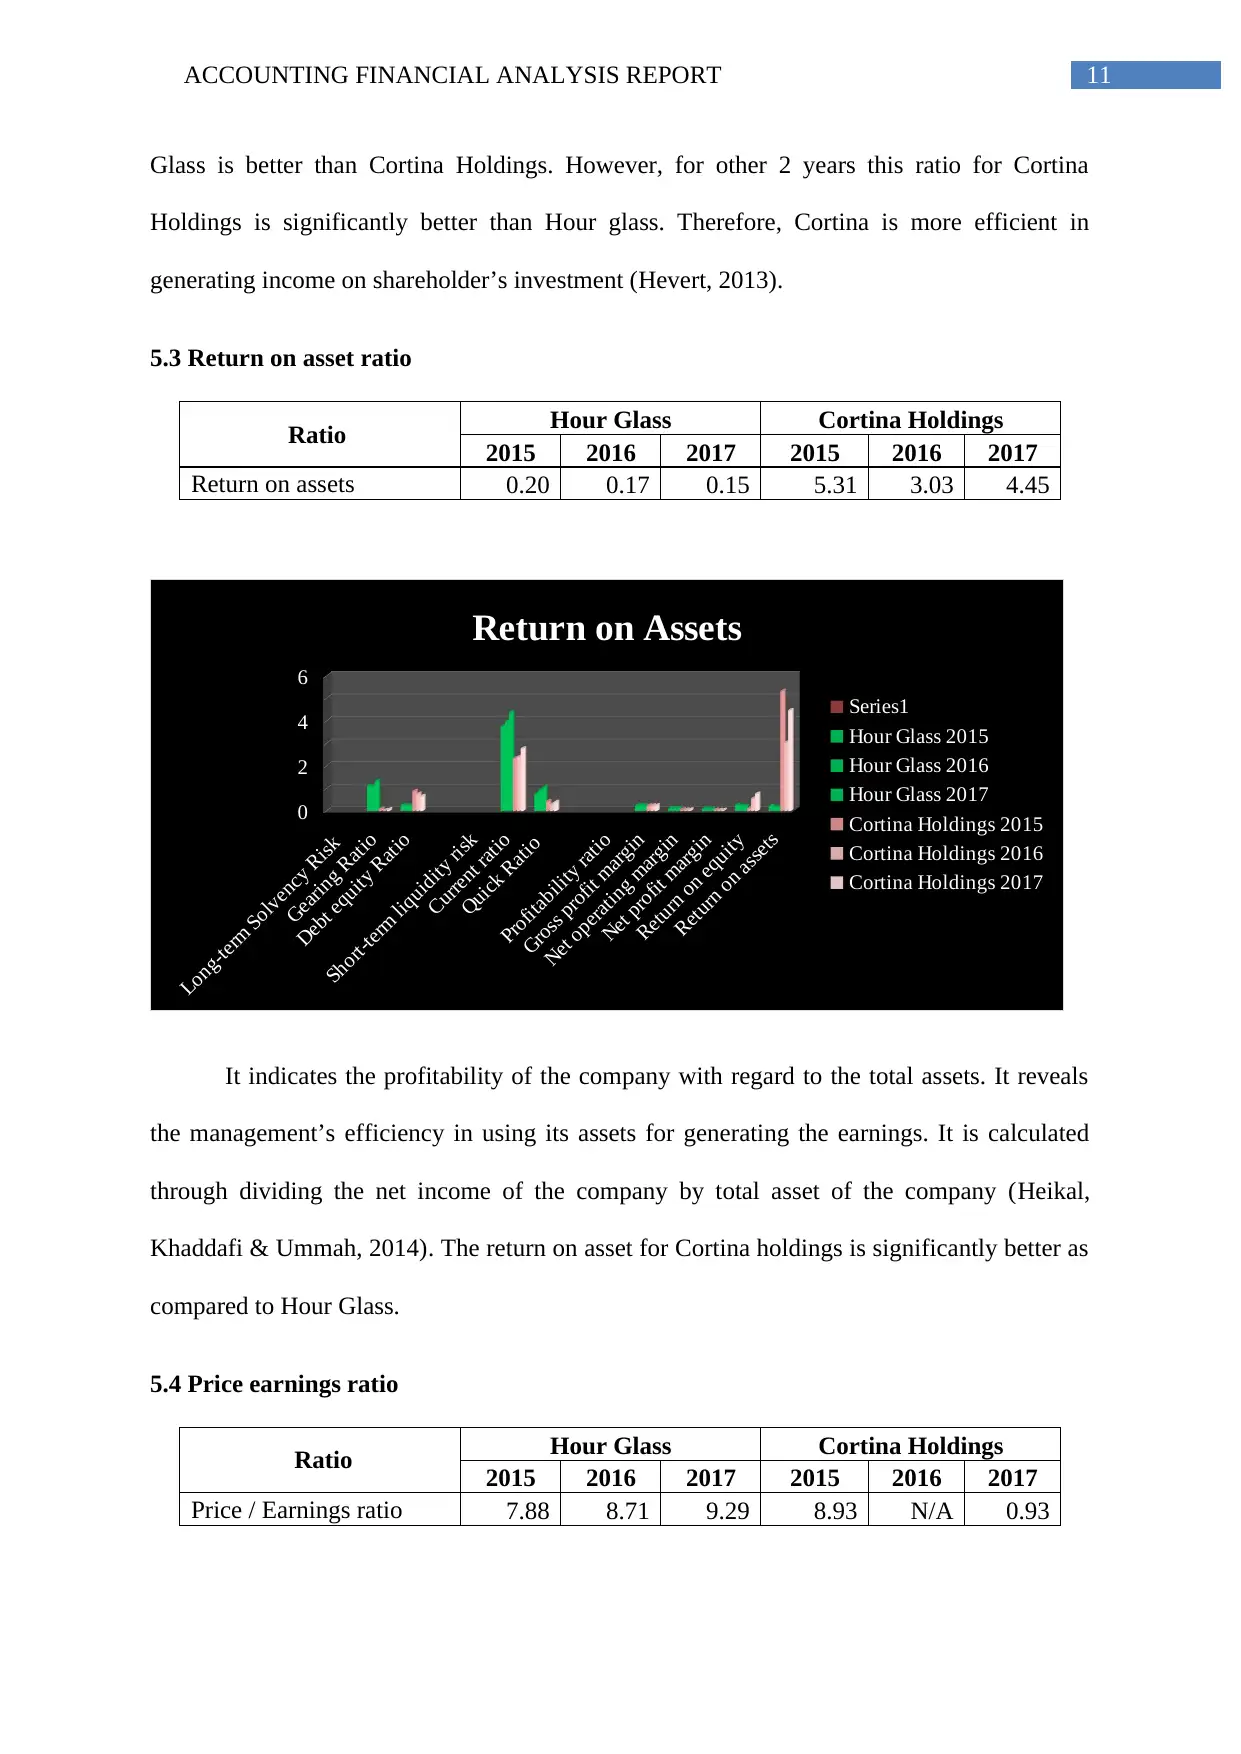
5.3 Return on asset ratio
Ratio Hour Glass Cortina Holdings
2015 2016 2017 2015 2016 2017
Return on assets 0.20 0.17 0.15 5.31 3.03 4.45
Long-term Solvency Risk
Gearing Ratio
Debt equity Ratio
Short-term liquidity risk
Current ratio
Quick Ratio
Profitability ratio
Gross profit margin
Net operating margin
Net profit margin
Return on equity
Return on assets
0
2
4
6
Return on Assets
Series1
Hour Glass 2015
Hour Glass 2016
Hour Glass 2017
Cortina Holdings 2015
Cortina Holdings 2016
Cortina Holdings 2017
It indicates the profitability of the company with regard to the total assets. It reveals
the management’s efficiency in using its assets for generating the earnings. It is calculated
through dividing the net income of the company by total asset of the company (Heikal,
Khaddafi & Ummah, 2014). The return on asset for Cortina holdings is significantly better as
compared to Hour Glass.
5.4 Price earnings ratio
Ratio Hour Glass Cortina Holdings
2015 2016 2017 2015 2016 2017
Price / Earnings ratio 7.88 8.71 9.29 8.93 N/A 0.93
Glass is better than Cortina Holdings. However, for other 2 years this ratio for Cortina
Holdings is significantly better than Hour glass. Therefore, Cortina is more efficient in
generating income on shareholder’s investment (Hevert, 2013).
5.3 Return on asset ratio
Ratio Hour Glass Cortina Holdings
2015 2016 2017 2015 2016 2017
Return on assets 0.20 0.17 0.15 5.31 3.03 4.45
Long-term Solvency Risk
Gearing Ratio
Debt equity Ratio
Short-term liquidity risk
Current ratio
Quick Ratio
Profitability ratio
Gross profit margin
Net operating margin
Net profit margin
Return on equity
Return on assets
0
2
4
6
Return on Assets
Series1
Hour Glass 2015
Hour Glass 2016
Hour Glass 2017
Cortina Holdings 2015
Cortina Holdings 2016
Cortina Holdings 2017
It indicates the profitability of the company with regard to the total assets. It reveals
the management’s efficiency in using its assets for generating the earnings. It is calculated
through dividing the net income of the company by total asset of the company (Heikal,
Khaddafi & Ummah, 2014). The return on asset for Cortina holdings is significantly better as
compared to Hour Glass.
5.4 Price earnings ratio
Ratio Hour Glass Cortina Holdings
2015 2016 2017 2015 2016 2017
Price / Earnings ratio 7.88 8.71 9.29 8.93 N/A 0.93
⊘ This is a preview!⊘
Do you want full access?
Subscribe today to unlock all pages.
Trusted by 1+ million students worldwide
1 out of 19
Related Documents


Your All-in-One AI-Powered Toolkit for Academic Success.
+13062052269
info@desklib.com
Available 24*7 on WhatsApp / Email
![[object Object]](/_next/static/media/star-bottom.7253800d.svg)
Unlock your academic potential
Copyright © 2020–2026 A2Z Services. All Rights Reserved. Developed and managed by ZUCOL.