STAT6003 Statistics: House Price Index Analysis & Comparison

Verified

Added on  2023/06/10

|16
|1496
|442
Report
AI Summary
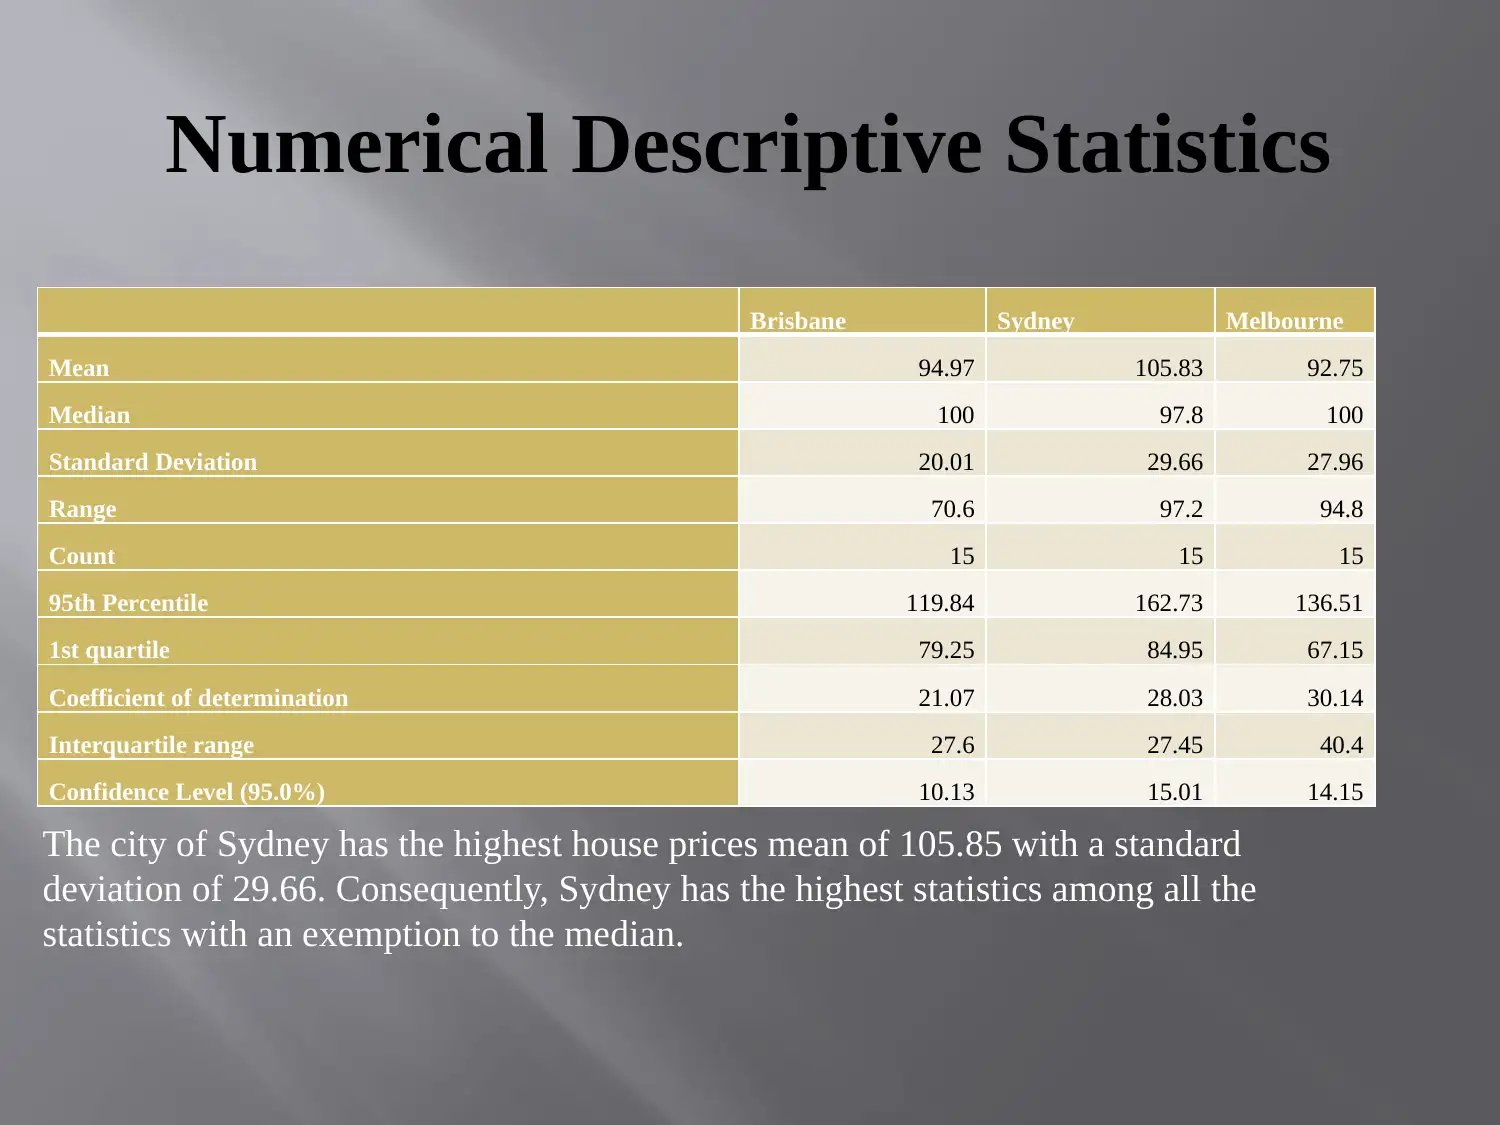
This report provides a statistical analysis of the House Price Index (HPI) for three major Australian cities: Brisbane, Sydney, and Melbourne. The analysis employs both descriptive and inferential statistics to understand the movement of house prices. Descriptive statistics, including graphs and numerical calculations, are used to describe the population, while inferential statistics are used to make inferences about the population. The report includes a comparison of house price indices across the three cities, highlighting key statistics such as mean, median, standard deviation, range, and percentiles. Confidence intervals are calculated to estimate the population mean for each city's HPI. Hypothesis tests are conducted to determine if the average house price for each city is significantly different from 100, and further tests compare the means of HPI between the cities. The conclusion summarizes the findings, indicating the relationships between the house price indices of the three cities and aligning with previous research on Australian housing prices. Desklib provides access to this and other solved assignments, offering students valuable study resources.
Document Page
PROPERTY ASSESSMENT
Student’s name:
Student’s ID:
Institution:
tabler-icon-diamond-filled.svg

Paraphrase This Document

Need a fresh take? Get an instant paraphrase of this document with our AI Paraphraser
Document Page
Introduction
The following study aims at analyzing the House Price
Index of three cities (Brisbane, Sydney, and Melbourne).
The house price index is an annual measure measuring
the movement of house prices. (Bourassa, Hoesli, & Sun,
2006).
Both descriptive and inferential statistics were used to
analyze the data.
Descriptive statistics were used to provide a description
with regards to the population through graphs and
numerical calculations (Trochim, 2006).
Inferential statistics was aimed at describing and making
inferences with regards to the population (Lowry, 2014).
Document Page
Descriptive Statistics
50-60 60-70 70-80 80-90 90-100 100-110 110-120 120-130 130-140
0
0.5
1
1.5
2
2.5
3
3.5
4
4.5
House Price Index in Bisbane
Most of the house price in Brisbane is 110 to 120 closely followed by 100 to 110.
Document Page
(Cont…)
90-110 110-130 130-150 150-170 170-190 190-210
0
1
2
3
4
5
6
7
8
House Price Index in Sydney
Most of the house prices is between 90 and 110.
tabler-icon-diamond-filled.svg

Paraphrase This Document

Need a fresh take? Get an instant paraphrase of this document with our AI Paraphraser
Document Page
(Cont…)
70-90 90-110 110-130 130-150 150-17
0
0.5
1
1.5
2
2.5
3
3.5
4
4.5
House Price Index in Melbourne
In Melbourne, most of the house prices are between the prices of 70 to 90 and 110 to
130.
Document Page
Numerical Descriptive Statistics
Brisbane Sydney Melbourne
Mean 94.97 105.83 92.75
Median 100 97.8 100
Standard Deviation 20.01 29.66 27.96
Range 70.6 97.2 94.8
Count 15 15 15
95th Percentile 119.84 162.73 136.51
1st quartile 79.25 84.95 67.15
Coefficient of determination 21.07 28.03 30.14
Interquartile range 27.6 27.45 40.4
Confidence Level (95.0%) 10.13 15.01 14.15
The city of Sydney has the highest house prices mean of 105.85 with a standard
deviation of 29.66. Consequently, Sydney has the highest statistics among all the
statistics with an exemption to the median.
Document Page
Estimation
The 95 percent confidence of the (Capital city Brisbane
Index) population mean is 94.97 +/- 10.13. Thus, it can be
concluded that the average house price Index of the
Capital city of Brisbane is equals to 94.97 +/- 10.13 units
or 84.84 to 105.1.
On the other hand, the 95 percent confidence of the
Capital city Sydney index (V4) and the Capital city
Melbourne Index are 105.83 +/- 15.01 and 92.75 +/- 14.15
respectively.
Therefore, the average Index of the Capital city of Sydney
is equals 105.83 +/- 15.01 units or 90.82 to 120.84. More
so, the average Index of the Capital city of Melbourne is
equals to 92.75 +/- 14.15 or 78.61 to 106.9.
tabler-icon-diamond-filled.svg

Paraphrase This Document

Need a fresh take? Get an instant paraphrase of this document with our AI Paraphraser
Document Page
(Cont…)
Ideally, it is seen that Brisbane has the shortest
confidence interval compared to Sydney and
Melbourne.
Thus, with accordance to Fritz & MacKinnon
(2007) study, the Brisbane house price index is
likely to fluctuate less than Sydney and Melbourne.
Melbourne index is likely to fluctuate more since it
has the longest confidence interval.
Document Page
Hypothesis Tests
Hypothesis 1
H0: The population’s average house Price for Brisbane is equal to 100
H1: The population’s average house Price for Brisbane is different to 100
Hypothesis 2
H0: The population’s average house Price for Sydney is equal to 100
H1: The population’s average house Price for Sydney is different to 100
Hypothesis 3
H0: The population’s average house Price for Melbourne is equal to 100
H1: The population’s average house Price for Melbourne is different to
100
Document Page
Inferential method
A one-sample t-test was appropriate to test the
hypothesis since it compares the mean of a single
sample to a predetermined mean (De Winter, 2013).
tabler-icon-diamond-filled.svg

Paraphrase This Document

Need a fresh take? Get an instant paraphrase of this document with our AI Paraphraser
Document Page
Results
Hypothesis 1
The t-value is -0.947 with a p-value of 0.17 and 0.34 at one-tail and two-tail
respectively. Since the result is not significant at p<0.05, we choose to not
accept the null hypothesis (Labovitz, 2006). Therefore, the population’s
average house Price index for Brisbane is different from 100.
Hypothesis 2
The t-value is 0.76 with a p-value of 0.23 and 0.46 at one-tail and two-tail
respectively. Since the result is not significant at p<0.05, we choose to not
accept the null hypothesis. Therefore, the population’s average house Price
index for Sydney is different from 100.
Hypothesis 3
The t-value is -1 with a p-value of 0.17 and 0.33 at one-tail and two-tail
respectively. Since the result is not significant at p<0.05, we choose to not
accept the null hypothesis. Therefore, the population’s average house Price
index for Melbourne is different from 100.
Document Page
Estimation 2
Hypothesis 1
H0: The population means house Price Index for Brisbane and Sydney are equal.
H1: The population means house Price Index for Brisbane and Sydney are not
equal.
Hypothesis 2
H0: The population means house Price Index for Brisbane and Melbourne are
equal.
H1: The population means house Price Index for Brisbane and Melbourne are
not equal.
Hypothesis 3
H0: The population means house Price Index for Sydney and Melbourne are
equal.
H1: The population means house Price Index for Sydney and Melbourne are not
equal.
chevron_up_icon
1 out of 16
circle_padding
hide_on_mobile
zoom_out_icon
[object Object]