BUS5SBF: Statistical Analysis and Interpretation of Household Data
VerifiedAdded on 2023/06/12
|11
|1488
|471
Homework Assignment
AI Summary
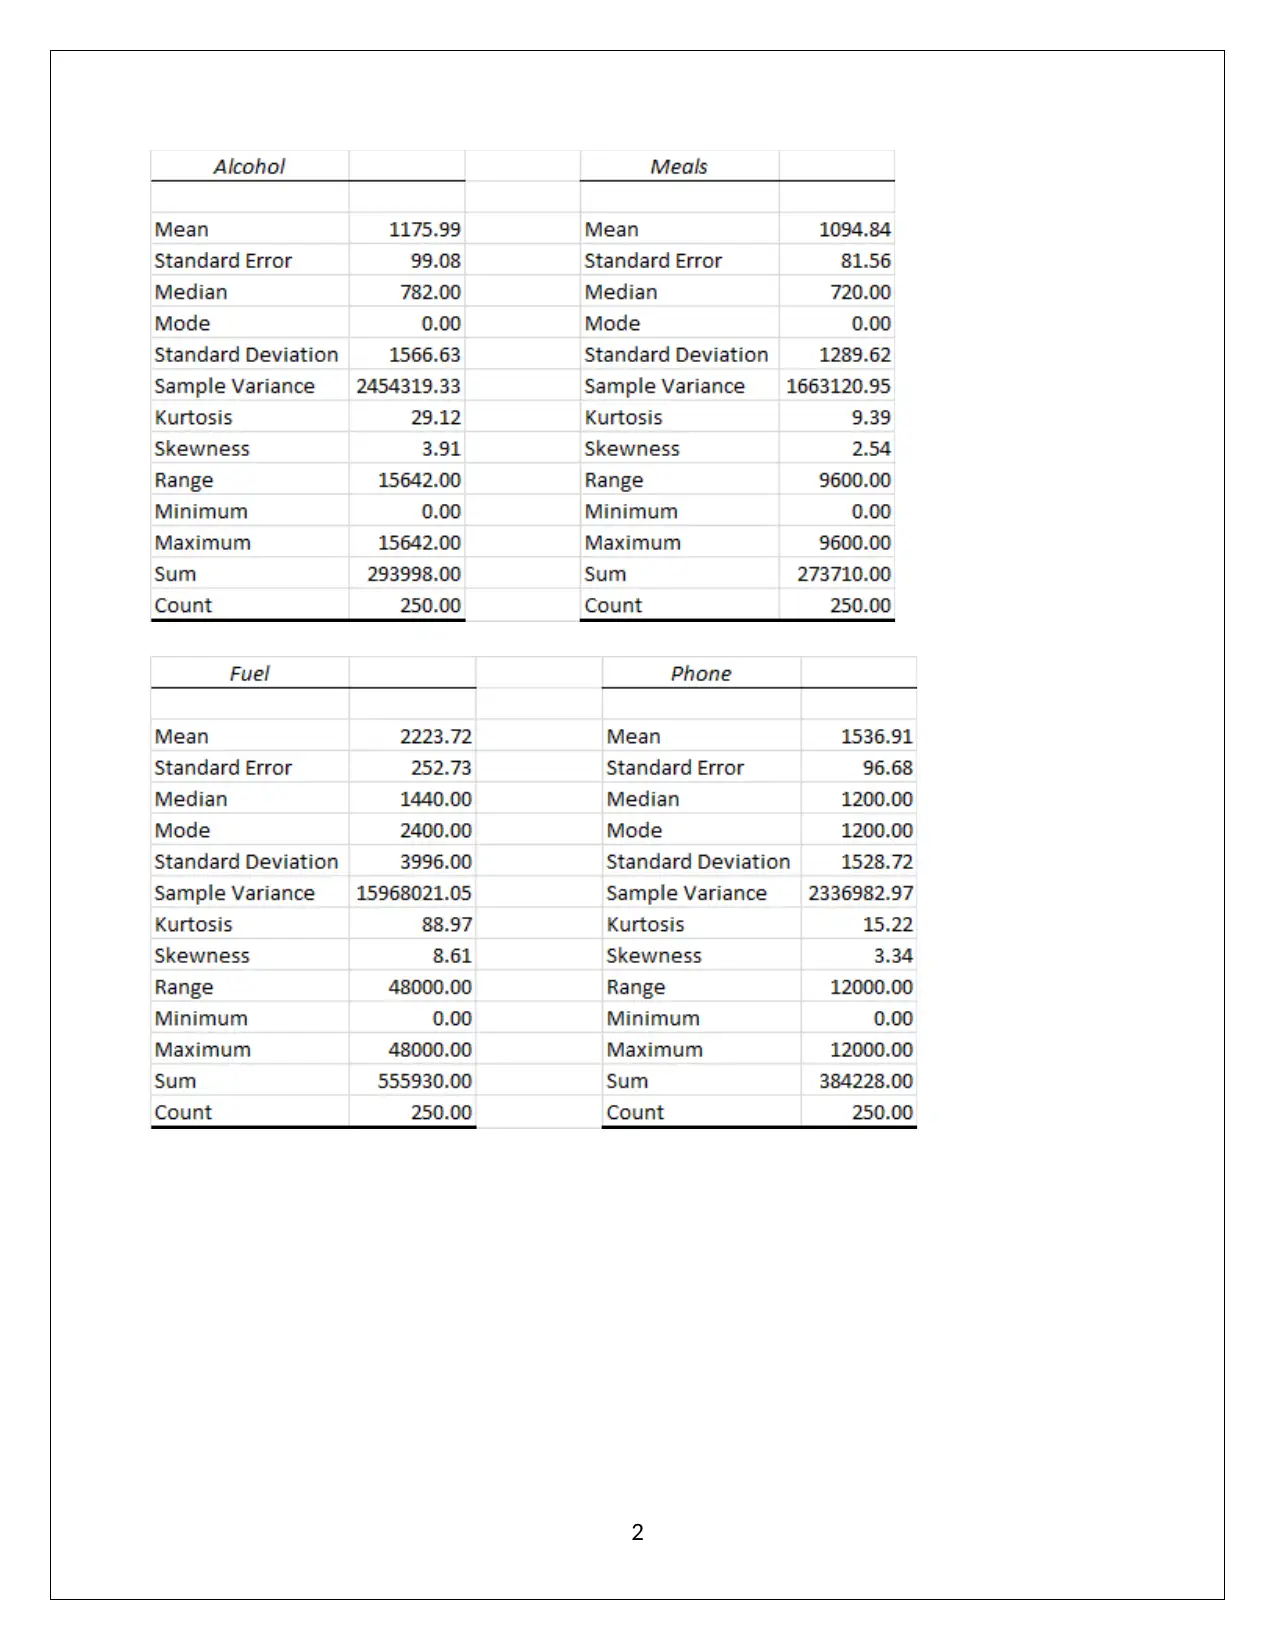
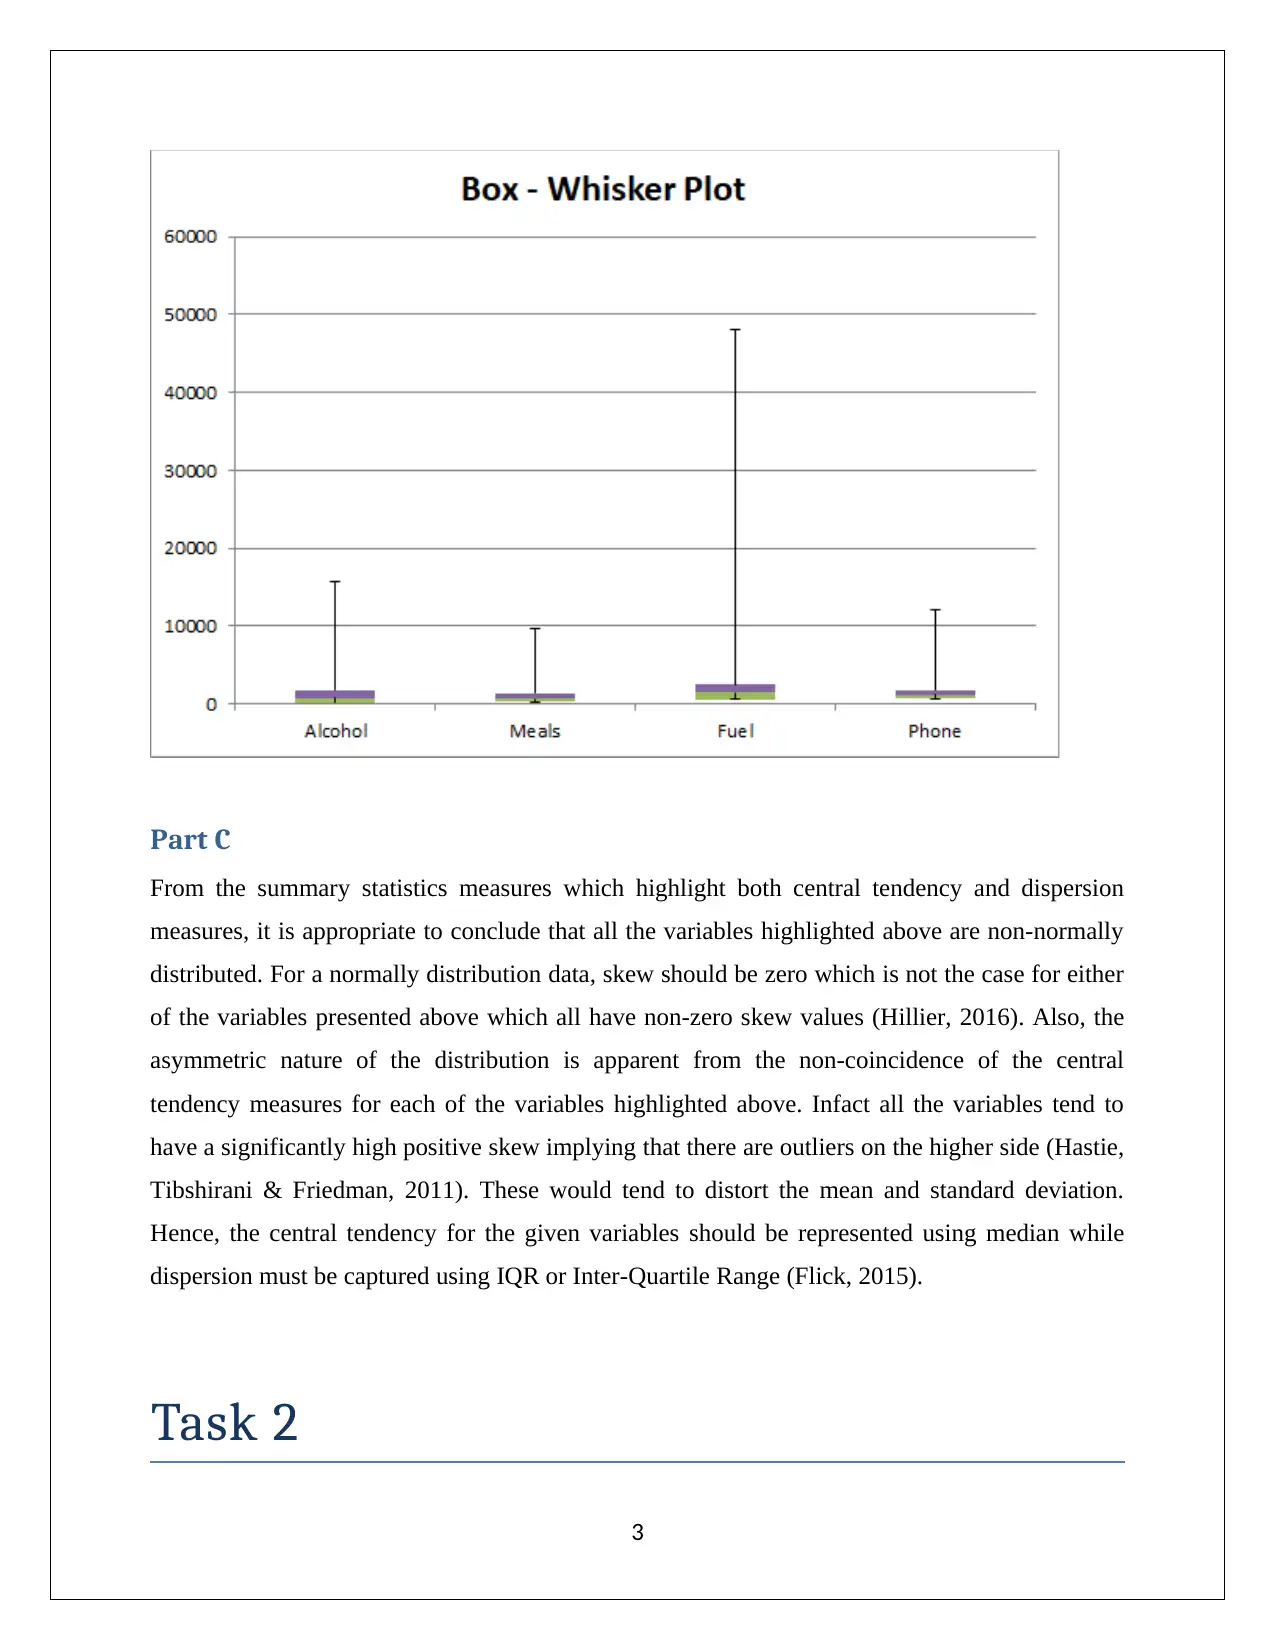
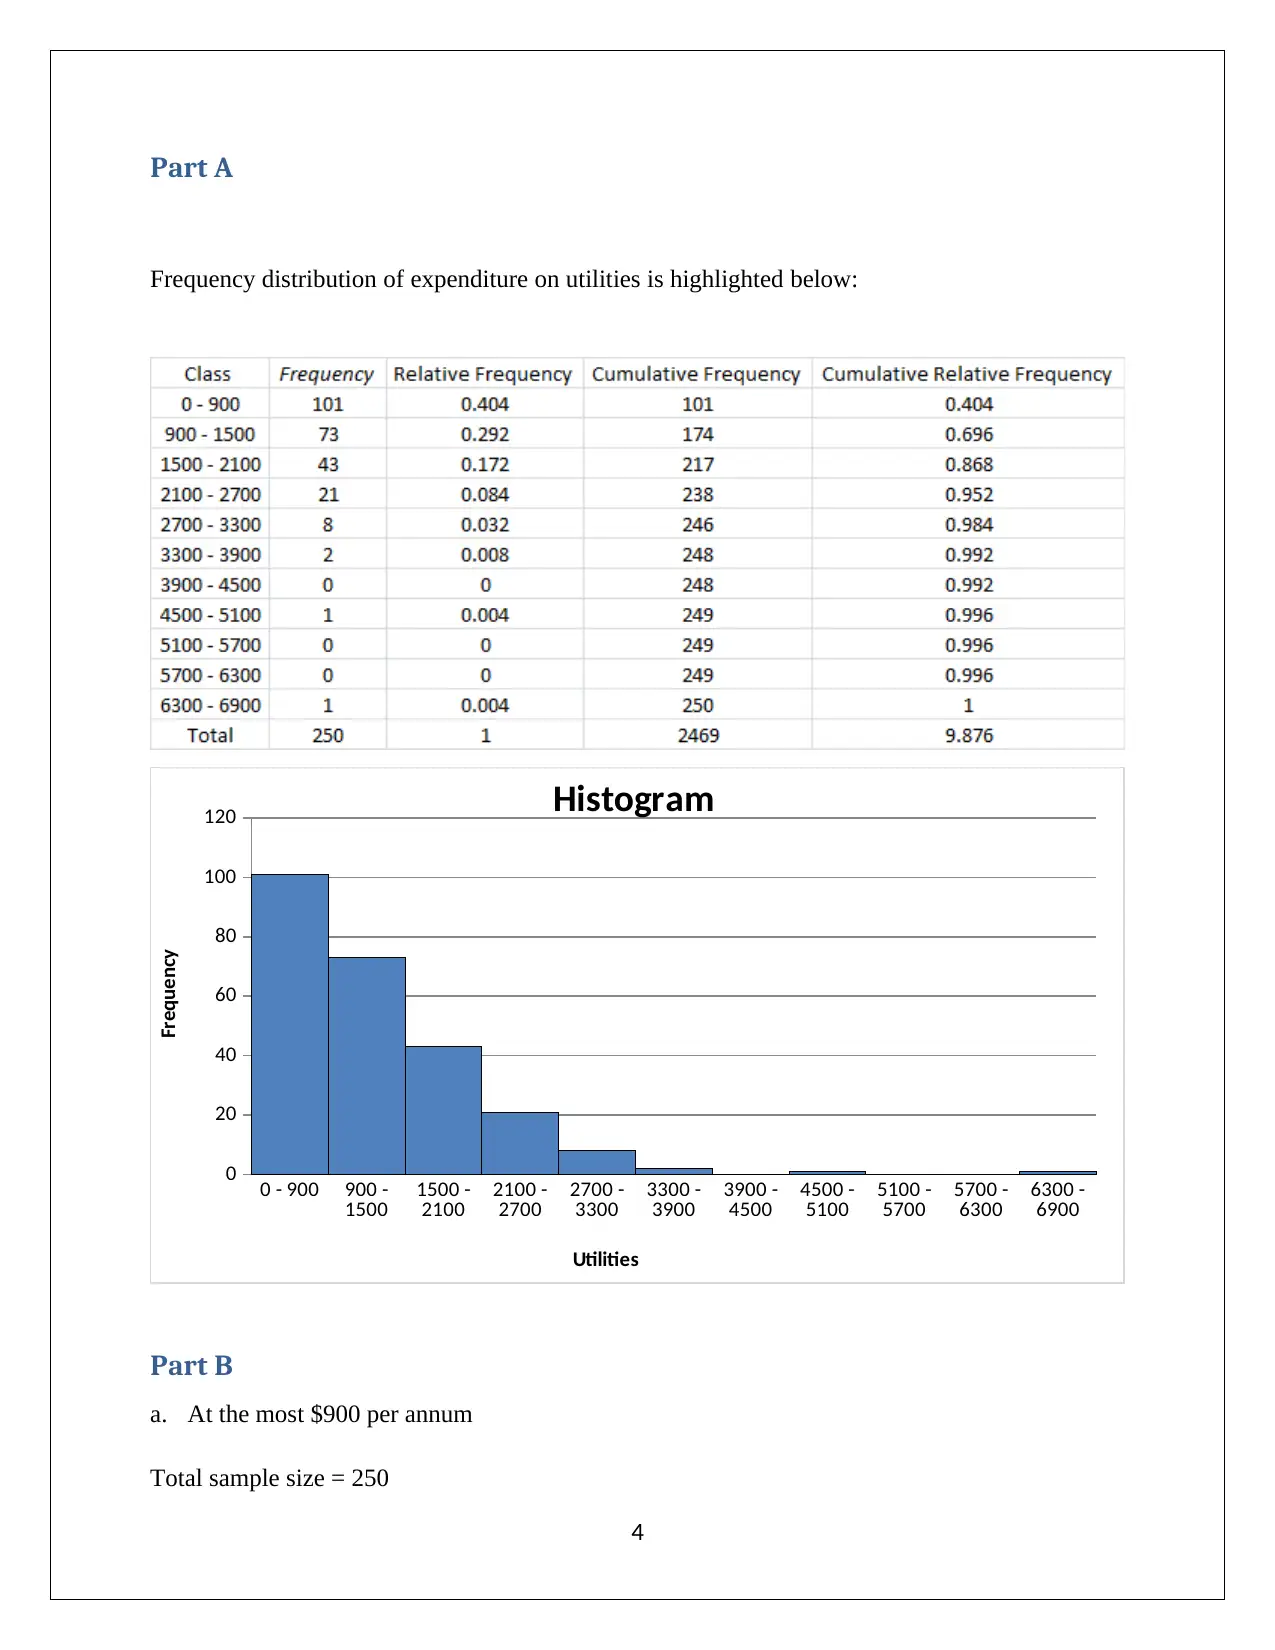
This assignment provides a comprehensive statistical analysis of household data, addressing tasks related to sampling techniques, descriptive statistics, frequency distributions, and probability. It begins by discussing the advantages and disadvantages of simple random sampling and recommending stratified random sampling for improved representation. The assignment then delves into descriptive statistics, including measures of central tendency and dispersion, concluding that the data is non-normally distributed and suggesting the use of median and IQR. Furthermore, it analyzes expenditure on utilities, calculating percentages for various spending ranges. The assignment also determines the top and bottom 5% values of household income and explores the relationship between income and expenditure using correlation coefficients and scatter plots. Finally, it examines the correlation between gender and education level, calculating probabilities and determining the independence of events. The solution uses the data to interpret real-world demographic trends using statistical methods. Desklib offers this solution and many other resources for students.
1 out of 11
Related Documents


Your All-in-One AI-Powered Toolkit for Academic Success.
+13062052269
info@desklib.com
Available 24*7 on WhatsApp / Email
![[object Object]](/_next/static/media/star-bottom.7253800d.svg)
Copyright © 2020–2026 A2Z Services. All Rights Reserved. Developed and managed by ZUCOL.