Comprehensive Housing Data Analysis Report Using RapidMiner/Tableau
VerifiedAdded on 2024/06/28
|18
|2511
|200
Report
AI Summary
This report provides a comprehensive analysis of housing data using RapidMiner and Tableau. It begins with an exploration of organizational assumptions and the role of data-driven decision-making. The analysis then delves into Exploratory Data Analysis (EDA) of the Housing.csv file using RapidMiner, including statistical graphs, histograms, and scatter plots to understand data distribution and relationships between variables like population and median house values. Linear regression is performed to model the relationship between housing attributes, evaluating model accuracy and performance. Finally, the report uses Tableau to create graph views and geographic maps, visualizing population distribution and housing characteristics across different locations, particularly focusing on the impact of ocean proximity on housing data. This document is available on Desklib, a platform that provides students with access to a wealth of study resources, including past papers and solved assignments.

Paraphrase This Document
Need a fresh take? Get an instant paraphrase of this document with our AI Paraphraser
Table of Contents
Task 1.............................................................................................................................................................3
Task 1.1......................................................................................................................................................3
Task 1.2......................................................................................................................................................3
Task 2: Housing Data Analysis Using Rapidminer.......................................................................................5
Task 2.1: EDA of Housing.csv File........................................................................................................... 5
Task 2.2: Performing Linear Regression.................................................................................................11
Task 3: Tableau............................................................................................................................................15
Task 3.1: Graph View.............................................................................................................................. 15
Task 3.2: Creating Geo Map using Tableau............................................................................................ 17
References:...................................................................................................................................................18
List of Figures
Figure 1: EDA Process in Rapidminer...........................................................................................................5
Figure 2: Statistical Graph for Data............................................................................................................... 6
Figure 3: Data Analysis over housing.csv..................................................................................................... 7
Figure 4: Histogram for values and frequencies............................................................................................ 8
Figure 5: Population Vs medianHouseValues Scatter Plot............................................................................9
Figure 6: Block chart...................................................................................................................................10
Figure 7: Design...........................................................................................................................................12
Figure 8: accuracy View.............................................................................................................................. 13
Figure 9: Performance Chart........................................................................................................................14
Figure 10: Graph Views...............................................................................................................................15
Figure 11: Geo Map..................................................................................................................................... 17
Task 1
Task 1.1
Any assumption that has been done within organization in order to contribute the beliefs of environment
towards the society in a unique manner. The organization culture represents those beliefs that are assumed
to be contributing to the social environment in the organization in a unique manner. There are different
factors that are going to be helpful in maintaining the organizational culture and influencing the market
belief. Further, it could be said that the organizational Culture is said to be a set of those assumptions that
follows same approach and that helps in guiding the organizations about what is going to happen and
according to it guide them appropriately for various situations (Needle 2009).
Decision Making Based on Data-Drievn approach is used in business in order to get a bettter insight over
the sales or any other valuable decision. In the biginning, if any managerial person wants to view the data
or get insgight over some data at granular level, then the manager has to go respective IT specialist in
order to get the processed requests and then that person is going to create that data and give it to them on
periodic basis but nowadays it is very easily to find relevant data over any type of query also the
managers can easily customize that data according to their needs. Data-Driven Approach is highly useful
in many industries where organizational part in needed like Healthcare, Manufacturing, Transportation of
goods in order to tell whether the allocated amount is sufficient or any other type of predictions.
Task 1.2
Most of the Organizations depends upon data in order to gain advantage in the business. Any organization
can use many number of policies in order to improve their businesses using the Data Driven Decision
Making. It is done by creating a proper structuring of plan and those plan are going to be used in
segments in order to enhance the usability of the Data that is processed earlier. Also, the Data that is used
in analysis of the market research. Organizational Culture can be affected by the Data-Driven Approach
as it is going to give proper balance between reality and the aim of the organization. Every organization
needs a strategy in order to apply that data driven policy within the organization. IN order to implement
that strategy in the business a key goal should be created that is going to be focused and according to that
all of the Strategies are going to be made. If any organization culture adopt data driven Decision making,
then they can become better in competitive environment and that can help in making many companies to
gain advantage by using that data (Ballou, Heitger & Stoel 2018).
Customers in Data Driven Companies can be much more profitable as the organization tends to think
about the customer needs and helps in focusing on them. This plan is going to be Cost Effective as it is
going to help in increasing the cost-effectiveness of the data.
The below steps are going to be helpful in attaining the Data-Driven Decision Making:
Effective Strategy: Every Decision Making starts with effective Strategy Planning and it starts
with goal Identification and getting to know the business objectives of the organization.
Identification of Key Areas: Flow of Data within any organization is multidirectional that means
the data flow from all directions like the queries of Customer to Machine Learning. It is needed to
manage the data and then identify those factors that are supposed to be the key areas of the
business organization.
Targeting the desired Data: After the Key areas analysis the data sets are analysed in order to find
the effective solution or issues that are to be found within the target time. In this, we look out at
the Data set that we already have and then manage that data into streamline and providing
valuable information.
⊘ This is a preview!⊘
Do you want full access?
Subscribe today to unlock all pages.
Trusted by 1+ million students worldwide
Analysing the Collected data: IN this the data managers are going to be found out in order to
manage the data. They are usually those persons who manages the departments. In this step a
simple Excel analysis can be done in order to represent Knowledge.
The Efficiency of the Data-Driven Decision Making is also excellent because it enables in setting apart
the fee of the resources by using offering the fixtures in assets.
Further, it uses many types of methods that could be used in order to create Data-Driven Decision Making
like predictive modelling in order to get to know the results much better and in efficient manner. It is
going to provide better risk analysis for the Organizational Culture and those losses in the operations are
going to be less due to this.
Paraphrase This Document
Need a fresh take? Get an instant paraphrase of this document with our AI Paraphraser
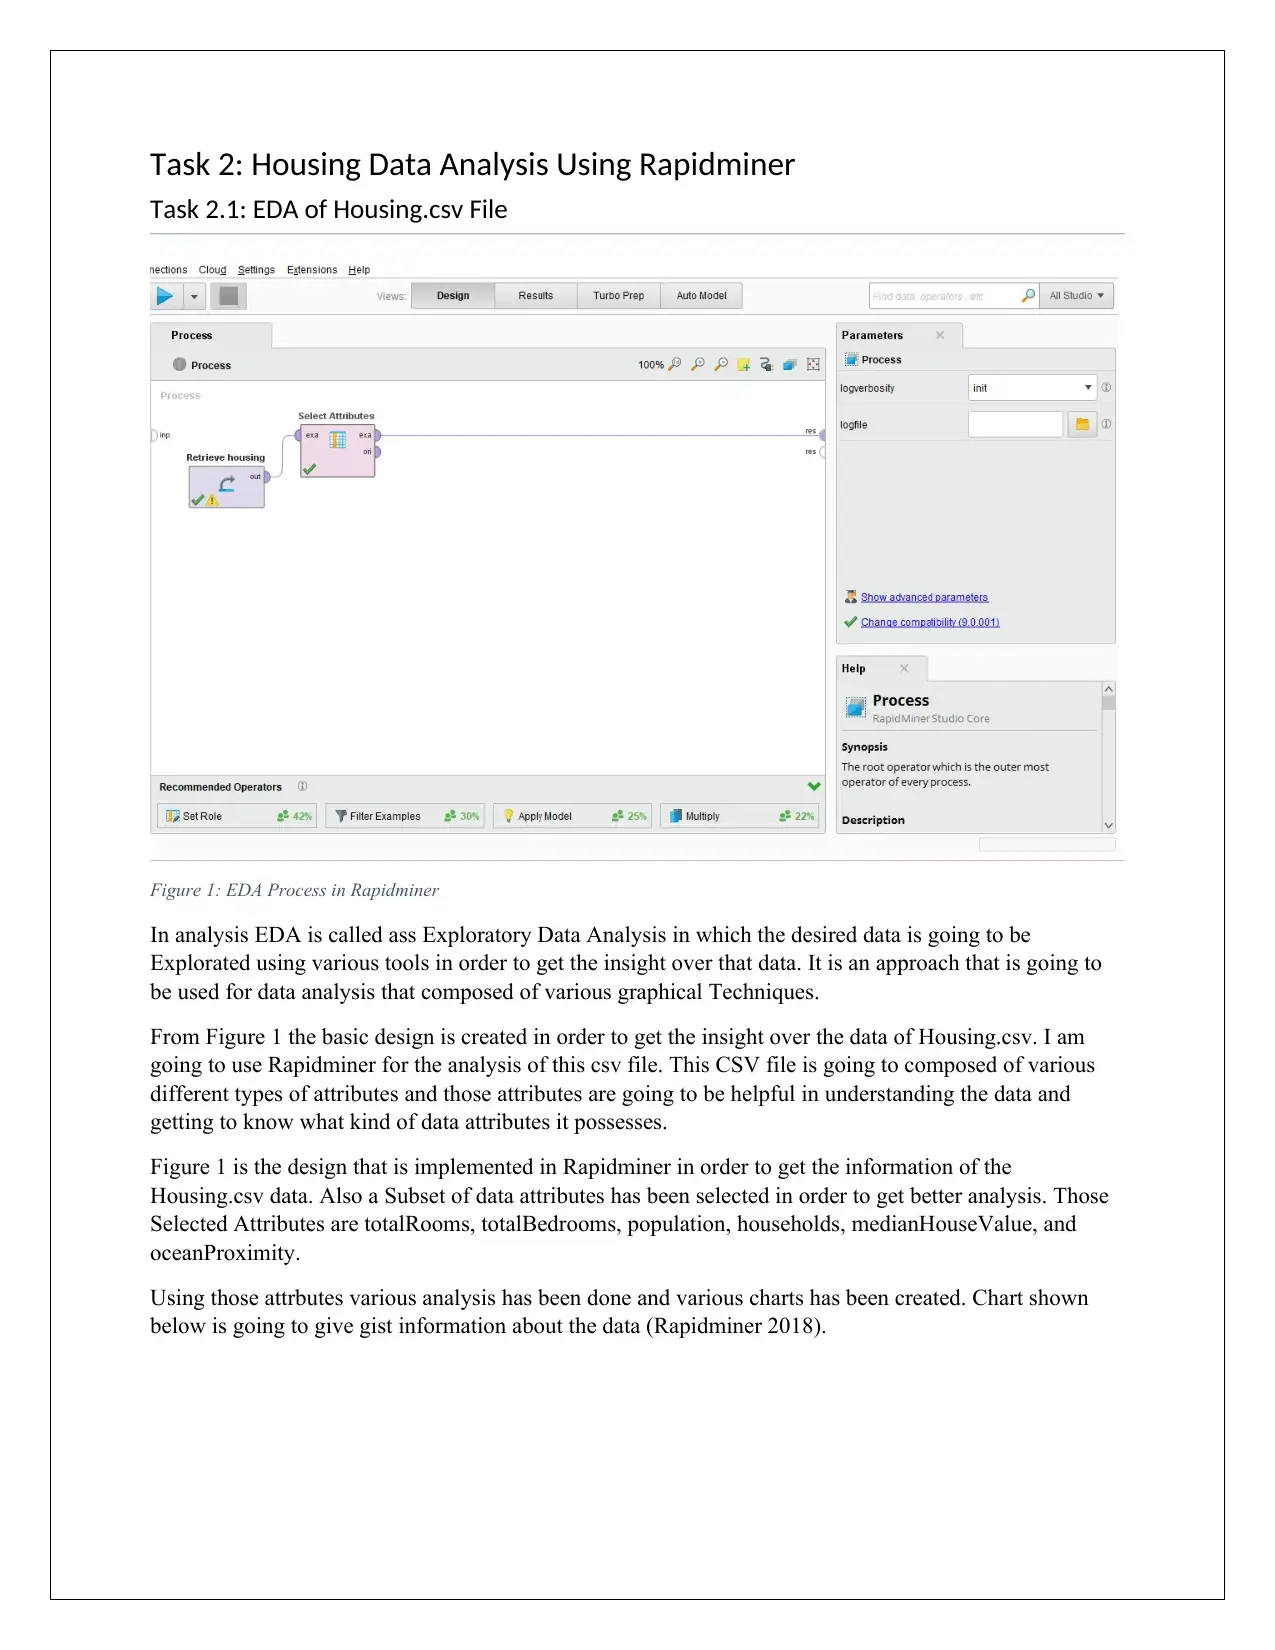
Task 2: Housing Data Analysis Using Rapidminer
Task 2.1: EDA of Housing.csv File
Figure 1: EDA Process in Rapidminer
In analysis EDA is called ass Exploratory Data Analysis in which the desired data is going to be
Explorated using various tools in order to get the insight over that data. It is an approach that is going to
be used for data analysis that composed of various graphical Techniques.
From Figure 1 the basic design is created in order to get the insight over the data of Housing.csv. I am
going to use Rapidminer for the analysis of this csv file. This CSV file is going to composed of various
different types of attributes and those attributes are going to be helpful in understanding the data and
getting to know what kind of data attributes it possesses.
Figure 1 is the design that is implemented in Rapidminer in order to get the information of the
Housing.csv data. Also a Subset of data attributes has been selected in order to get better analysis. Those
Selected Attributes are totalRooms, totalBedrooms, population, households, medianHouseValue, and
oceanProximity.
Using those attrbutes various analysis has been done and various charts has been created. Chart shown
below is going to give gist information about the data (Rapidminer 2018).
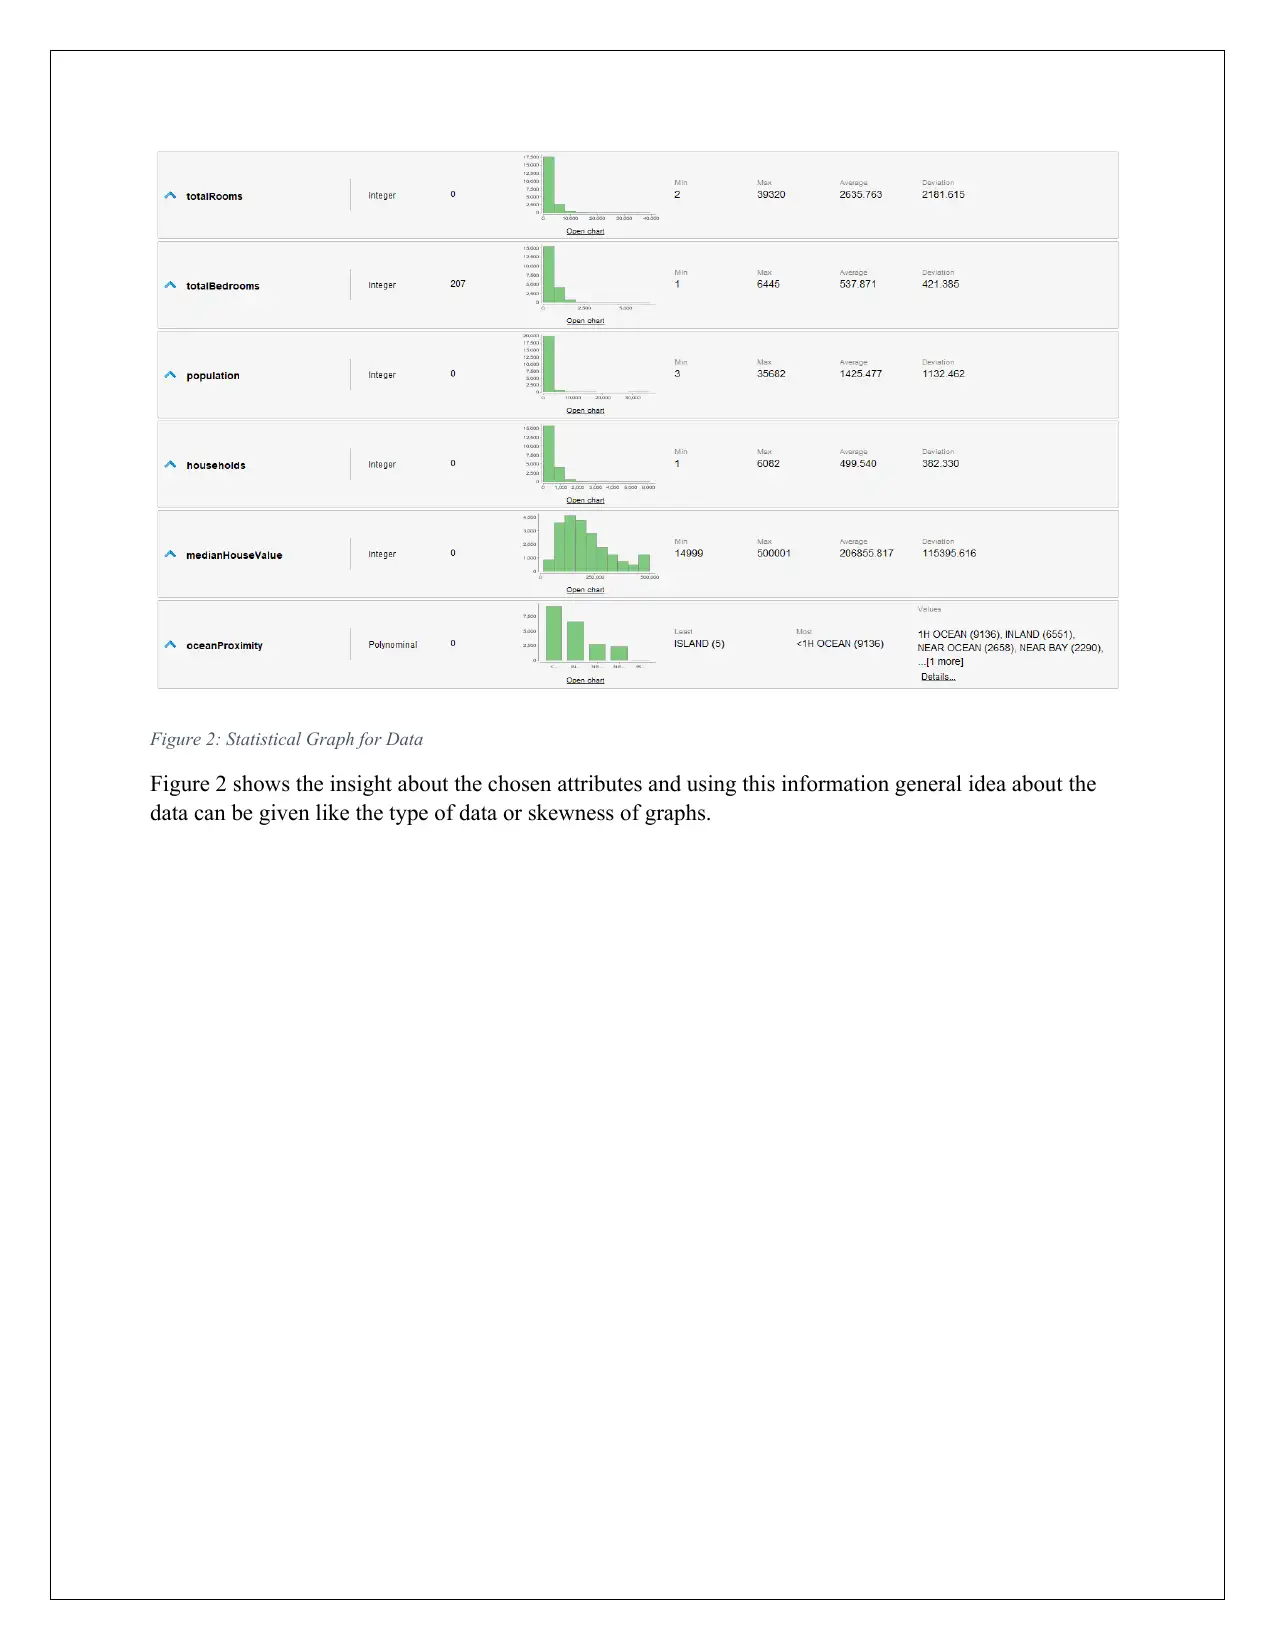
Figure 2: Statistical Graph for Data
Figure 2 shows the insight about the chosen attributes and using this information general idea about the
data can be given like the type of data or skewness of graphs.
Figure 2 shows the insight about the chosen attributes and using this information general idea about the
data can be given like the type of data or skewness of graphs.
⊘ This is a preview!⊘
Do you want full access?
Subscribe today to unlock all pages.
Trusted by 1+ million students worldwide
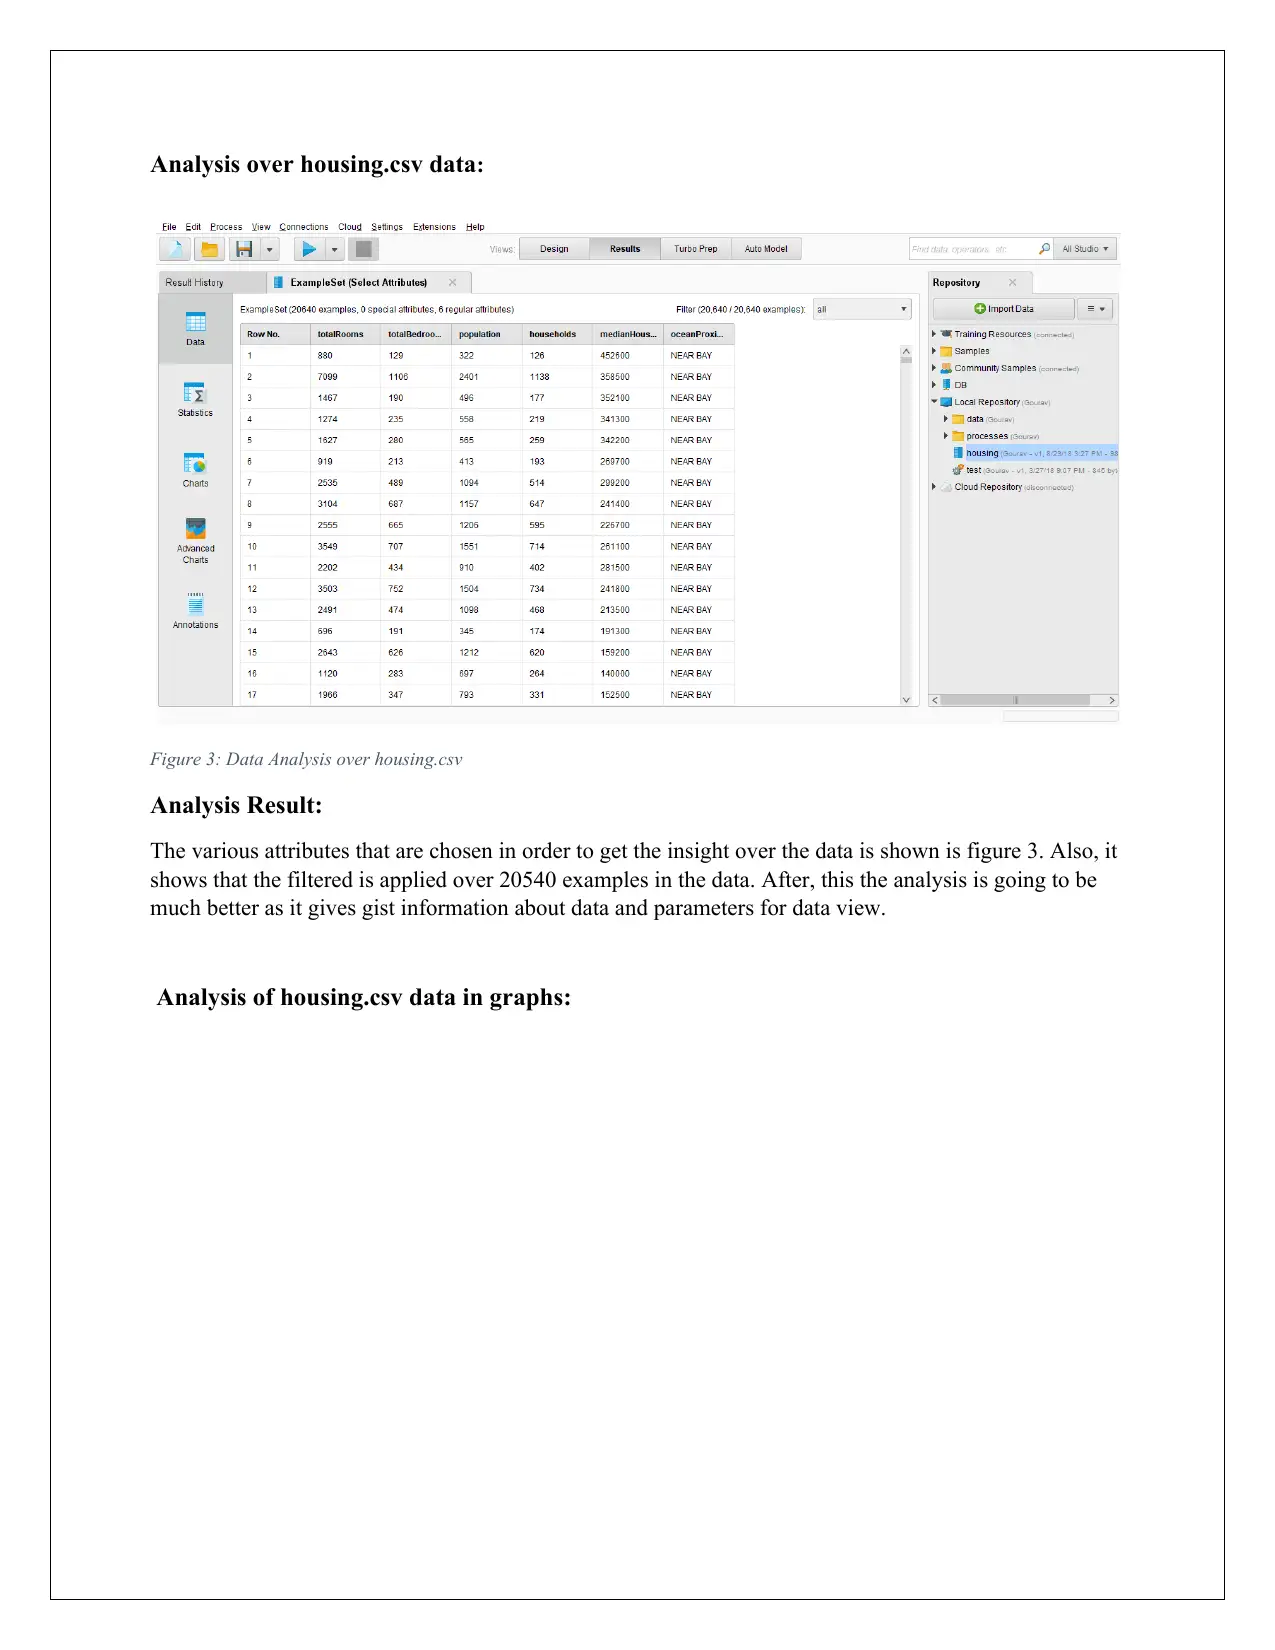
Analysis over housing.csv data:
Figure 3: Data Analysis over housing.csv
Analysis Result:
The various attributes that are chosen in order to get the insight over the data is shown is figure 3. Also, it
shows that the filtered is applied over 20540 examples in the data. After, this the analysis is going to be
much better as it gives gist information about data and parameters for data view.
Analysis of housing.csv data in graphs:
Paraphrase This Document
Need a fresh take? Get an instant paraphrase of this document with our AI Paraphraser
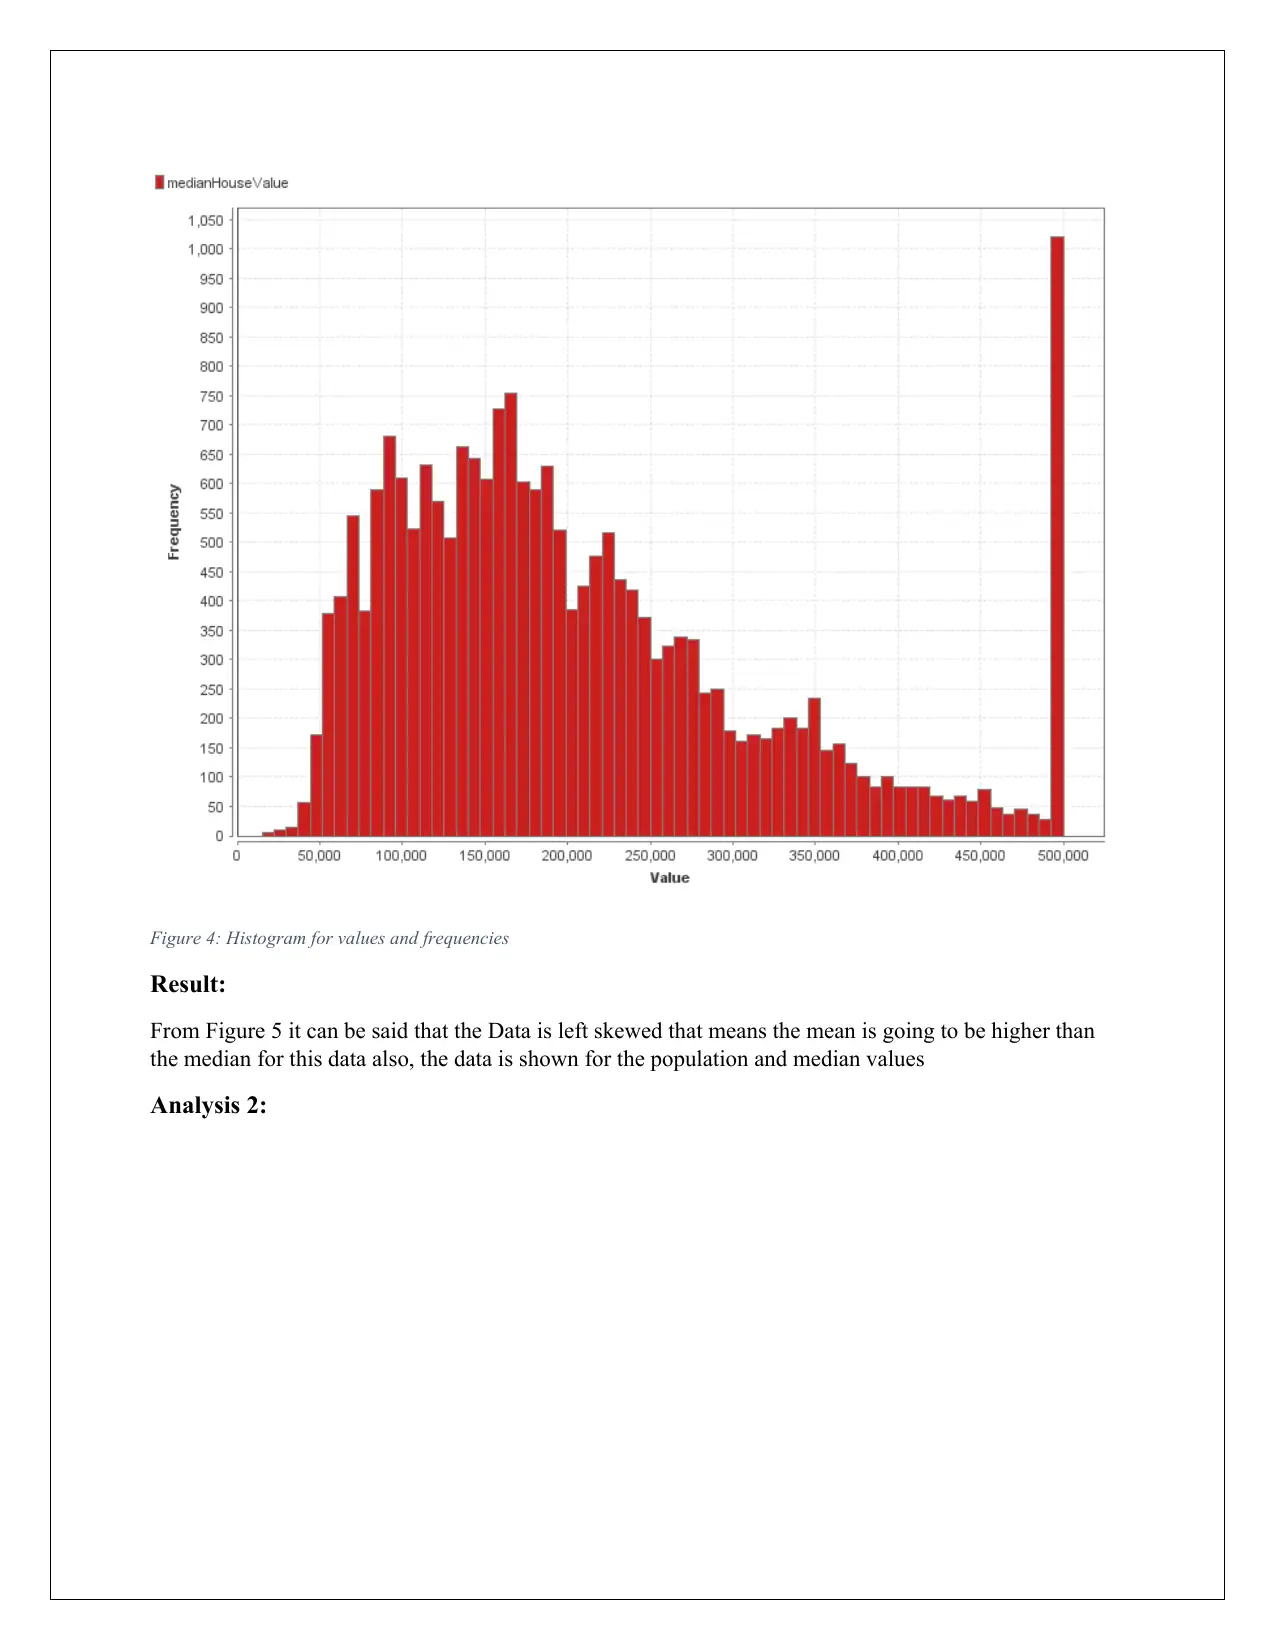
Figure 4: Histogram for values and frequencies
Result:
From Figure 5 it can be said that the Data is left skewed that means the mean is going to be higher than
the median for this data also, the data is shown for the population and median values
Analysis 2:
Result:
From Figure 5 it can be said that the Data is left skewed that means the mean is going to be higher than
the median for this data also, the data is shown for the population and median values
Analysis 2:
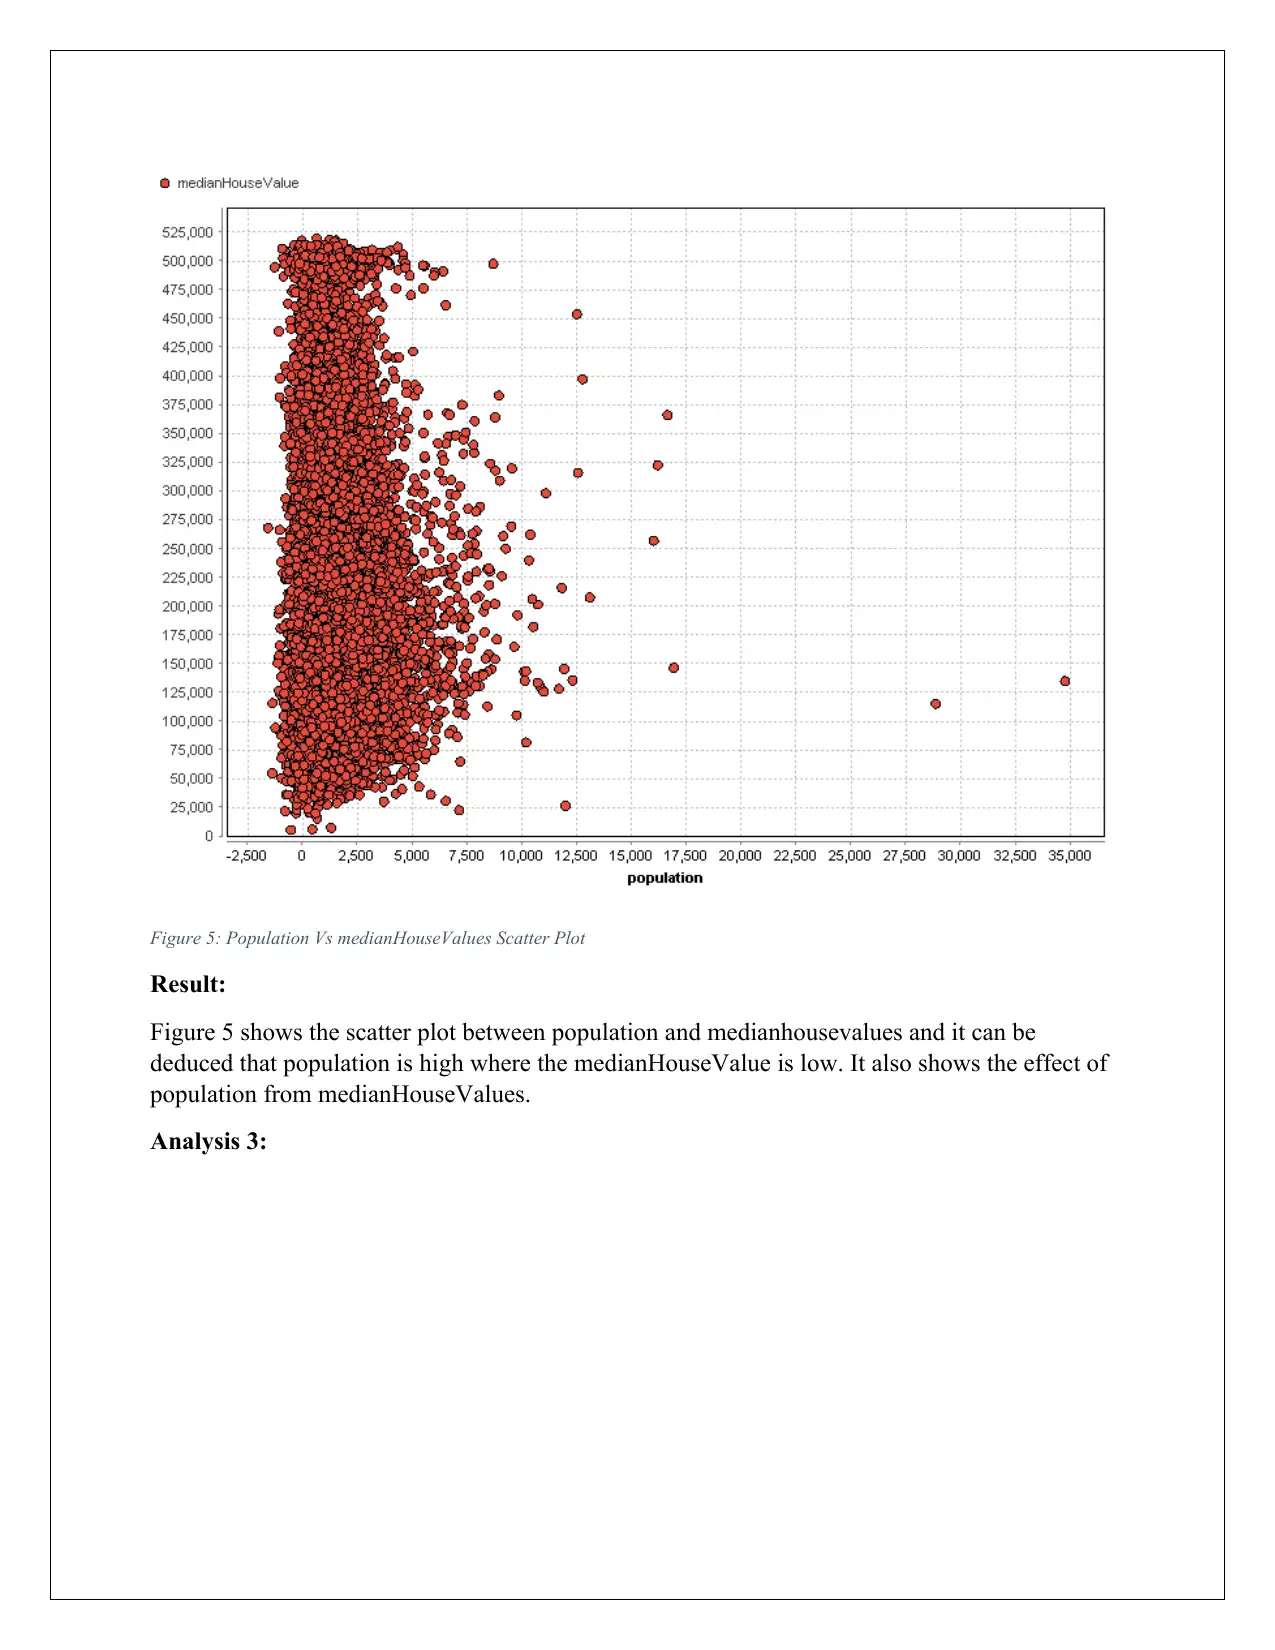
Figure 5: Population Vs medianHouseValues Scatter Plot
Result:
Figure 5 shows the scatter plot between population and medianhousevalues and it can be
deduced that population is high where the medianHouseValue is low. It also shows the effect of
population from medianHouseValues.
Analysis 3:
Result:
Figure 5 shows the scatter plot between population and medianhousevalues and it can be
deduced that population is high where the medianHouseValue is low. It also shows the effect of
population from medianHouseValues.
Analysis 3:
⊘ This is a preview!⊘
Do you want full access?
Subscribe today to unlock all pages.
Trusted by 1+ million students worldwide
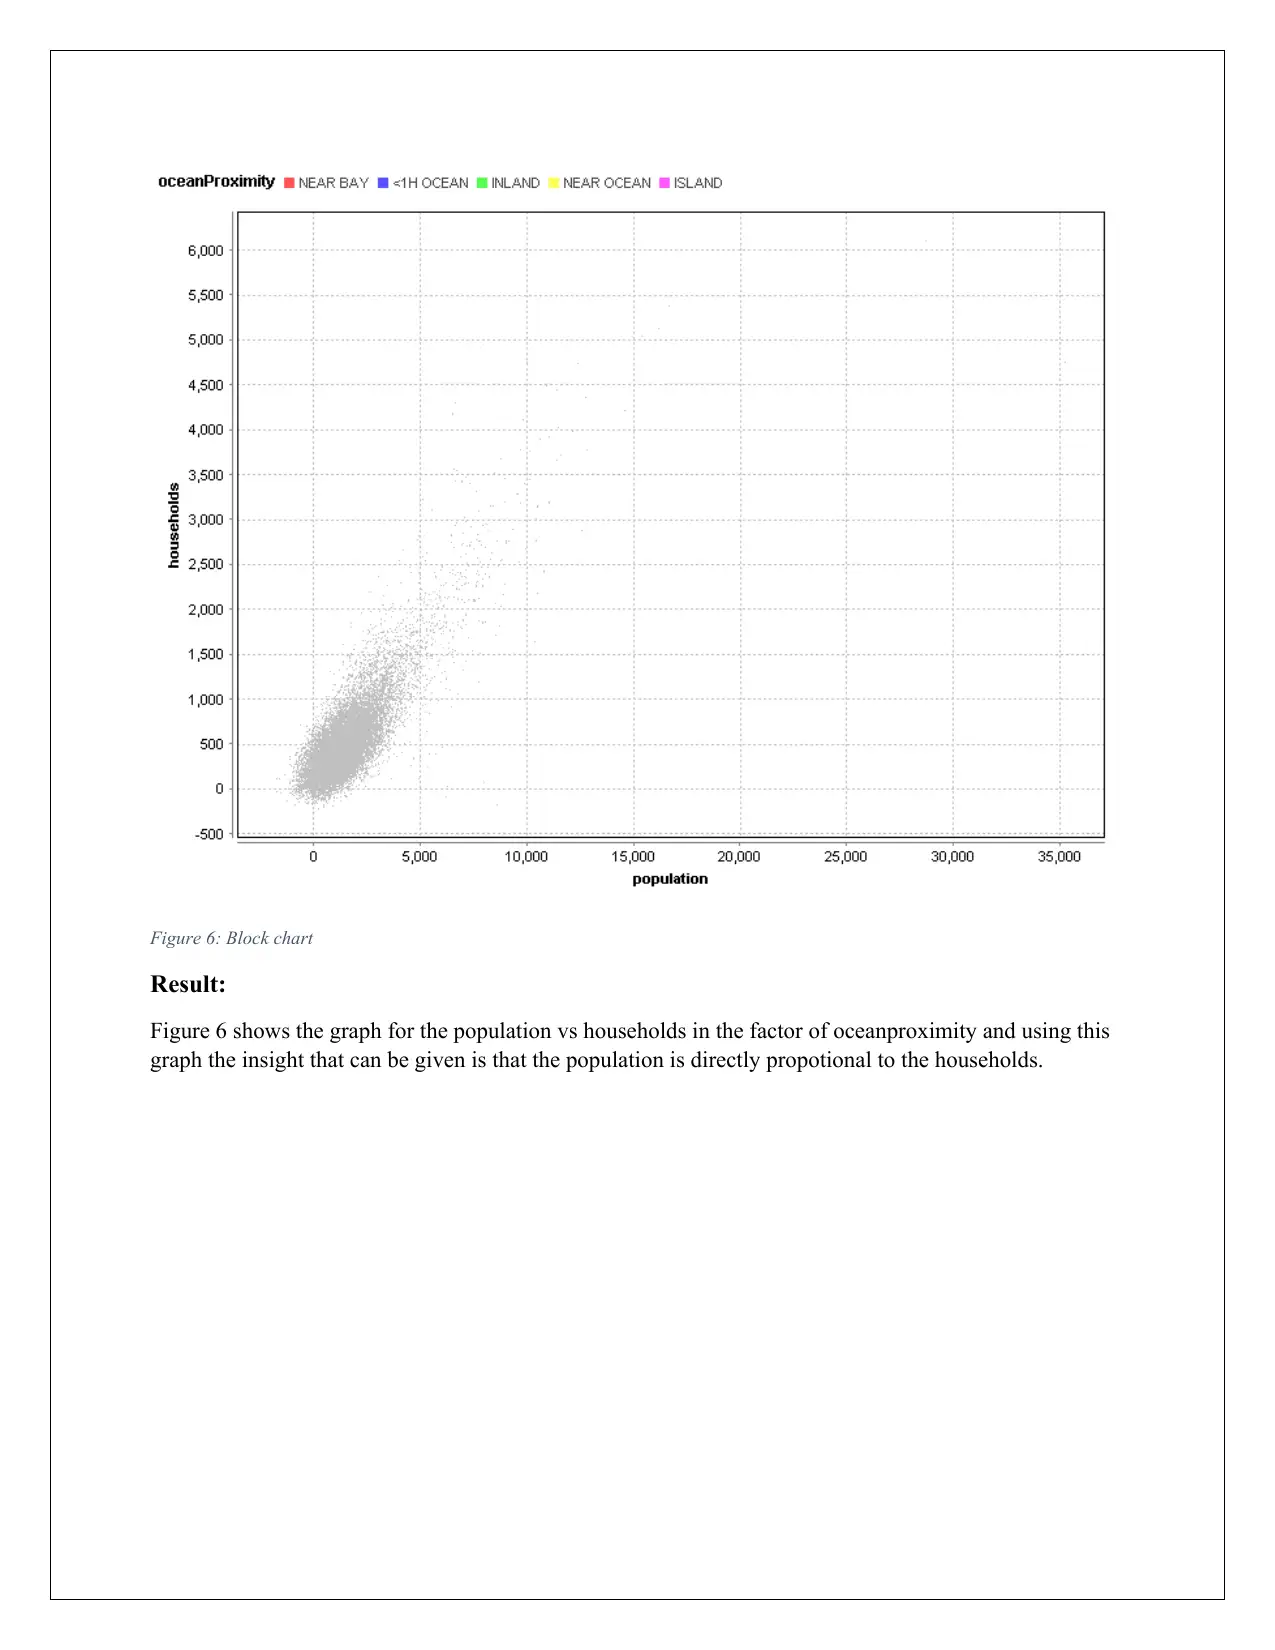
Figure 6: Block chart
Result:
Figure 6 shows the graph for the population vs households in the factor of oceanproximity and using this
graph the insight that can be given is that the population is directly propotional to the households.
Result:
Figure 6 shows the graph for the population vs households in the factor of oceanproximity and using this
graph the insight that can be given is that the population is directly propotional to the households.
Paraphrase This Document
Need a fresh take? Get an instant paraphrase of this document with our AI Paraphraser
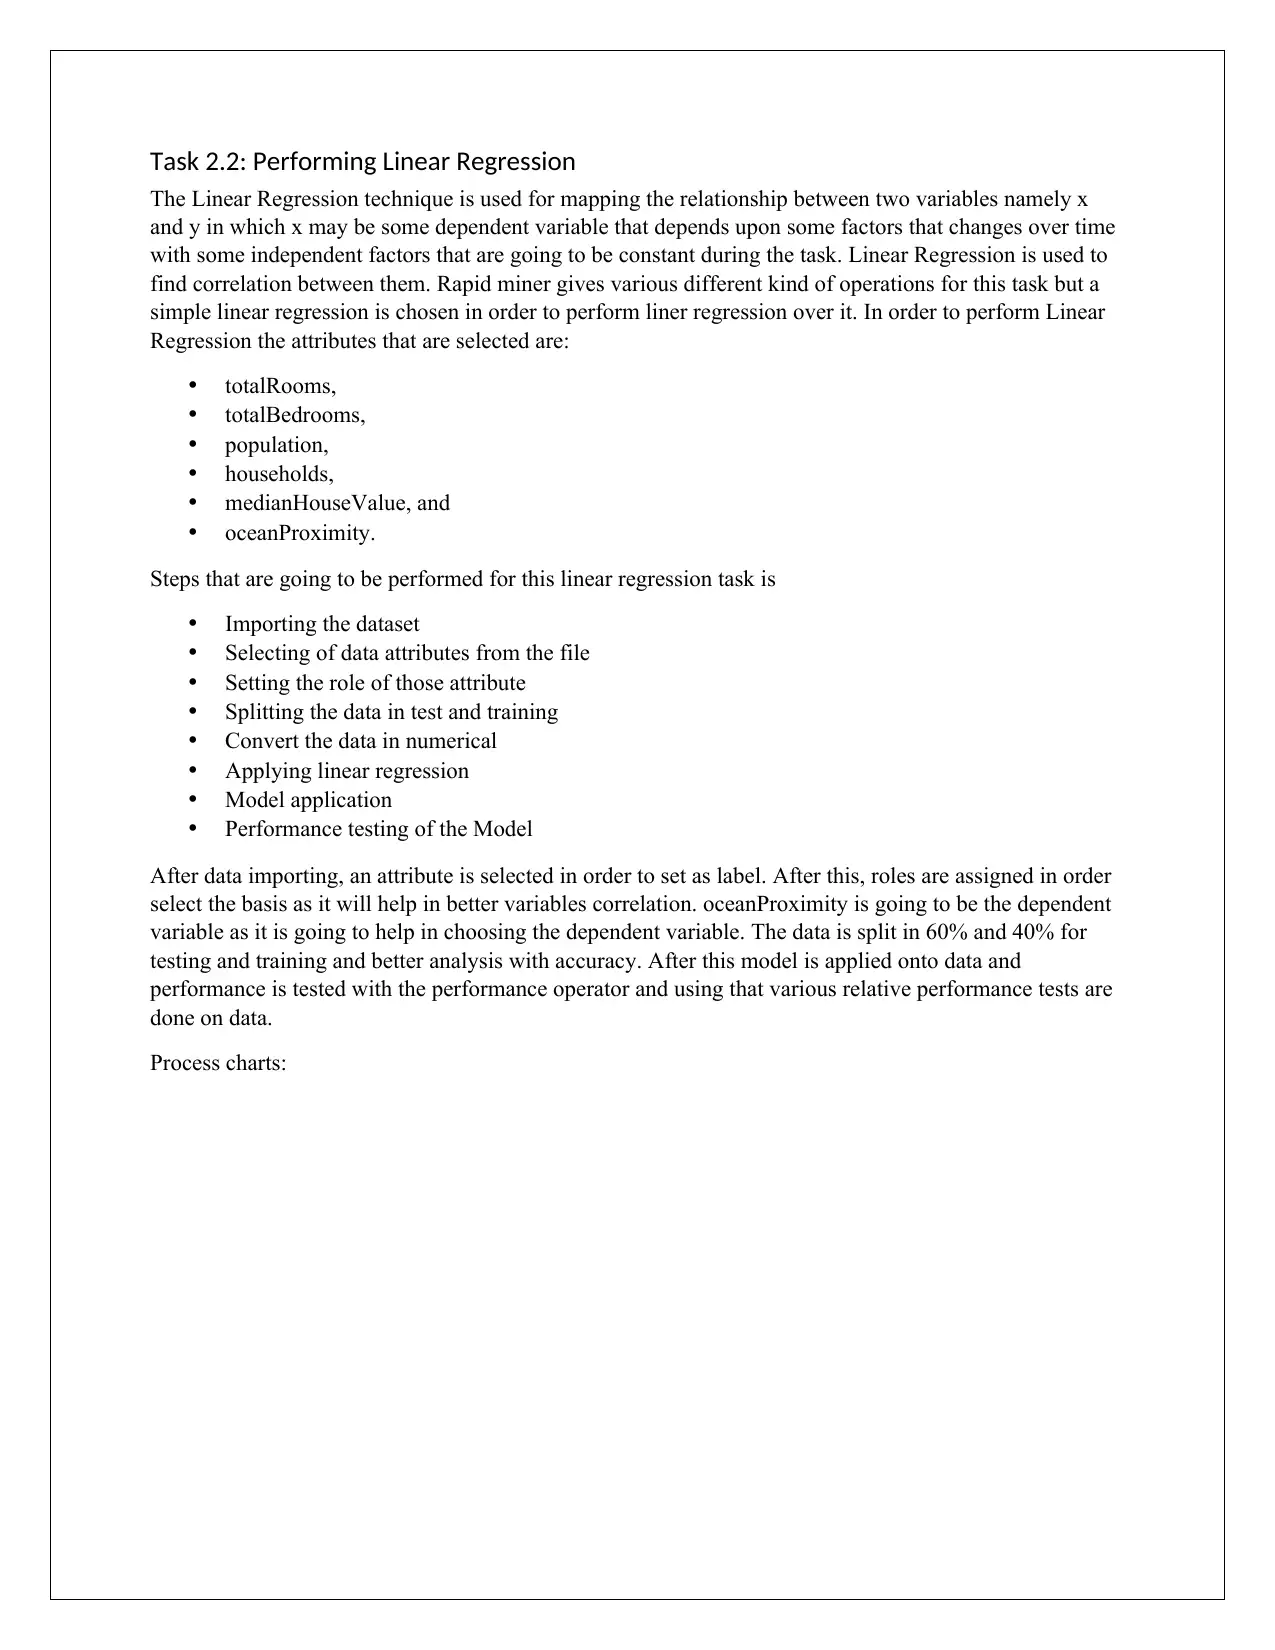
Task 2.2: Performing Linear Regression
The Linear Regression technique is used for mapping the relationship between two variables namely x
and y in which x may be some dependent variable that depends upon some factors that changes over time
with some independent factors that are going to be constant during the task. Linear Regression is used to
find correlation between them. Rapid miner gives various different kind of operations for this task but a
simple linear regression is chosen in order to perform liner regression over it. In order to perform Linear
Regression the attributes that are selected are:
totalRooms,
totalBedrooms,
population,
households,
medianHouseValue, and
oceanProximity.
Steps that are going to be performed for this linear regression task is
Importing the dataset
Selecting of data attributes from the file
Setting the role of those attribute
Splitting the data in test and training
Convert the data in numerical
Applying linear regression
Model application
Performance testing of the Model
After data importing, an attribute is selected in order to set as label. After this, roles are assigned in order
select the basis as it will help in better variables correlation. oceanProximity is going to be the dependent
variable as it is going to help in choosing the dependent variable. The data is split in 60% and 40% for
testing and training and better analysis with accuracy. After this model is applied onto data and
performance is tested with the performance operator and using that various relative performance tests are
done on data.
Process charts:
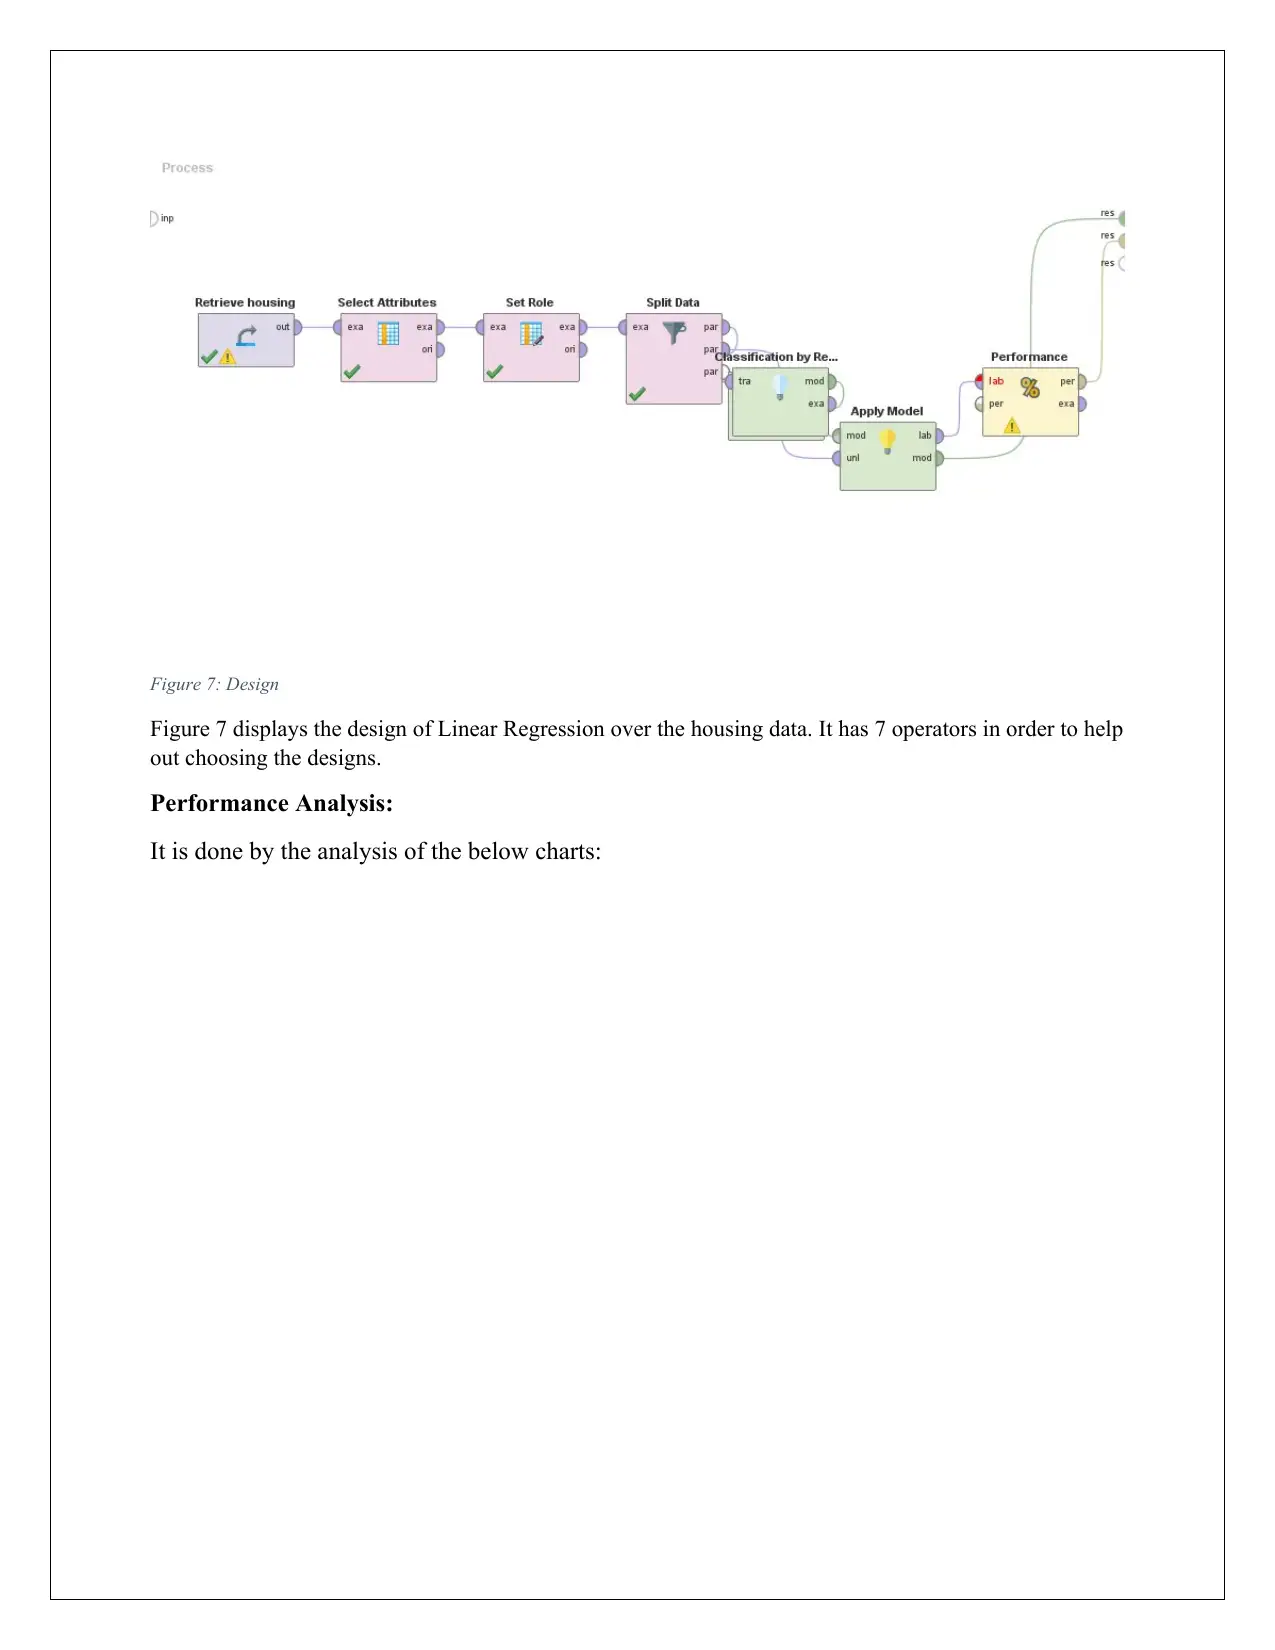
Figure 7: Design
Figure 7 displays the design of Linear Regression over the housing data. It has 7 operators in order to help
out choosing the designs.
Performance Analysis:
It is done by the analysis of the below charts:
Figure 7 displays the design of Linear Regression over the housing data. It has 7 operators in order to help
out choosing the designs.
Performance Analysis:
It is done by the analysis of the below charts:
⊘ This is a preview!⊘
Do you want full access?
Subscribe today to unlock all pages.
Trusted by 1+ million students worldwide
1 out of 18
Related Documents


Your All-in-One AI-Powered Toolkit for Academic Success.
+13062052269
info@desklib.com
Available 24*7 on WhatsApp / Email
![[object Object]](/_next/static/media/star-bottom.7253800d.svg)
Unlock your academic potential
Copyright © 2020–2026 A2Z Services. All Rights Reserved. Developed and managed by ZUCOL.