Analysis of the Australian Housing Sector: Supply, Demand, and Policy
VerifiedAdded on 2020/03/04
|4
|1269
|36
Report
AI Summary
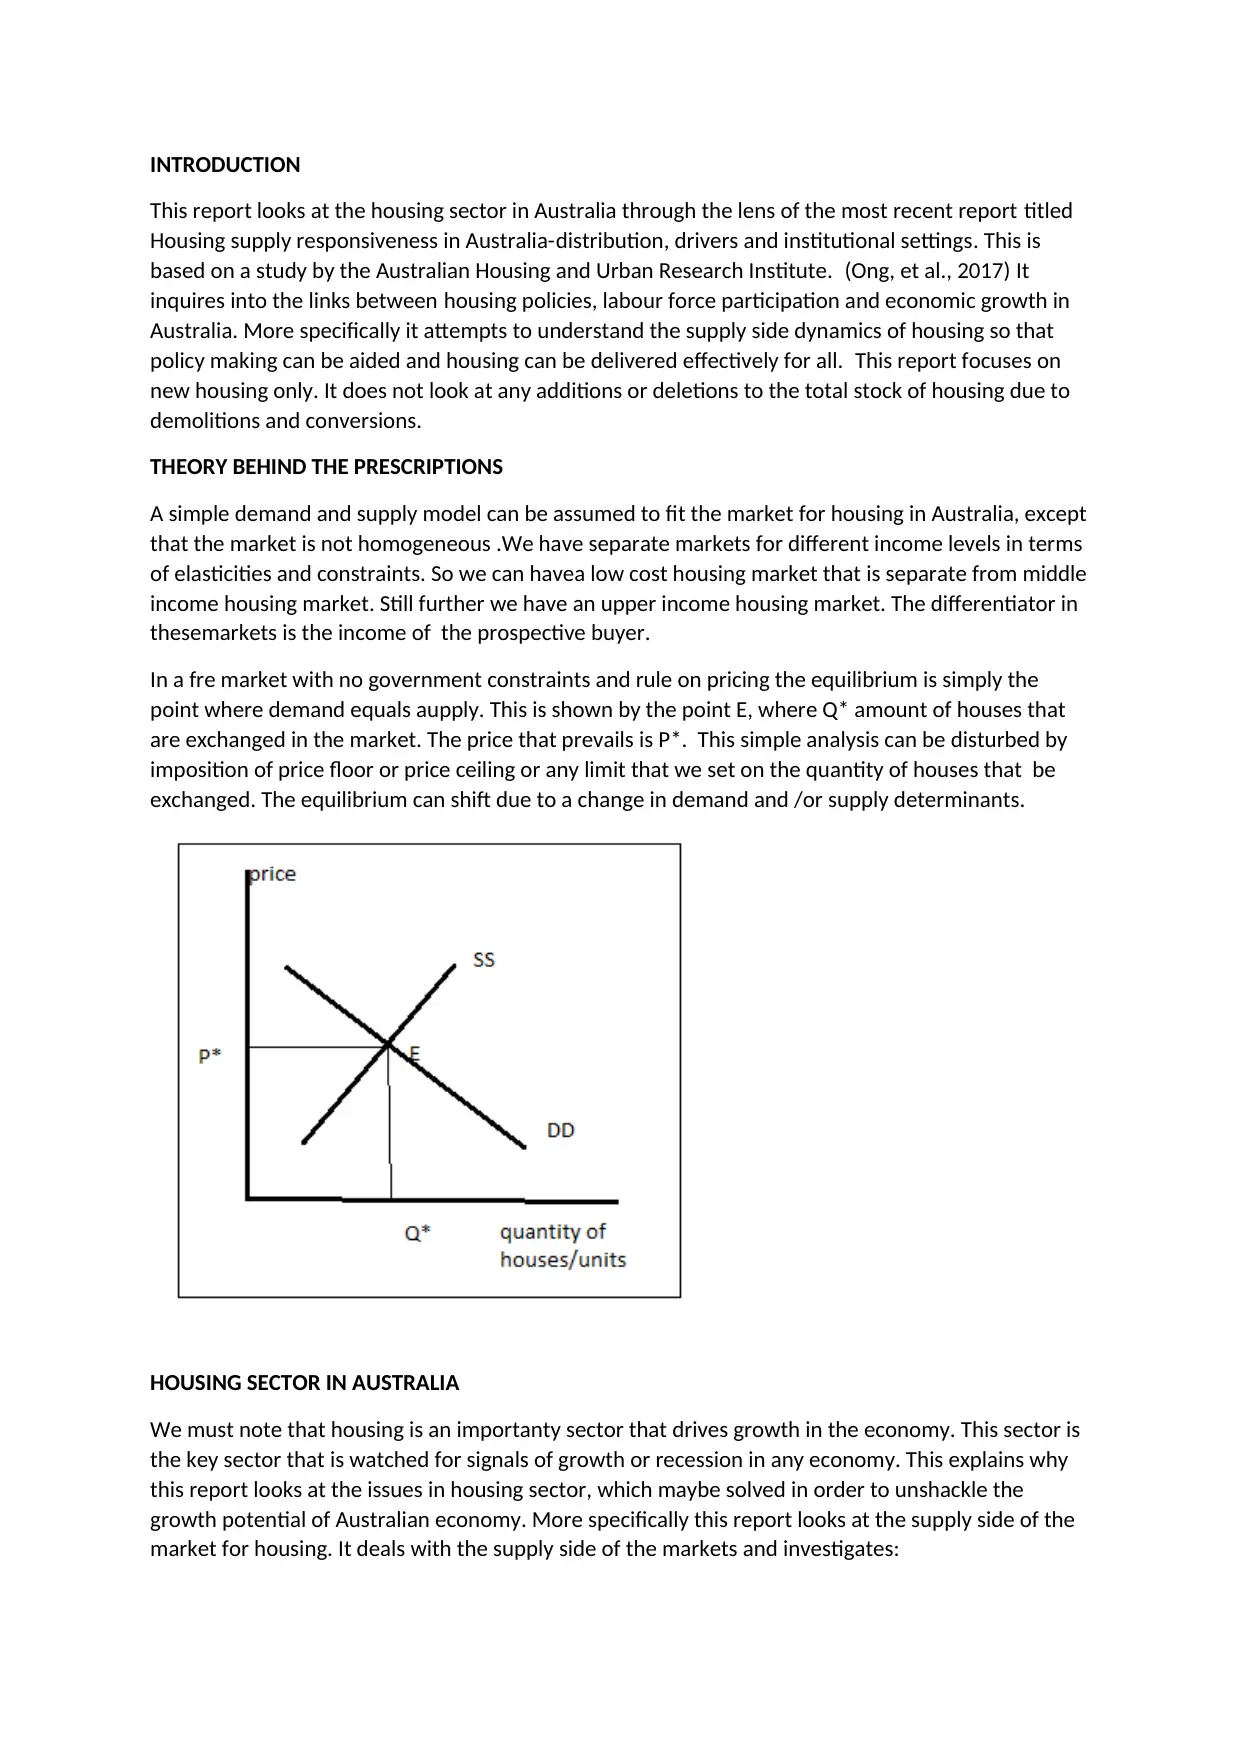
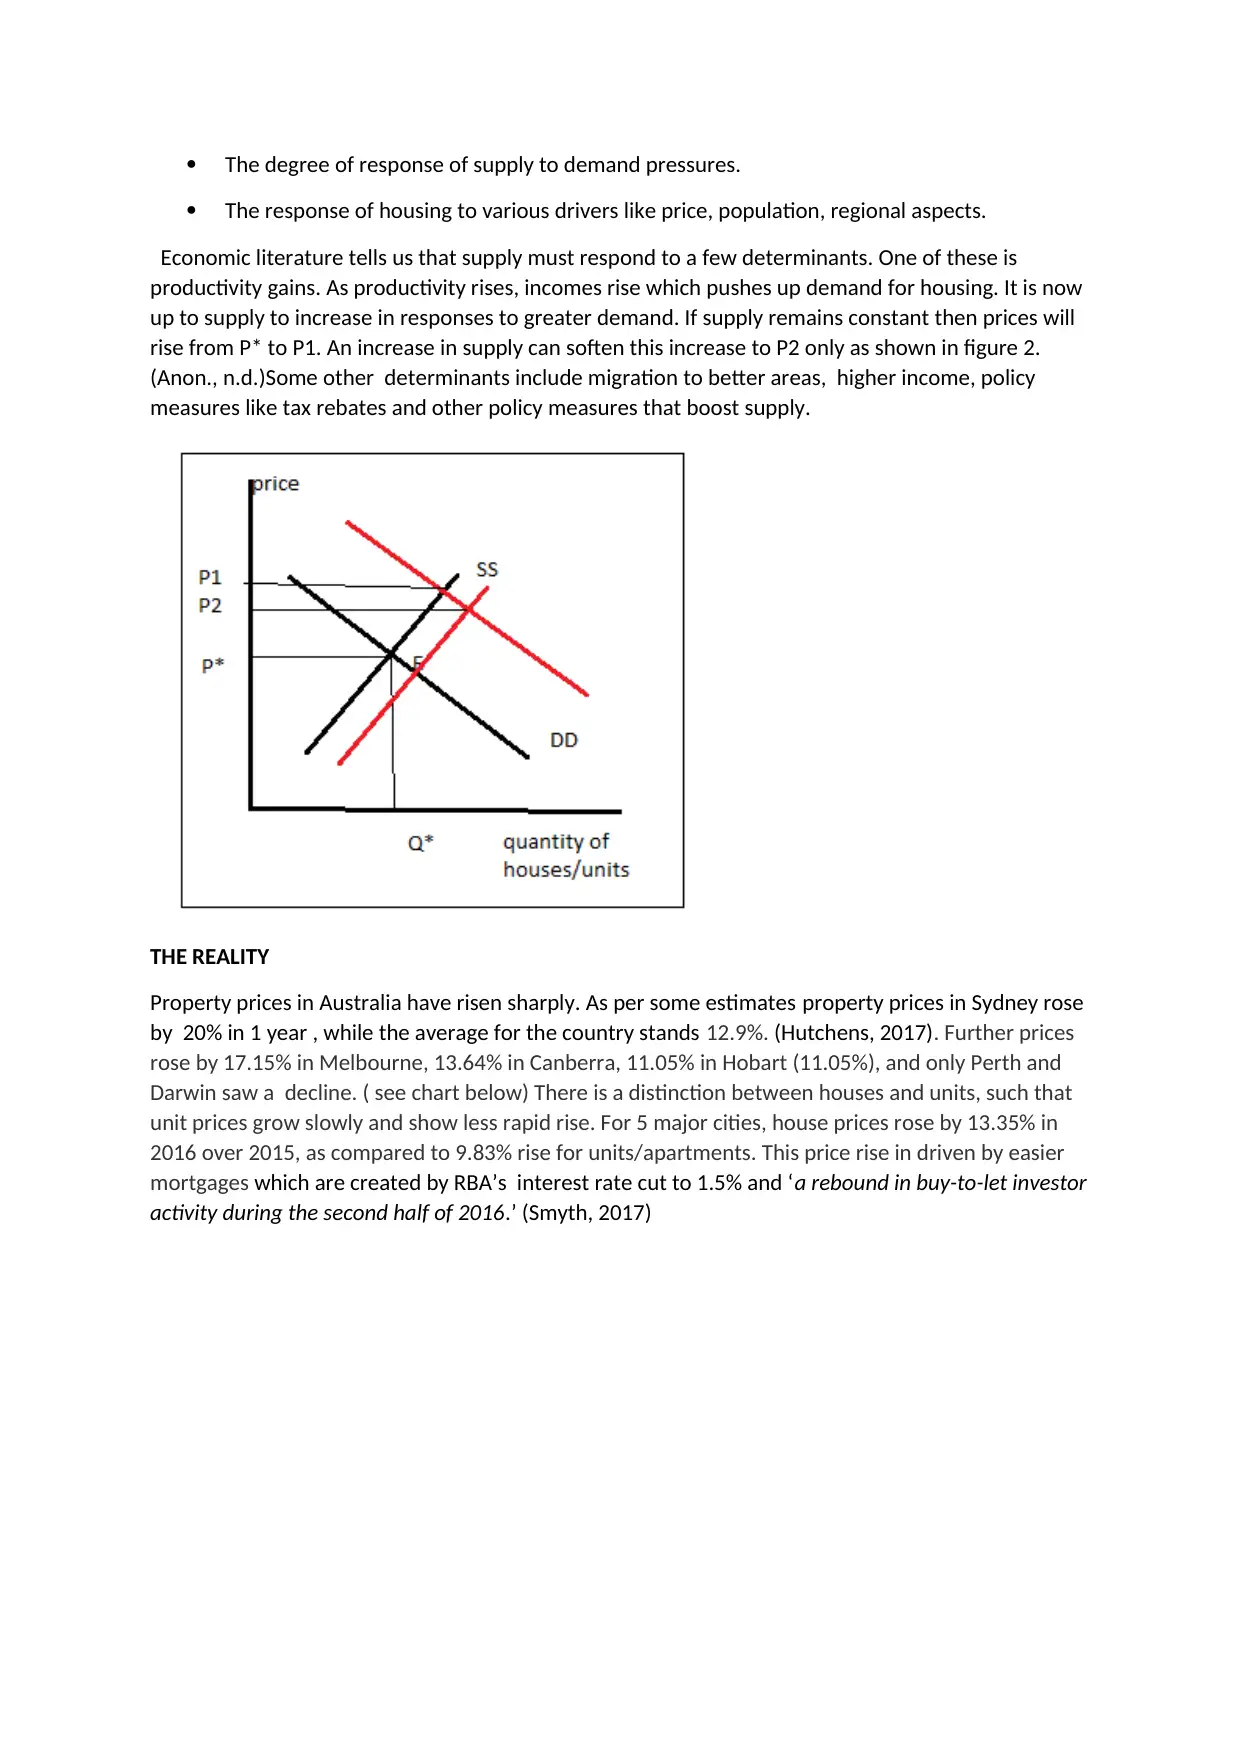
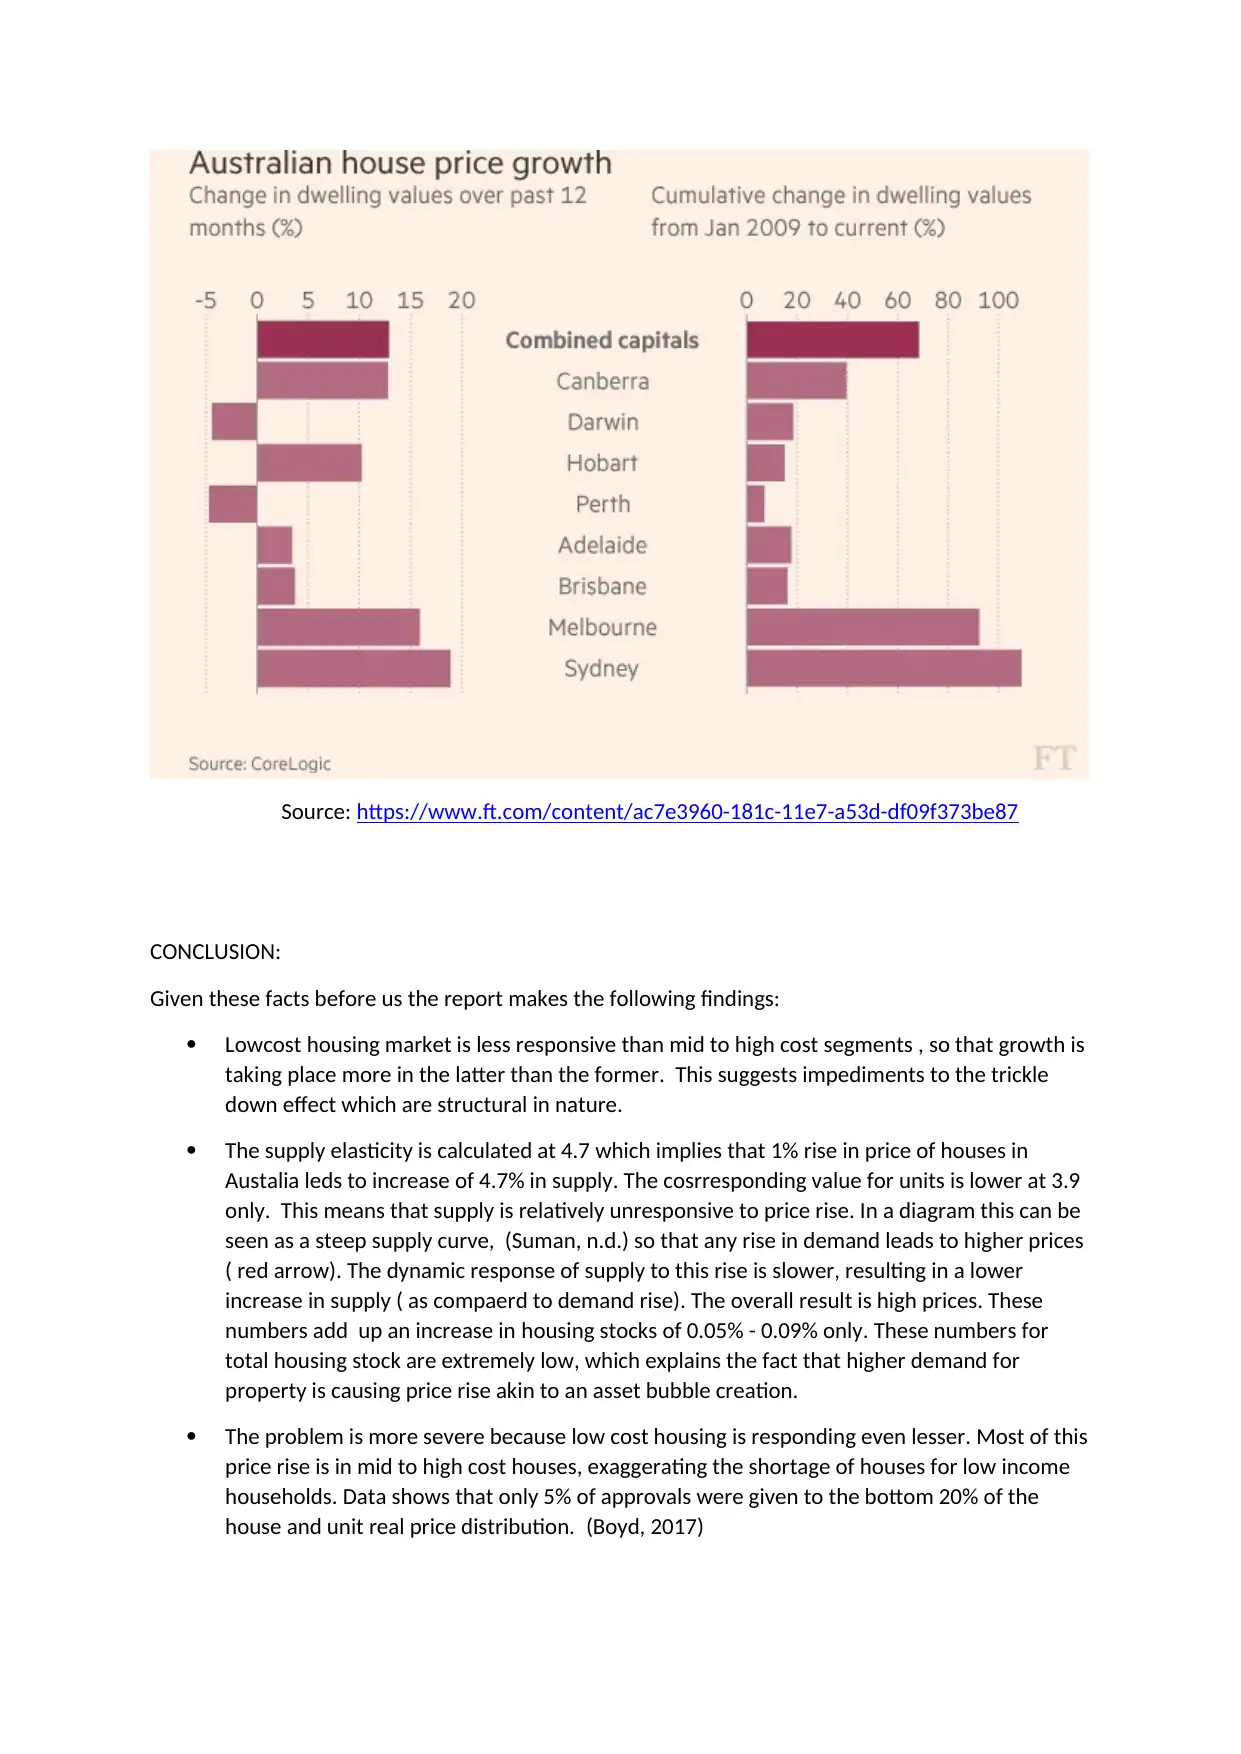
This report analyzes the Australian housing sector, focusing on supply-side dynamics and responsiveness to demand pressures. It references a study by the Australian Housing and Urban Research Institute and examines the relationship between housing policies, labor force participation, and economic growth. The report discusses the application of a supply and demand model, considering different income levels and market segments. It highlights the sharp rise in property prices, particularly in major cities, and explores the drivers behind these increases, including interest rate cuts and investor activity. Key findings include the lower responsiveness of low-cost housing, the supply elasticity, and the concentration of new housing in already developed areas. The report concludes by emphasizing the need for policy measures to address imbalances in the Australian housing market, considering income levels, geography, and regional disparities.

INTRODUCTION
This report looks at the housing sector in Australia through the lens of the most recent report titled
Housing supply responsiveness in Australia-distribution, drivers and institutional settings. This is
based on a study by the Australian Housing and Urban Research Institute. (Ong, et al., 2017) It
inquires into the links between housing policies, labour force participation and economic growth in
Australia. More specifically it attempts to understand the supply side dynamics of housing so that
policy making can be aided and housing can be delivered effectively for all. This report focuses on
new housing only. It does not look at any additions or deletions to the total stock of housing due to
demolitions and conversions.
THEORY BEHIND THE PRESCRIPTIONS
A simple demand and supply model can be assumed to fit the market for housing in Australia, except
that the market is not homogeneous .We have separate markets for different income levels in terms
of elasticities and constraints. So we can havea low cost housing market that is separate from middle
income housing market. Still further we have an upper income housing market. The differentiator in
thesemarkets is the income of the prospective buyer.
In a fre market with no government constraints and rule on pricing the equilibrium is simply the
point where demand equals aupply. This is shown by the point E, where Q* amount of houses that
are exchanged in the market. The price that prevails is P*. This simple analysis can be disturbed by
imposition of price floor or price ceiling or any limit that we set on the quantity of houses that be
exchanged. The equilibrium can shift due to a change in demand and /or supply determinants.
HOUSING SECTOR IN AUSTRALIA
We must note that housing is an importanty sector that drives growth in the economy. This sector is
the key sector that is watched for signals of growth or recession in any economy. This explains why
this report looks at the issues in housing sector, which maybe solved in order to unshackle the
growth potential of Australian economy. More specifically this report looks at the supply side of the
market for housing. It deals with the supply side of the markets and investigates:
Paraphrase This Document
Need a fresh take? Get an instant paraphrase of this document with our AI Paraphraser

The degree of response of supply to demand pressures.
The response of housing to various drivers like price, population, regional aspects.
Economic literature tells us that supply must respond to a few determinants. One of these is
productivity gains. As productivity rises, incomes rise which pushes up demand for housing. It is now
up to supply to increase in responses to greater demand. If supply remains constant then prices will
rise from P* to P1. An increase in supply can soften this increase to P2 only as shown in figure 2.
(Anon., n.d.)Some other determinants include migration to better areas, higher income, policy
measures like tax rebates and other policy measures that boost supply.
THE REALITY
Property prices in Australia have risen sharply. As per some estimates property prices in Sydney rose
by 20% in 1 year , while the average for the country stands 12.9%. (Hutchens, 2017). Further prices
rose by 17.15% in Melbourne, 13.64% in Canberra, 11.05% in Hobart (11.05%), and only Perth and
Darwin saw a decline. ( see chart below) There is a distinction between houses and units, such that
unit prices grow slowly and show less rapid rise. For 5 major cities, house prices rose by 13.35% in
2016 over 2015, as compared to 9.83% rise for units/apartments. This price rise in driven by easier
mortgages which are created by RBA’s interest rate cut to 1.5% and ‘a rebound in buy-to-let investor
activity during the second half of 2016.’ (Smyth, 2017)

Source: https://www.ft.com/content/ac7e3960-181c-11e7-a53d-df09f373be87
CONCLUSION:
Given these facts before us the report makes the following findings:
Lowcost housing market is less responsive than mid to high cost segments , so that growth is
taking place more in the latter than the former. This suggests impediments to the trickle
down effect which are structural in nature.
The supply elasticity is calculated at 4.7 which implies that 1% rise in price of houses in
Austalia leds to increase of 4.7% in supply. The cosrresponding value for units is lower at 3.9
only. This means that supply is relatively unresponsive to price rise. In a diagram this can be
seen as a steep supply curve, (Suman, n.d.) so that any rise in demand leads to higher prices
( red arrow). The dynamic response of supply to this rise is slower, resulting in a lower
increase in supply ( as compaerd to demand rise). The overall result is high prices. These
numbers add up an increase in housing stocks of 0.05% - 0.09% only. These numbers for
total housing stock are extremely low, which explains the fact that higher demand for
property is causing price rise akin to an asset bubble creation.
The problem is more severe because low cost housing is responding even lesser. Most of this
price rise is in mid to high cost houses, exaggerating the shortage of houses for low income
households. Data shows that only 5% of approvals were given to the bottom 20% of the
house and unit real price distribution. (Boyd, 2017)
⊘ This is a preview!⊘
Do you want full access?
Subscribe today to unlock all pages.

Trusted by 1+ million students worldwide

Also whatever new supply is getting built is concentrated in already developed areas. This is
exacerbating the regional imbalance in availability of houses. Lopsided growth and regional
imbalances are the natural result of such developments.
At a policy level new measures are required to help ease the imbalances that have been
created in the housing market in Australia. These imbalances exist in terms of income levels
of buyers, geography of new houses, rural-urban divide as well as developed and less
developed areas.
REFERENCES
Anon., n.d. SSC.wisc.edu. [Online]
Available at: http://www.ssc.wisc.edu/~scholz/Teaching_101/Lecture3.pdf
[Accessed 18 August 2017].
Boyd, E., 2017. Dailytelegraph.cm.au. [Online]
Available at: http://www.dailytelegraph.com.au/news/nsw/property-market-sydney-is-not-safe-as-
houses-median-price-today-is-1-million/news-story/81c299353f5d4c31424cf80214b2028fEDward
Boy
[Accessed 20 August 2017].
Hutchens, G., 2017. THe guardian.com. [Online]
Available at: https://www.theguardian.com/australia-news/2017/apr/03/sydney-property-prices-
rise-almost-20-in-past-12-months
[Accessed 19 August 2017].
Karp, P., 2017. THE GUARDIAN.COM. [Online]
Available at: https://www.theguardian.com/australia-news/2017/may/18/increased-housing-at-top-
end-not-trickling-down-to-help-poor-report-finds
[Accessed 18 august 2017].
Ong, R. et al., 2017. Ahuri.edu.au. [Online]
Available at: http://www.ahuri.edu.au/__data/assets/pdf_file/0012/13242/AHURI-Final-Report-281-
Housing-supply-responsiveness-in-Australia-distribution-drivers-and-institutional-settings.pdf
[Accessed 20 August 2017].
Smyth, J., 2017. FT.com. [Online]
Available at: https://www.ft.com/content/ac7e3960-181c-11e7-a53d-df09f373be87
[Accessed 20 August 2017].
Suman, S., n.d. [Online]
Available at: http://www.economicsdiscussion.net/demand/shifts-in-demand-and-supply-with-
diagram/12519
[Accessed 19 August 2017].
1 out of 4
Related Documents
Your All-in-One AI-Powered Toolkit for Academic Success.
+13062052269
info@desklib.com
Available 24*7 on WhatsApp / Email
Unlock your academic potential
Copyright © 2020–2025 A2Z Services. All Rights Reserved. Developed and managed by ZUCOL.


