Analytical CRM Project: Housing Price Regression Analysis Report
VerifiedAdded on 2022/11/14
|5
|1680
|355
Project
AI Summary
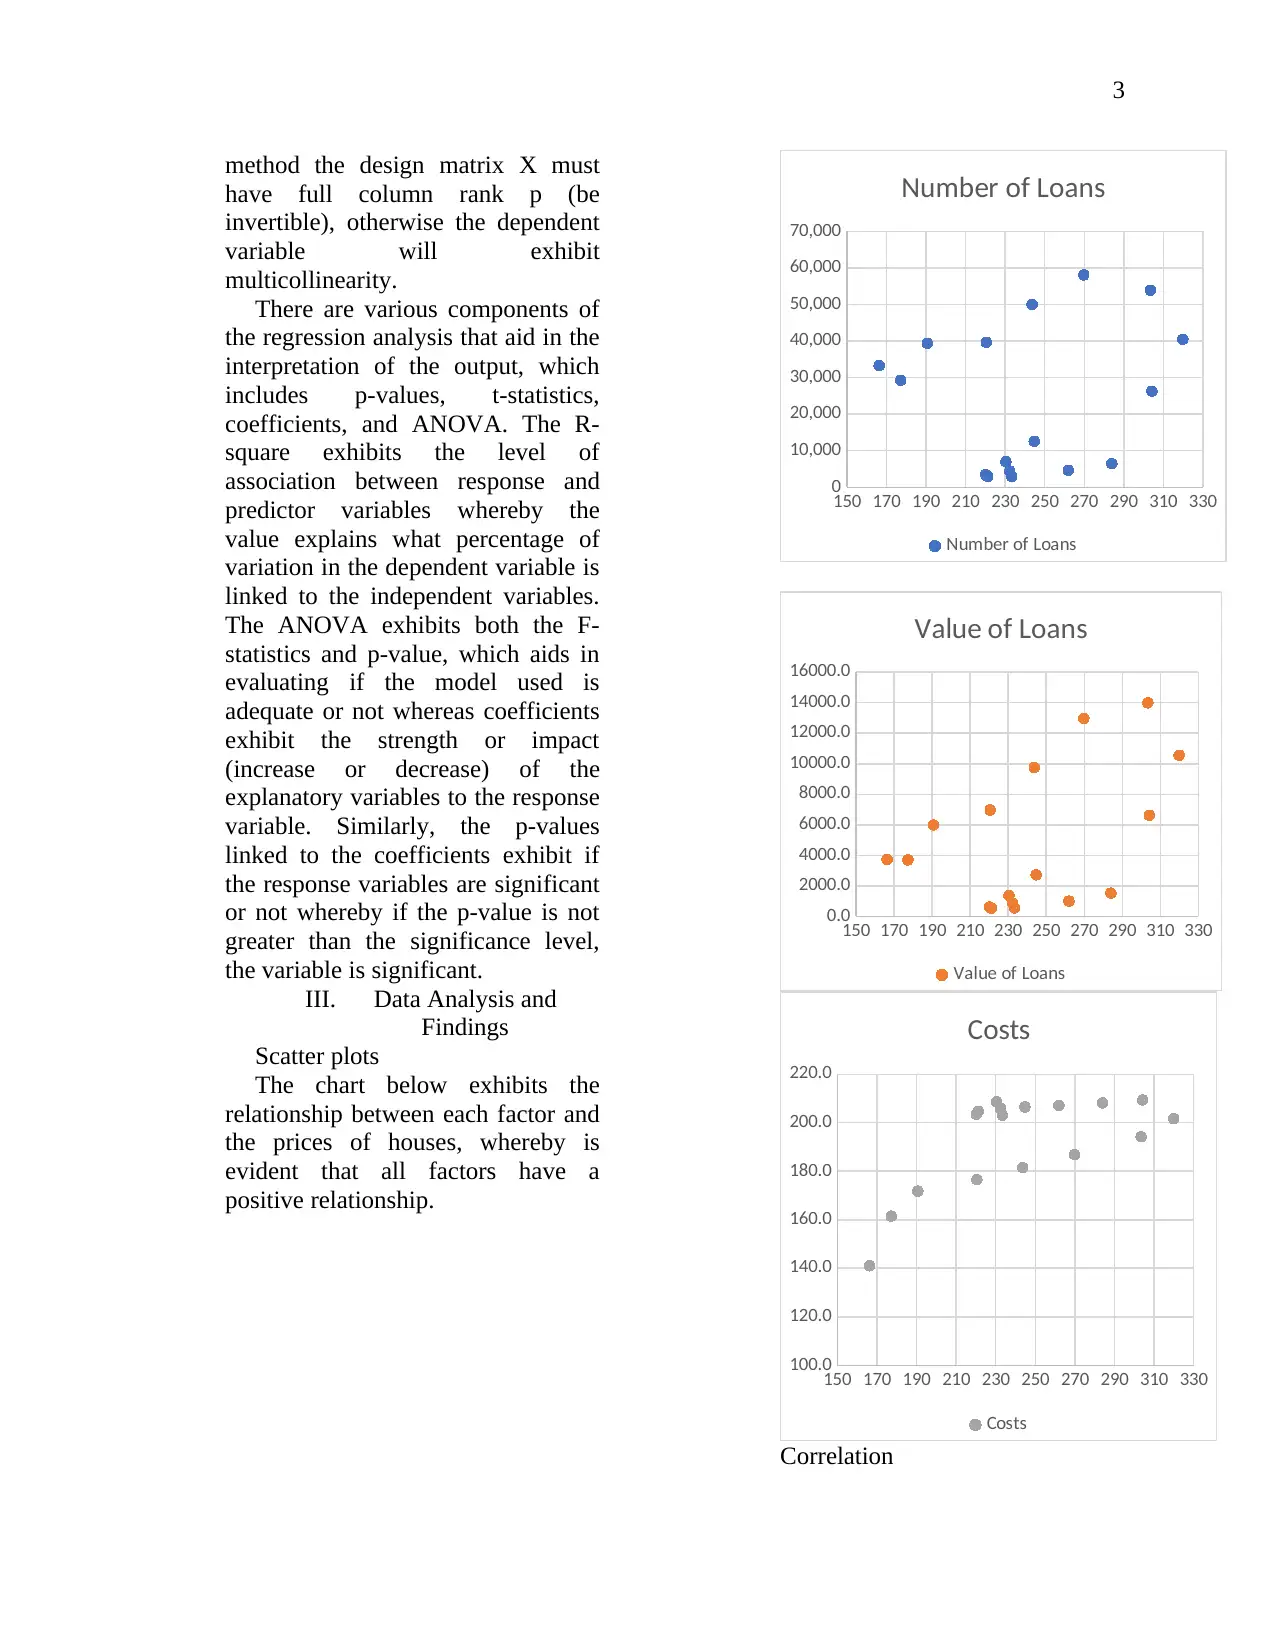
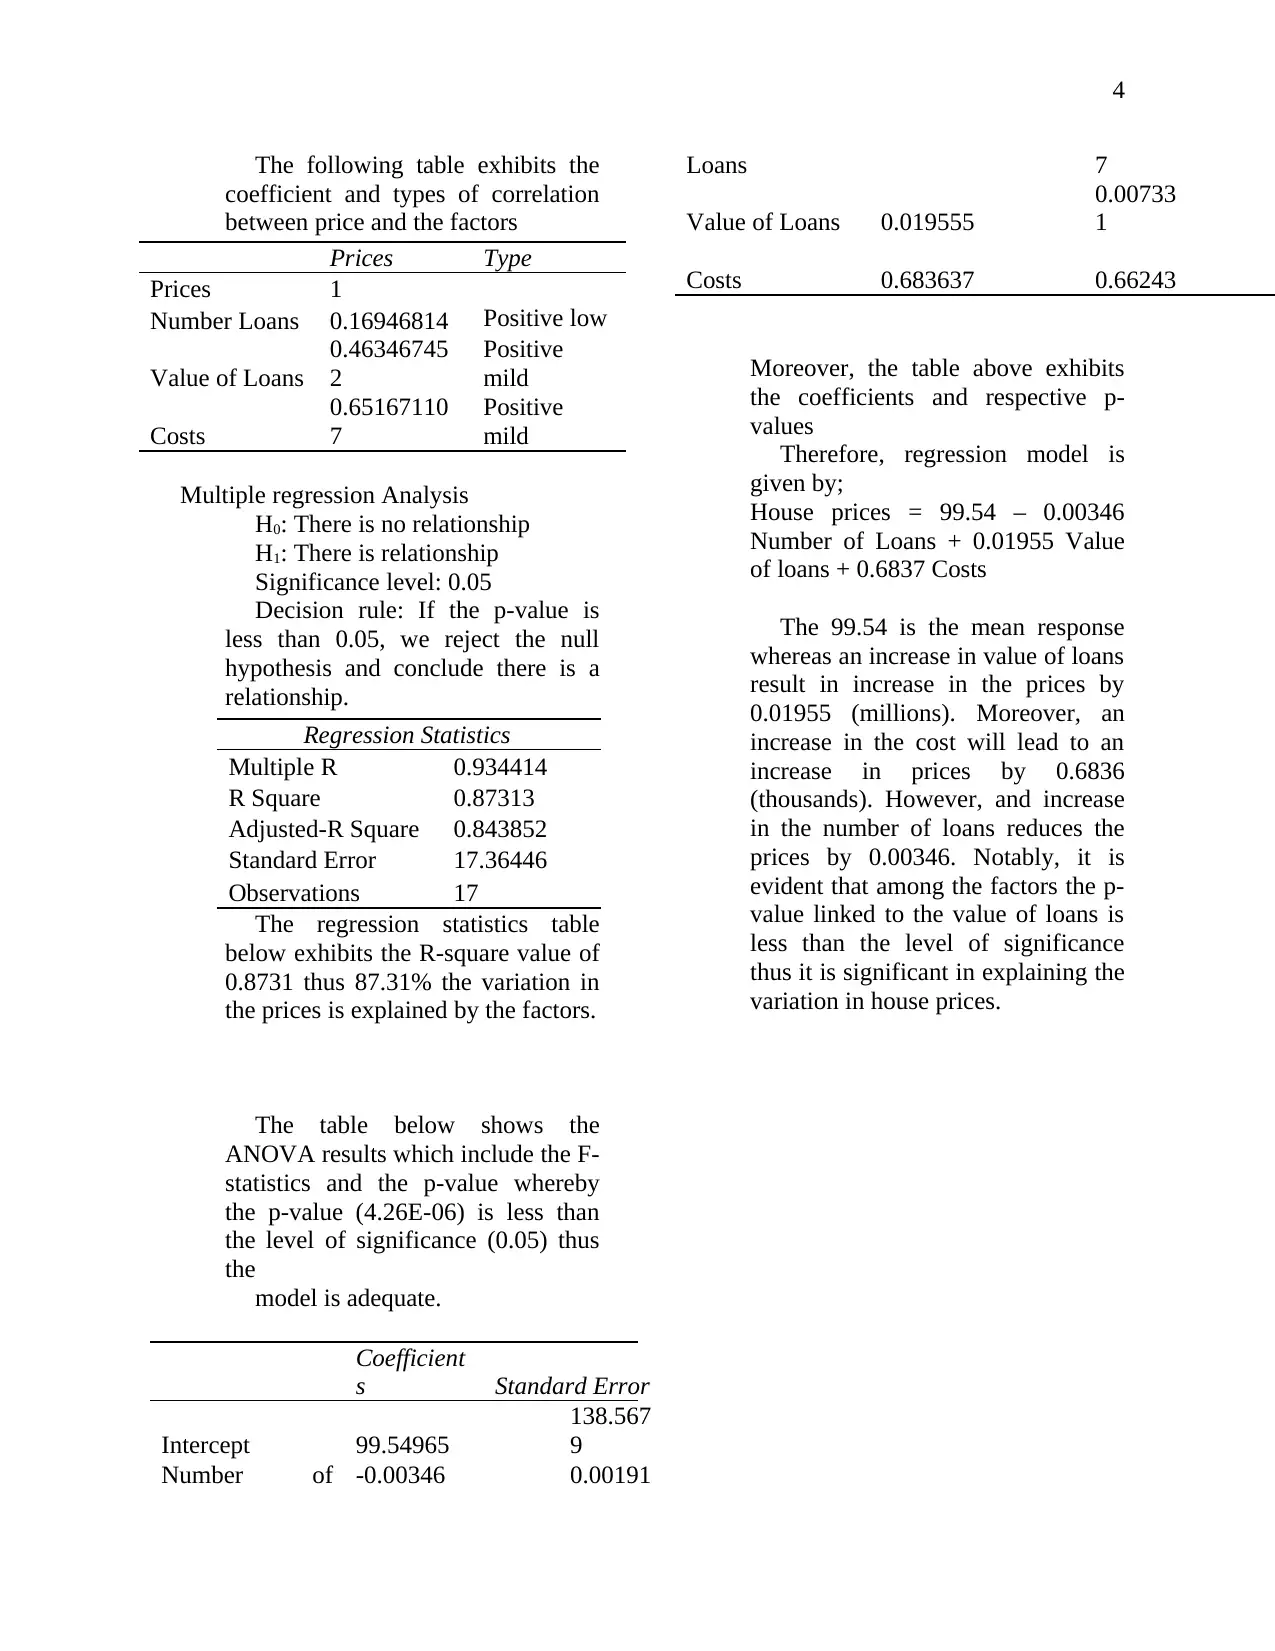
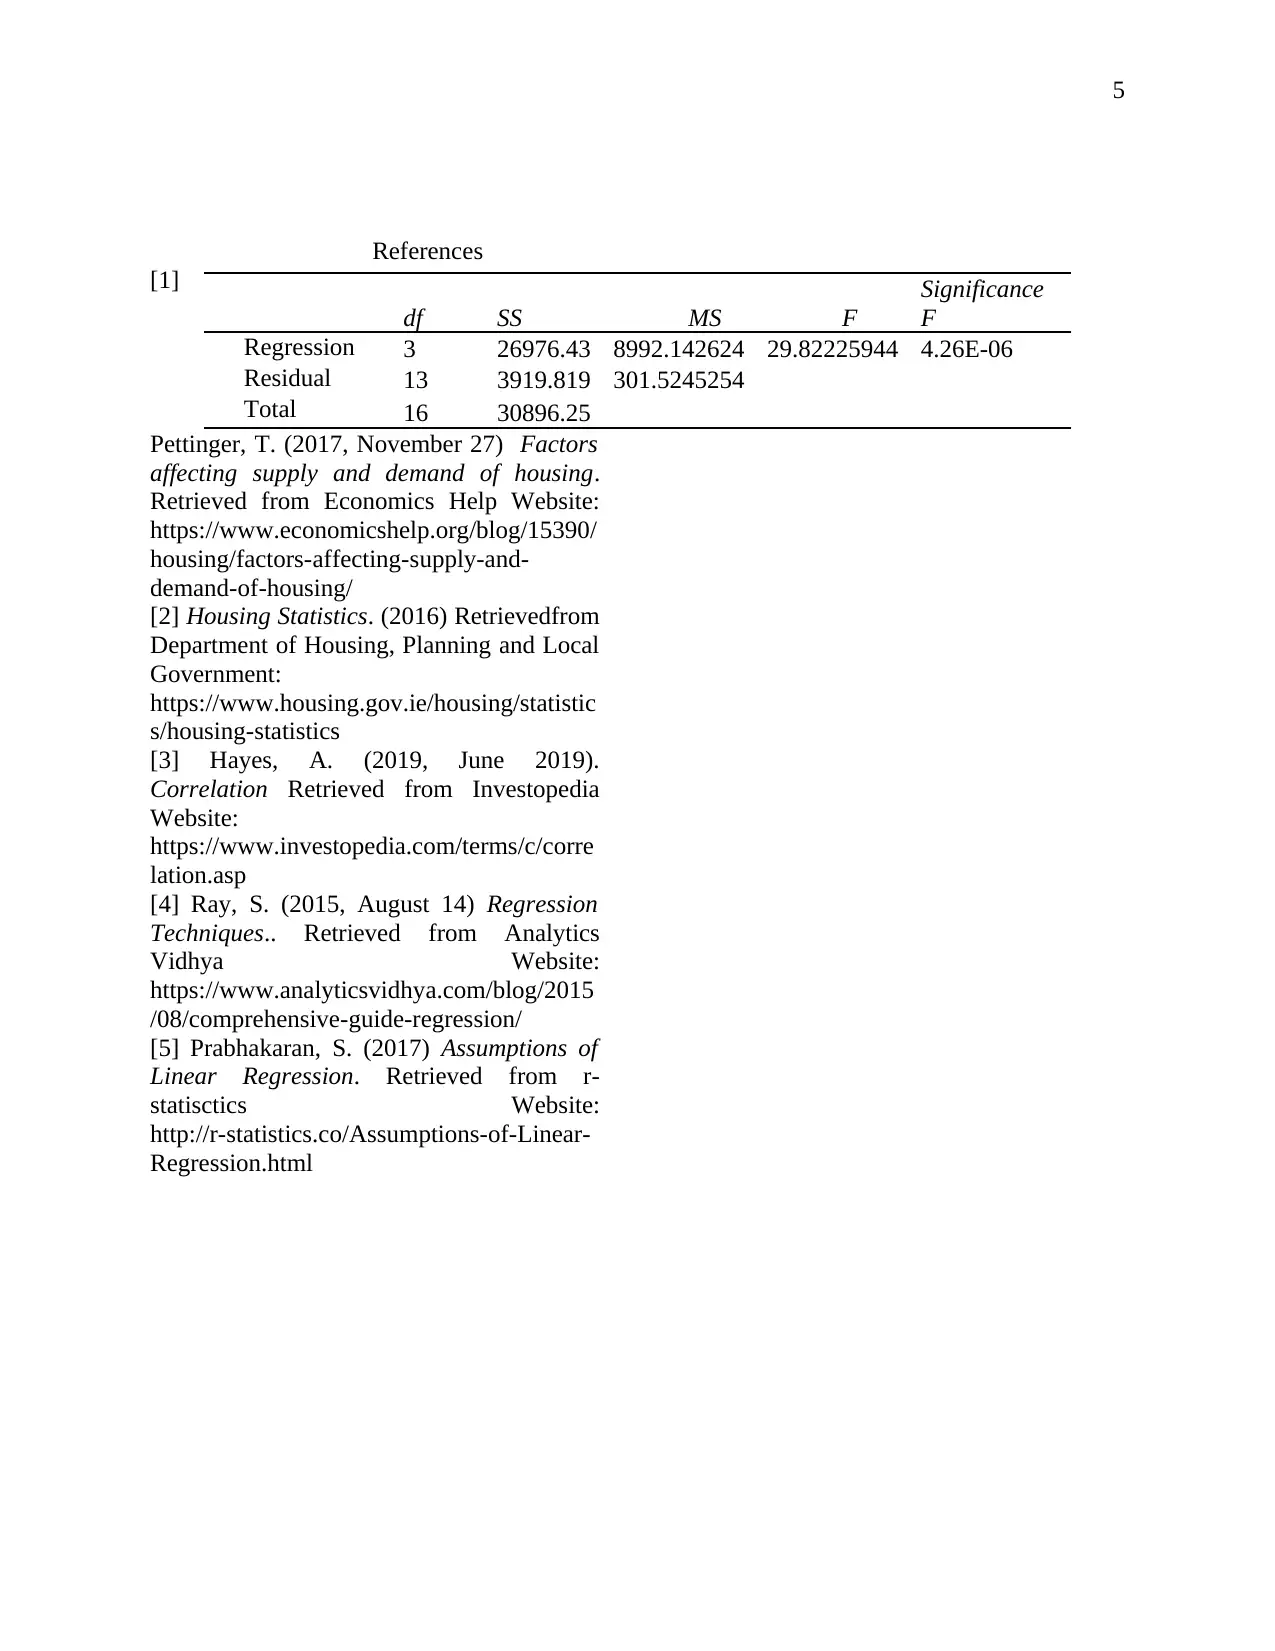
This project presents an analysis of the relationship between housing prices and various factors, including construction costs, the number and value of mortgage loans. The study utilizes a dataset from the Department of Housing of Ireland, spanning from 2000 to 2016, incorporating variables such as prices, number of loans, value of loans, and construction costs. The primary objective is to determine the impact of these factors on house prices and to provide insights for decision-making by suppliers and consumers. The methodology employed includes scatter plots, correlation analysis, and multiple regression analysis. The findings indicate a positive relationship between all factors and house prices, with a regression model developed to quantify these relationships. The analysis reveals that the value of loans significantly influences house prices. The project concludes with a regression model equation providing a predictive tool for understanding how changes in the factors affect housing prices. The R-squared value of 0.8731 suggests that the factors explain 87.31% of the variation in prices. The ANOVA results confirm the adequacy of the model, providing a valuable framework for understanding the dynamics of the housing market.

1
Abstract-The following study
seeks to exhibit the relationship
between the house prices and
various factors, which include the
cost of construction, number, and
value of mortgage loans.
Moreover, the general goal of the
research is to find the impact to
which the above factors have an
impact on the prices of houses and
how this can aid in decision
making by suppliers and
consumers at large, As a result, it
is evident that the regression
model used is adequate and factors
tend to affect the house prices.
I. Introduction
There is no doubt housing is one
of the fundamental human rights.
However, various factors tend to
affect the demand and supply of
housing, which includes economic
development, the growth of
population, availability of mortgages
(loans), cost of construction, and
affordability of housing, among
others [1]. As a result, consumers
need to understand the components
that tend to affect the prices of
houses. Therefore, the following
study seeks to exhibit the
relationship between the house prices
and various factors, which include
the cost of construction, number, and
value of mortgage loans. The data set
used in this study was sourced from
the Department of Housing of
Ireland website [2]. Notably, the
dataset incorporates five variables,
which include the year 2000 to 2016,
prices in thousands, number of loans,
the value of loans in millions, and
cost of contrition in thousands.
Goals of the project
The general goal of the research is
to find the impact to which the above
factors have an impact on the prices
of houses and how this can aid in
decision making by suppliers and
consumers at large. Moreover, the
study incorporates three specific
goals, which include finding the
magnitude of each factor on the
prices, fitting a model, and
determining the strength of
association between the factors and
the prices.
II. Strategies used
(Methodology)
A. Scatter Plot
Notably, it is essential to
incorporate various data visualizing
tool in a study to aid in exhibiting
multiple characteristics associated
with the dataset. Therefore, the study
used a scatter plot, which is a
graphical tool that displays the level
of association between variables.
Notably, a scatter plot comprises of
the X-axis, Y-axis, and a series of
dots, whereby the dots represent the
interaction between the variables
(observations).
B. Correlation
Correlation is a measure or
process that exhibits the level of
interdependence or relationship
between variables, in this case, cost
of construction, number and value of
loans approved and house prices.
Analytical CRM: Housing
Name:
Paraphrase This Document
Need a fresh take? Get an instant paraphrase of this document with our AI Paraphraser

2
The output value of the measure is
known as the correlation coefficient
ρx,y, which is found between negative
one (-1.0) and positive one (+1.0),
[3]. Notably, if the value is near to
zero (0), this exhibits minimal or
lack of interdependence between the
cases. On the other hand, if output
value is positive, it is exhibited that
an increase in a case variable leads to
an increase in the other case variable
whereas negative output variable
exhibits that an decrease in one case
variable leads to an increase in the
other case variable.
To measure the correlation
coefficient, it is essential to compute
the sum of squared values about the
mean, which include the variables
independently (XX and YY) and
interdependently (XY). Notably, in
cases whereby the variables exhibit
measurement error, it is
recommendable to use the bounds
(value) of the measure less than -1
and +1.
C. Multiple regression
It is exhibited that, the analysis
seeks to exhibit the relationship
between house prices and various
factors (cost of construction, number,
and value of loans approved).
Therefore, the adequate method to
show this relationship is the
regression model, specifically the
multiple regression model since it
incorporates numerous independent
variables. Regression is a predictive
technique that exhibits the level of
association between the explanatory
and response variables [4].
Moreover, the technique aids in
showing the significance between the
dependent and independent
variables. Notably, it is essential to
run various tests before the
involvement of regression analysis,
which includes data exploration that
exhibits the association between the
variables and comparing the
goodness of fit using numerous
metrics, such as statistical
significance, R-square, and adjusted
R-square [4]. Consequently, the
response variable should be
continuous, whereas the independent
variable can either take the form of
discrete or continuous.
Therefore, the normal equation or
function applicable to multiple
regression is shown below
Y = A + B1X1 + B2X2 + B3X3 + e
Whereby Y represent the response
variable (prices), Xs represent the
explanatory variables (cost, number,
and value of loans approved), B
represents the coefficients of the
respective explanatory variables, and
A represents the intercept (the mean
response).
Moreover, the study will
incorporate various assumptions
associated with regression, which
include normality and mean of 0 of
the error terms, and linearity of the
response variable whereby the
intercept (mean response) should
exhibit a linear combination of the
coefficients [5]. Besides, the measure
of the residual values for a given
incidence is independent of the
values of the variables in the model
and the values of the regression
residuals from other incidences.
Moreover, the regression residuals
should exhibit a constant variance
and independence of the variables in
the model. Notably, since multiple
regression will be used the
explanatory variables do not exhibit
multicollinearity whereby in a given
least-square estimation (LSE)

3
method the design matrix X must
have full column rank p (be
invertible), otherwise the dependent
variable will exhibit
multicollinearity.
There are various components of
the regression analysis that aid in the
interpretation of the output, which
includes p-values, t-statistics,
coefficients, and ANOVA. The R-
square exhibits the level of
association between response and
predictor variables whereby the
value explains what percentage of
variation in the dependent variable is
linked to the independent variables.
The ANOVA exhibits both the F-
statistics and p-value, which aids in
evaluating if the model used is
adequate or not whereas coefficients
exhibit the strength or impact
(increase or decrease) of the
explanatory variables to the response
variable. Similarly, the p-values
linked to the coefficients exhibit if
the response variables are significant
or not whereby if the p-value is not
greater than the significance level,
the variable is significant.
III. Data Analysis and
Findings
Scatter plots
The chart below exhibits the
relationship between each factor and
the prices of houses, whereby is
evident that all factors have a
positive relationship.
150 170 190 210 230 250 270 290 310 330
0
10,000
20,000
30,000
40,000
50,000
60,000
70,000
Number of Loans
Number of Loans
150 170 190 210 230 250 270 290 310 330
0.0
2000.0
4000.0
6000.0
8000.0
10000.0
12000.0
14000.0
16000.0
Value of Loans
Value of Loans
150 170 190 210 230 250 270 290 310 330
100.0
120.0
140.0
160.0
180.0
200.0
220.0
Costs
Costs
Correlation
⊘ This is a preview!⊘
Do you want full access?
Subscribe today to unlock all pages.

Trusted by 1+ million students worldwide

4
The following table exhibits the
coefficient and types of correlation
between price and the factors
Multiple regression Analysis
H0: There is no relationship
H1: There is relationship
Significance level: 0.05
Decision rule: If the p-value is
less than 0.05, we reject the null
hypothesis and conclude there is a
relationship.
The regression statistics table
below exhibits the R-square value of
0.8731 thus 87.31% the variation in
the prices is explained by the factors.
The table below shows the
ANOVA results which include the F-
statistics and the p-value whereby
the p-value (4.26E-06) is less than
the level of significance (0.05) thus
the
model is adequate.
Coefficient
s Standard Error
Intercept 99.54965
138.567
9
Number of -0.00346 0.00191
Loans 7
Value of Loans 0.019555
0.00733
1
Costs 0.683637 0.66243
Moreover, the table above exhibits
the coefficients and respective p-
values
Therefore, regression model is
given by;
House prices = 99.54 – 0.00346
Number of Loans + 0.01955 Value
of loans + 0.6837 Costs
The 99.54 is the mean response
whereas an increase in value of loans
result in increase in the prices by
0.01955 (millions). Moreover, an
increase in the cost will lead to an
increase in prices by 0.6836
(thousands). However, and increase
in the number of loans reduces the
prices by 0.00346. Notably, it is
evident that among the factors the p-
value linked to the value of loans is
less than the level of significance
thus it is significant in explaining the
variation in house prices.
Prices Type
Prices 1
Number Loans 0.16946814 Positive low
Value of Loans
0.46346745
2
Positive
mild
Costs
0.65167110
7
Positive
mild
Regression Statistics
Multiple R 0.934414
R Square 0.87313
Adjusted-R Square 0.843852
Standard Error 17.36446
Observations 17
Paraphrase This Document
Need a fresh take? Get an instant paraphrase of this document with our AI Paraphraser

5
References
[1]
Pettinger, T. (2017, November 27) Factors
affecting supply and demand of housing.
Retrieved from Economics Help Website:
https://www.economicshelp.org/blog/15390/
housing/factors-affecting-supply-and-
demand-of-housing/
[2] Housing Statistics. (2016) Retrievedfrom
Department of Housing, Planning and Local
Government:
https://www.housing.gov.ie/housing/statistic
s/housing-statistics
[3] Hayes, A. (2019, June 2019).
Correlation Retrieved from Investopedia
Website:
https://www.investopedia.com/terms/c/corre
lation.asp
[4] Ray, S. (2015, August 14) Regression
Techniques.. Retrieved from Analytics
Vidhya Website:
https://www.analyticsvidhya.com/blog/2015
/08/comprehensive-guide-regression/
[5] Prabhakaran, S. (2017) Assumptions of
Linear Regression. Retrieved from r-
statisctics Website:
http://r-statistics.co/Assumptions-of-Linear-
Regression.html
df SS MS F
Significance
F
Regression 3 26976.43 8992.142624 29.82225944 4.26E-06
Residual 13 3919.819 301.5245254
Total 16 30896.25
1 out of 5
Related Documents

Your All-in-One AI-Powered Toolkit for Academic Success.
+13062052269
info@desklib.com
Available 24*7 on WhatsApp / Email
Unlock your academic potential
Copyright © 2020–2025 A2Z Services. All Rights Reserved. Developed and managed by ZUCOL.