Detailed Finance Report: Assessment 1 and 2 for Houzit Pty Ltd
VerifiedAdded on 2023/06/09
|16
|3519
|483
Report
AI Summary
This report provides a comprehensive analysis of financial data for Houzit Pty Ltd, encompassing two assessments. Assessment 1 focuses on sales and profit budgets, cash flow analysis, and aged debtor schedules, providing detailed breakdowns of sales percentages, GST calculations, and debtor aging. It also addresses key financial concepts such as income tax, corporate regulations, accounting software, and the matching principle, offering insights into probity, risk management, and potential improvements to enhance financial performance. Assessment 2 delves into budget variances, comparing actual results to the budget across various financial metrics, including sales, cost of goods sold, and various expense categories, providing a detailed variance analysis and highlighting areas of over and underperformance. This report includes tables and analysis to provide a clear understanding of the company's financial position and performance.
Running head: MANAGE FINANCE
Manage Finance
Name of the Student:
Name of the University:
Authors Note:
Manage Finance
Name of the Student:
Name of the University:
Authors Note:
Paraphrase This Document
Need a fresh take? Get an instant paraphrase of this document with our AI Paraphraser
1MANAGE FINANCE
Table of Contents
Assessment 1...................................................................................................................................2
Sales and Profit Budget...................................................................................................................2
Answer to Question 1:.....................................................................................................................6
Answer to Question 2:.....................................................................................................................6
Answer to Question 3:.....................................................................................................................7
Answer to Question 4:.....................................................................................................................7
Answer to Question 5:.....................................................................................................................8
Answer to Question 6:.....................................................................................................................8
Answer to Question 7:.....................................................................................................................9
Answer to Question 8:.....................................................................................................................9
Assessment 2.................................................................................................................................10
Budget Variance............................................................................................................................10
Debtors ageing ratio.......................................................................................................................12
Reference.......................................................................................................................................13
2MANAGE FINANCE
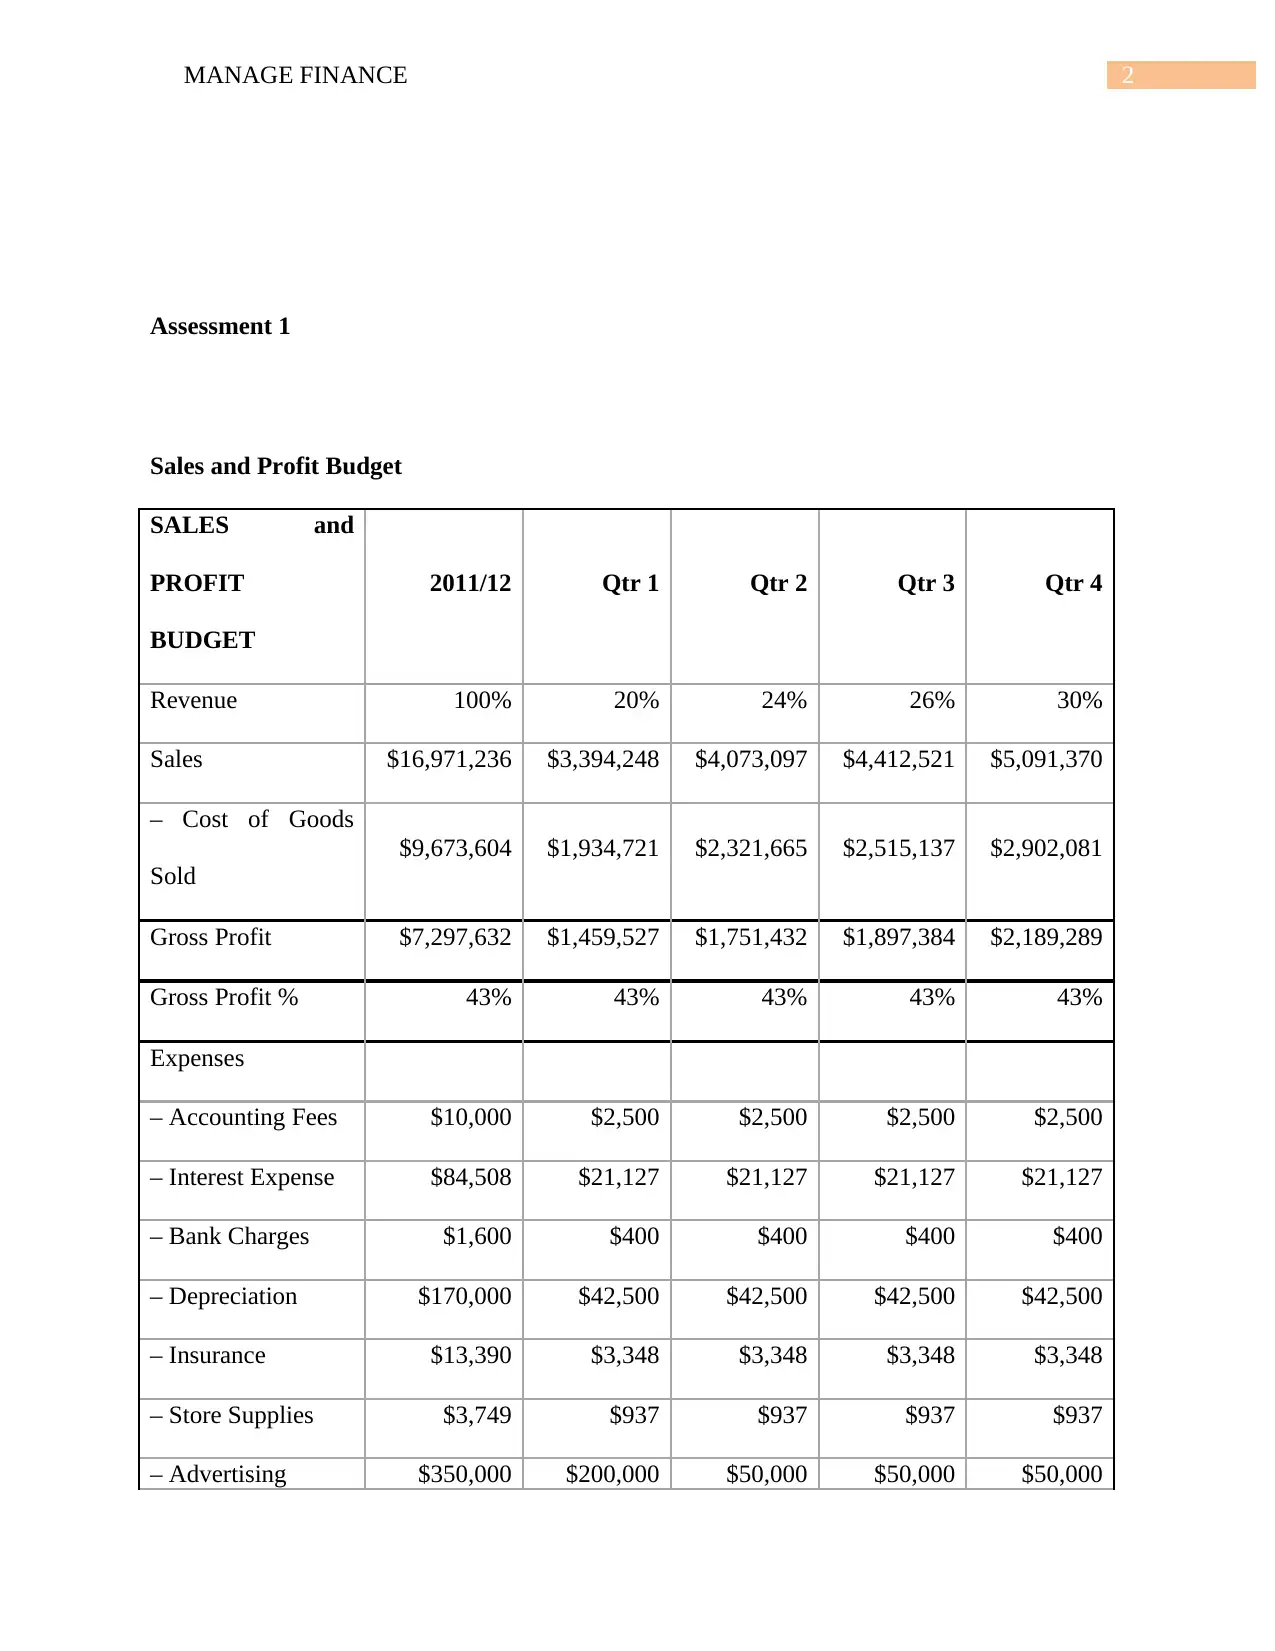
Assessment 1
Sales and Profit Budget
SALES and
PROFIT
BUDGET
2011/12 Qtr 1 Qtr 2 Qtr 3 Qtr 4
Revenue 100% 20% 24% 26% 30%
Sales $16,971,236 $3,394,248 $4,073,097 $4,412,521 $5,091,370
– Cost of Goods
Sold
$9,673,604 $1,934,721 $2,321,665 $2,515,137 $2,902,081
Gross Profit $7,297,632 $1,459,527 $1,751,432 $1,897,384 $2,189,289
Gross Profit % 43% 43% 43% 43% 43%
Expenses
– Accounting Fees $10,000 $2,500 $2,500 $2,500 $2,500
– Interest Expense $84,508 $21,127 $21,127 $21,127 $21,127
– Bank Charges $1,600 $400 $400 $400 $400
– Depreciation $170,000 $42,500 $42,500 $42,500 $42,500
– Insurance $13,390 $3,348 $3,348 $3,348 $3,348
– Store Supplies $3,749 $937 $937 $937 $937
– Advertising $350,000 $200,000 $50,000 $50,000 $50,000
⊘ This is a preview!⊘
Do you want full access?
Subscribe today to unlock all pages.
Trusted by 1+ million students worldwide
3MANAGE FINANCE
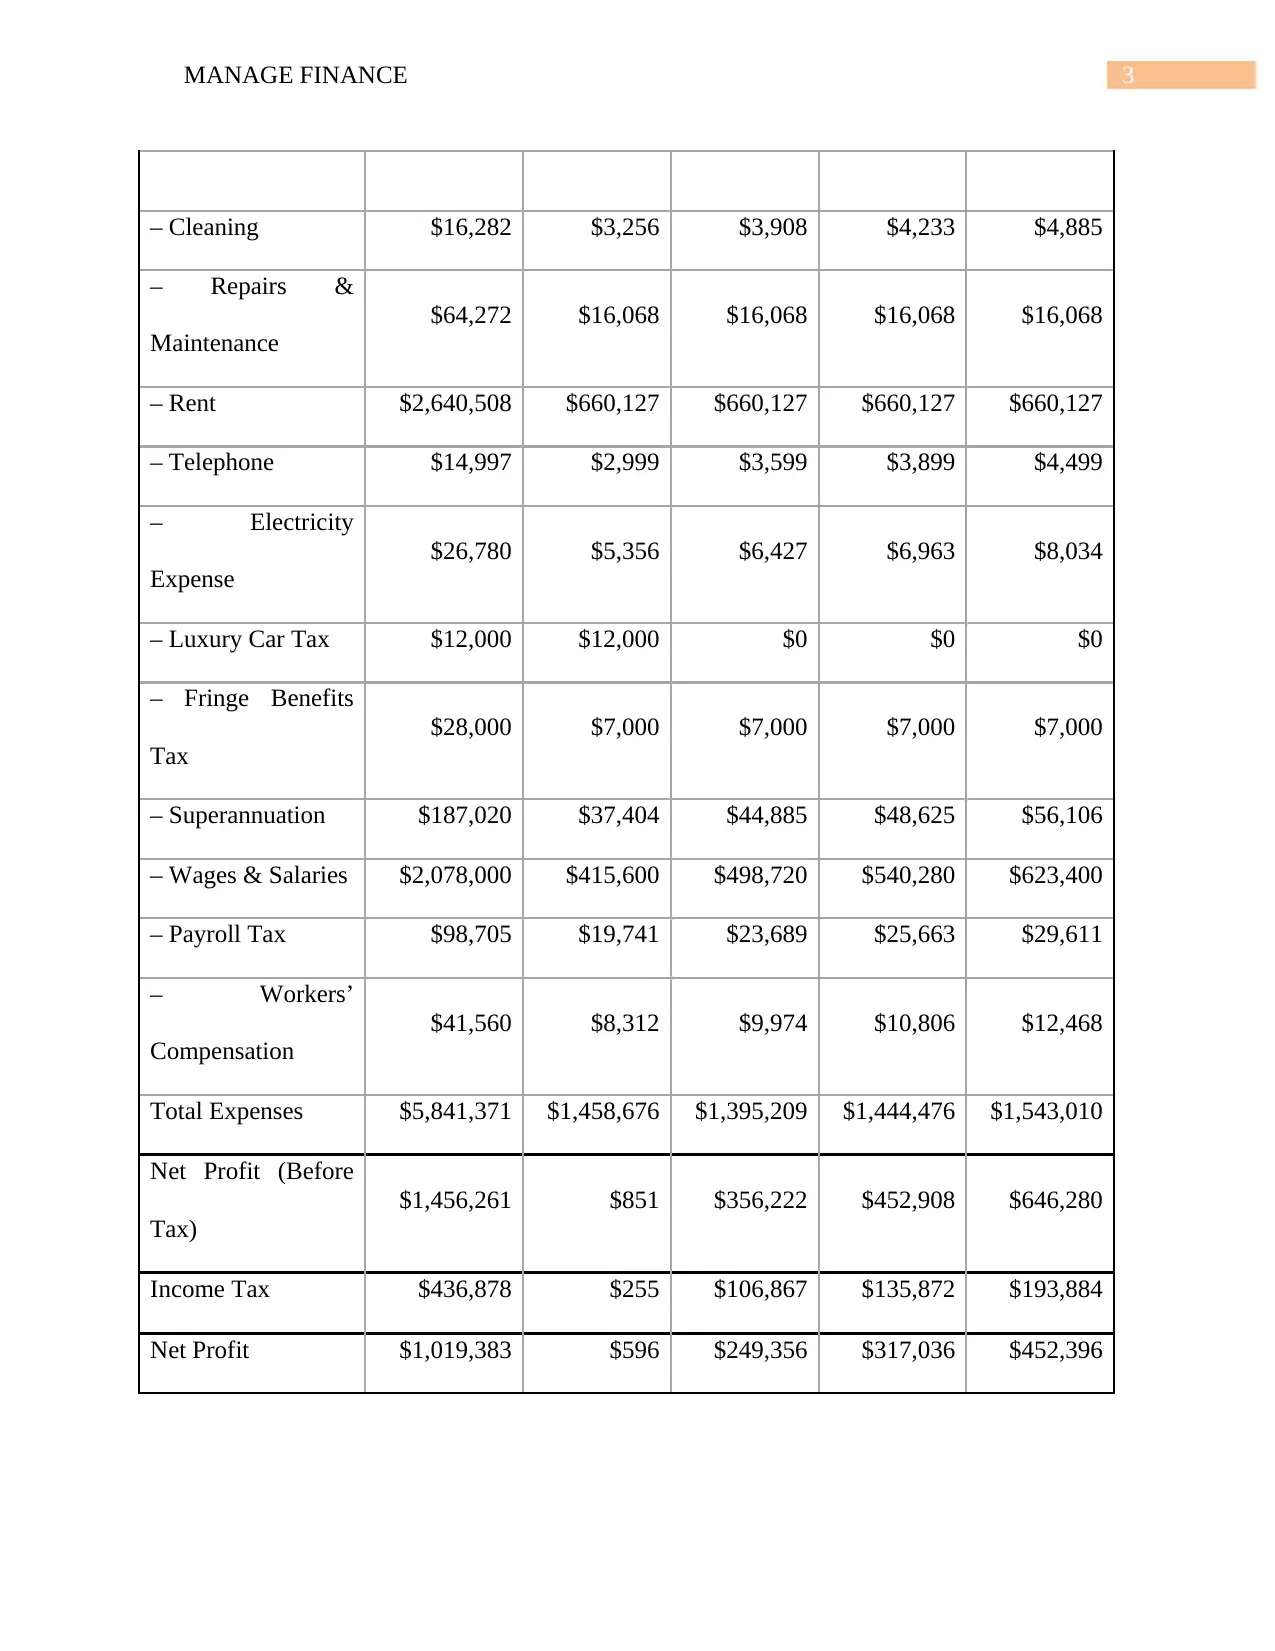
– Cleaning $16,282 $3,256 $3,908 $4,233 $4,885
– Repairs &
Maintenance
$64,272 $16,068 $16,068 $16,068 $16,068
– Rent $2,640,508 $660,127 $660,127 $660,127 $660,127
– Telephone $14,997 $2,999 $3,599 $3,899 $4,499
– Electricity
Expense
$26,780 $5,356 $6,427 $6,963 $8,034
– Luxury Car Tax $12,000 $12,000 $0 $0 $0
– Fringe Benefits
Tax
$28,000 $7,000 $7,000 $7,000 $7,000
– Superannuation $187,020 $37,404 $44,885 $48,625 $56,106
– Wages & Salaries $2,078,000 $415,600 $498,720 $540,280 $623,400
– Payroll Tax $98,705 $19,741 $23,689 $25,663 $29,611
– Workers’
Compensation
$41,560 $8,312 $9,974 $10,806 $12,468
Total Expenses $5,841,371 $1,458,676 $1,395,209 $1,444,476 $1,543,010
Net Profit (Before
Tax)
$1,456,261 $851 $356,222 $452,908 $646,280
Income Tax $436,878 $255 $106,867 $135,872 $193,884
Net Profit $1,019,383 $596 $249,356 $317,036 $452,396
Paraphrase This Document
Need a fresh take? Get an instant paraphrase of this document with our AI Paraphraser
4MANAGE FINANCE
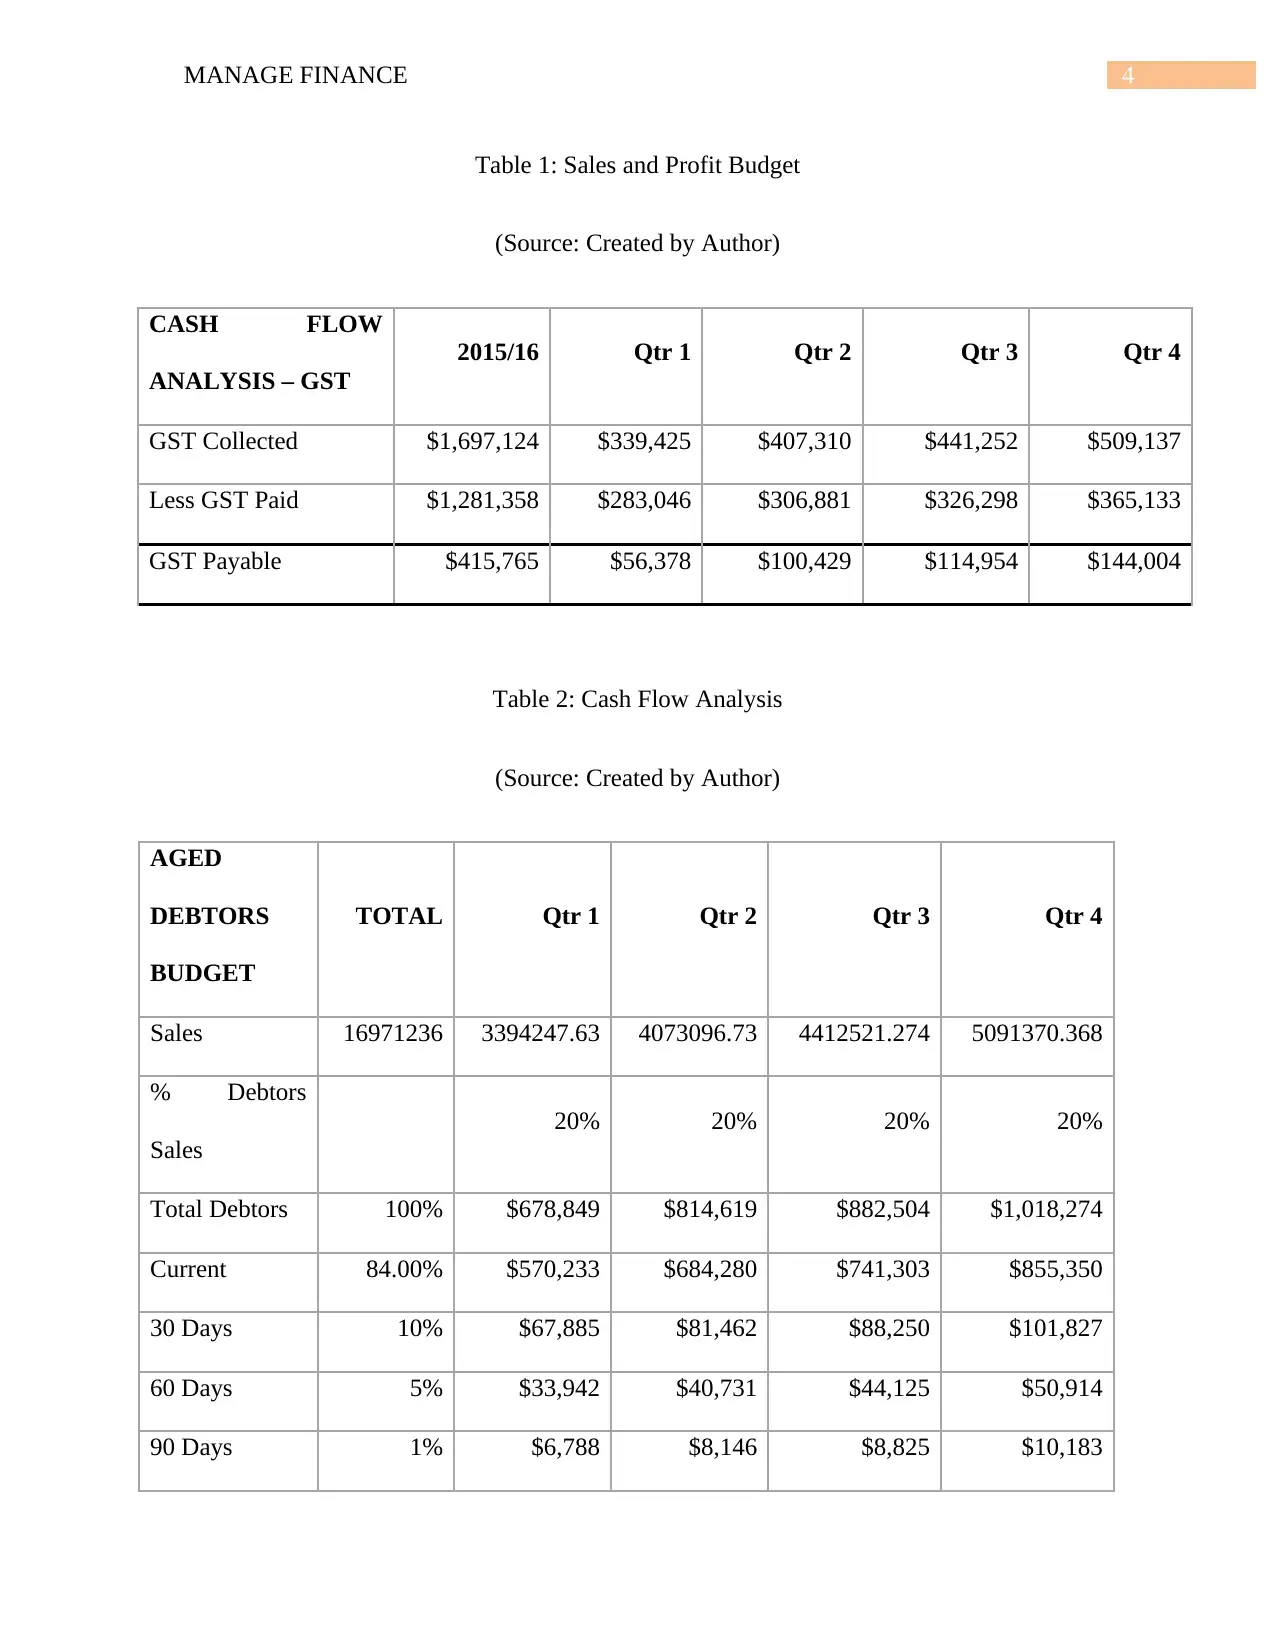
Table 1: Sales and Profit Budget
(Source: Created by Author)
CASH FLOW
ANALYSIS – GST
2015/16 Qtr 1 Qtr 2 Qtr 3 Qtr 4
GST Collected $1,697,124 $339,425 $407,310 $441,252 $509,137
Less GST Paid $1,281,358 $283,046 $306,881 $326,298 $365,133
GST Payable $415,765 $56,378 $100,429 $114,954 $144,004
Table 2: Cash Flow Analysis
(Source: Created by Author)
AGED
DEBTORS
BUDGET
TOTAL Qtr 1 Qtr 2 Qtr 3 Qtr 4
Sales 16971236 3394247.63 4073096.73 4412521.274 5091370.368
% Debtors
Sales
20% 20% 20% 20%
Total Debtors 100% $678,849 $814,619 $882,504 $1,018,274
Current 84.00% $570,233 $684,280 $741,303 $855,350
30 Days 10% $67,885 $81,462 $88,250 $101,827
60 Days 5% $33,942 $40,731 $44,125 $50,914
90 Days 1% $6,788 $8,146 $8,825 $10,183
5MANAGE FINANCE
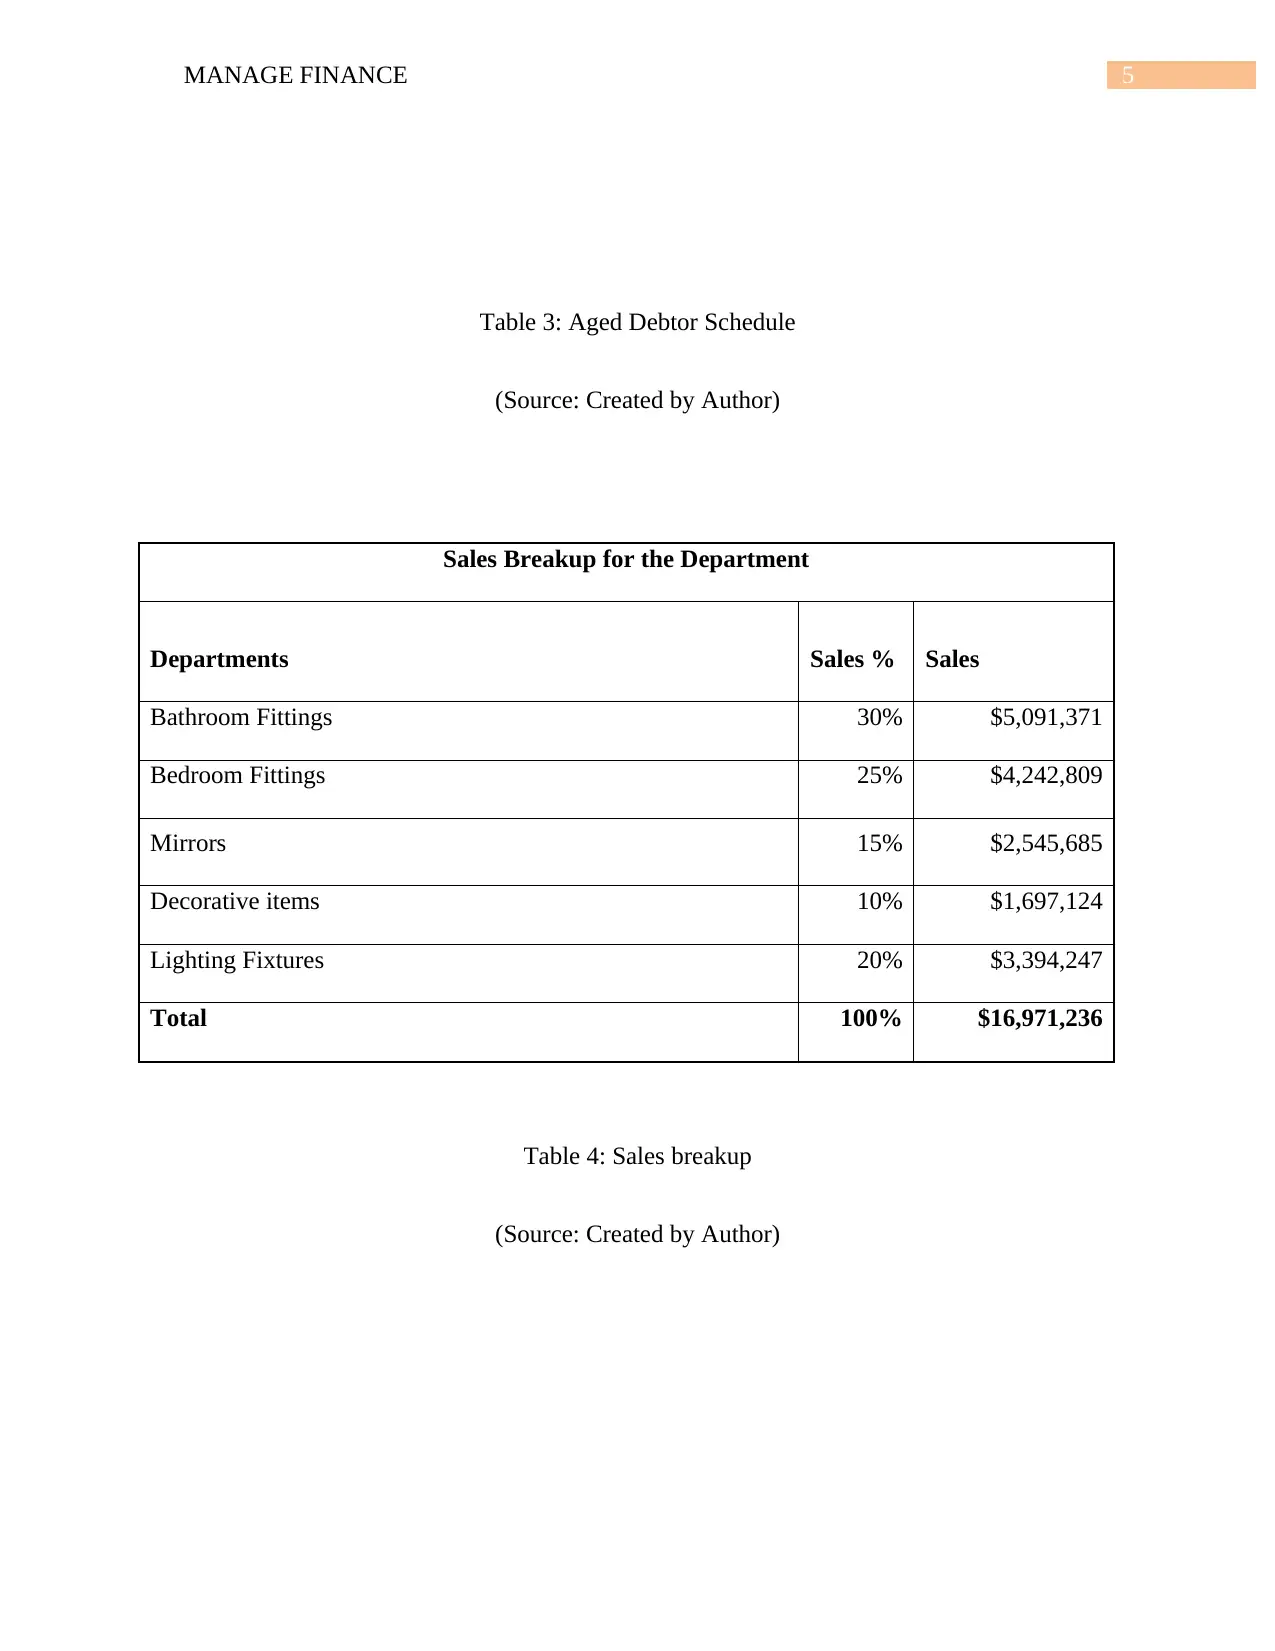
Table 3: Aged Debtor Schedule
(Source: Created by Author)
Sales Breakup for the Department
Departments Sales % Sales
Bathroom Fittings 30% $5,091,371
Bedroom Fittings 25% $4,242,809
Mirrors 15% $2,545,685
Decorative items 10% $1,697,124
Lighting Fixtures 20% $3,394,247
Total 100% $16,971,236
Table 4: Sales breakup
(Source: Created by Author)
⊘ This is a preview!⊘
Do you want full access?
Subscribe today to unlock all pages.
Trusted by 1+ million students worldwide
6MANAGE FINANCE
Answer to Question 1:
According to the Income Tax Assessment Act 1997, a company has to pay taxes for their
taxable income allocated to them by the Act. In the case of Houzit Pty Ltd, the amount of tax
allocated to them is quite big in figures. After preparing the financial budget of the company, it
has to pay the income or capital gain tax to the income tax department. The tax that is allocated
to the company is 30% of their profit. In such scenario, the company also has to imply some
provisions along with the GST Act, as it is mandatory. GST is mandatory to claim input tax
credit for the payment of the suppliers (Cucchiella et al., 2015). In addition to this, another
important and mandatory requirement for tax compliance is to file Income Tax return to identify
income and deduction. Some other reports that the company has to prepare are business activity
statement, GST annual return, PAYG withholding annual reports and tax payments and returns.
Answer to Question 2:
As par the Corporation Act, 2001, companies which are registered under this act, has to
fulfil various requirements stated in that act in order to continue business (DiMuro et al., 2014).
It is mandatory to follow the regulations issued by the government in order to perform the tasks
of the company. Some of those regulations are:-
One resident of Australia should be in the directorial bodies of the company.
Registered office and a permanent postal address are mandatory for the company.
Financial statement of the company should be recorded.
In case of substituting any board member of the company, it should notify the Australian
society about the affair.
Paraphrase This Document
Need a fresh take? Get an instant paraphrase of this document with our AI Paraphraser
7MANAGE FINANCE
Answer to Question 3:
Nowadays, as the electronics technology is progressing in a rapid speed, it is very
common to get an electronic assistance to make a task easier. As for accounting, there are several
good accounting software to help in the task of accounting. However, as far as usability and
affordability is concerned, two most popular accounting software available in Australia are
MYOB and Quick Book. MYOB is likely to be popular for its low price, presenting, and
preparing the required task for financial management (Nesticò & Pipolo, 2015). The security
level of MYOB regarding the encryption of data is also up to dated. However, Quick Book can
provide more analyzed data based on the financial statement of the company regarding the
management tasks. It also works well both in online and offline format. It also makes the
company up to date by providing regular updates regarding the development taxes. Thus, the
software suits the best according to the needs of the company.
Answer to Question 4:
The term matching principle means to keep tracks of all the expenses and revenues at the
same time in order to match them within the specific period of time. It is a major point to be
observed responsibly in order to monitor the financial condition of the business. It is required to
record all the expenses made in order to track the overall condition. The data can be used while
making the financial statement of the company and thus, the upcoming planning for the business
can be decided easily with a chance of less error (Rai & Evans, 2015). Thus, some problems
regarding the funding can easily be solved by implementing this method. It is also helpful to
keep the lucidity of the company.
Account group means a group of accounting items recorded as a whole. This makes
accounting easier to identify certain areas of the business by analysing those groups instead of
8MANAGE FINANCE
going through the entire financial statement. This is more time saving and effective in order to
make better analysis of a business.
Time of preparing a budget is very essential as it determines the effectiveness of the
budget. Budget can be made in two time periods, one is short term budget and the other is short
term budget. While long-term budget is made for stating the financial changes the company has
made, short-term budget is used for framing the long-term budget and analysis the error and
mistakes so that it can be compensated in the near future (Shouman et al., 2016). The short-term
budget can be the basis of the long-term budget as it is more reliable than the long term budget.
Answer to Question 5:
Probity is a term to describe the act of doing a job with sincerity, honesty and
willingness. It is mandatory to maintain probity while preparing the financial statement and
budget. To maintain the lucidity and truthfulness of the budget, it is highly recommended to
maintain the same amount of probity from start to end. These decrease the chances of any error
and mistakes while preparing the budget (Słyś & Kordana, 2014). To maintain the probity while
preparing the budget, proper analysis, honest and thoughtful examination should be done.
Answer to Question 6:
Regarding the past affairs in the statement of Houzit Pty Ltd, it seems necessary to make
some improvements in certain sector of the company in order to generate resources in the next
financial cycle. There can be three possible steps to make the business more successful. Which
are:-
Reducing the rate of gross profit by 0.9% will help the company to keep up with the
steady growth in sales.
⊘ This is a preview!⊘
Do you want full access?
Subscribe today to unlock all pages.
Trusted by 1+ million students worldwide
9MANAGE FINANCE
To generate the demand in market more effectively, the company may increase the
advertisement budget.
Some extension to the salaries and wages budget will surely motivate the employees of
the company to earn more commissions in sales, which will surely help to reach the
company its sales target.
Answer to Question 7:
Apart from the items, which has been shown in the budget of Houzit Pty Ltd, there are,
some other items which be included and proved beneficial to the company. These are:-
The loans should be paid in time to get rid of the expenditure of paying additional
interest.
The discount given by the company can be reduced to a certain percentage in order to rise
the net profit.
The payroll system can be improved in order to keep exact account of the salary and
wages budget. This can reduce additional costs regarding the expenses.
Answer to Question 8:
Risk management is a very important task to do for a management team of the company in order
to secure the purpose of it. Thus, some additional modification is required to manage the risks in
a more efficient manner (Vogel, 2014). As for Houzit Pty Ltd, following suggestions can be
granted in order to manage the risks from various aspects.
The customers’ base should be secured in a more dignified manner in order to measure
the demands in the market more effectively.
Paraphrase This Document
Need a fresh take? Get an instant paraphrase of this document with our AI Paraphraser
10MANAGE FINANCE
The discounts given should be reflected in the invoices given to its clients estimate it
properly in the later budget.
The cash balance should be verified after every specific period of time to get rid of the
treachery.
It should be ensured that the workers are being paid after completing the work given to
them. It is the duty of the service manager to keep monitoring about the workers and the
work done by them.
The assets should be identified with the unique code to keep track to them.
Debtors balance should be settled within a specific period of time.
It must be accounted about the newly employed workers and the quitters in order to
maintain the clarity in the payroll system. Sometimes, the supervisors are responsible for
making error in the payroll for their own benefits (Vittorini & Cipollone, 2016).
An individual person should do the reconciliation of cash balance so that the lucidity in
accounting can be maintained well.
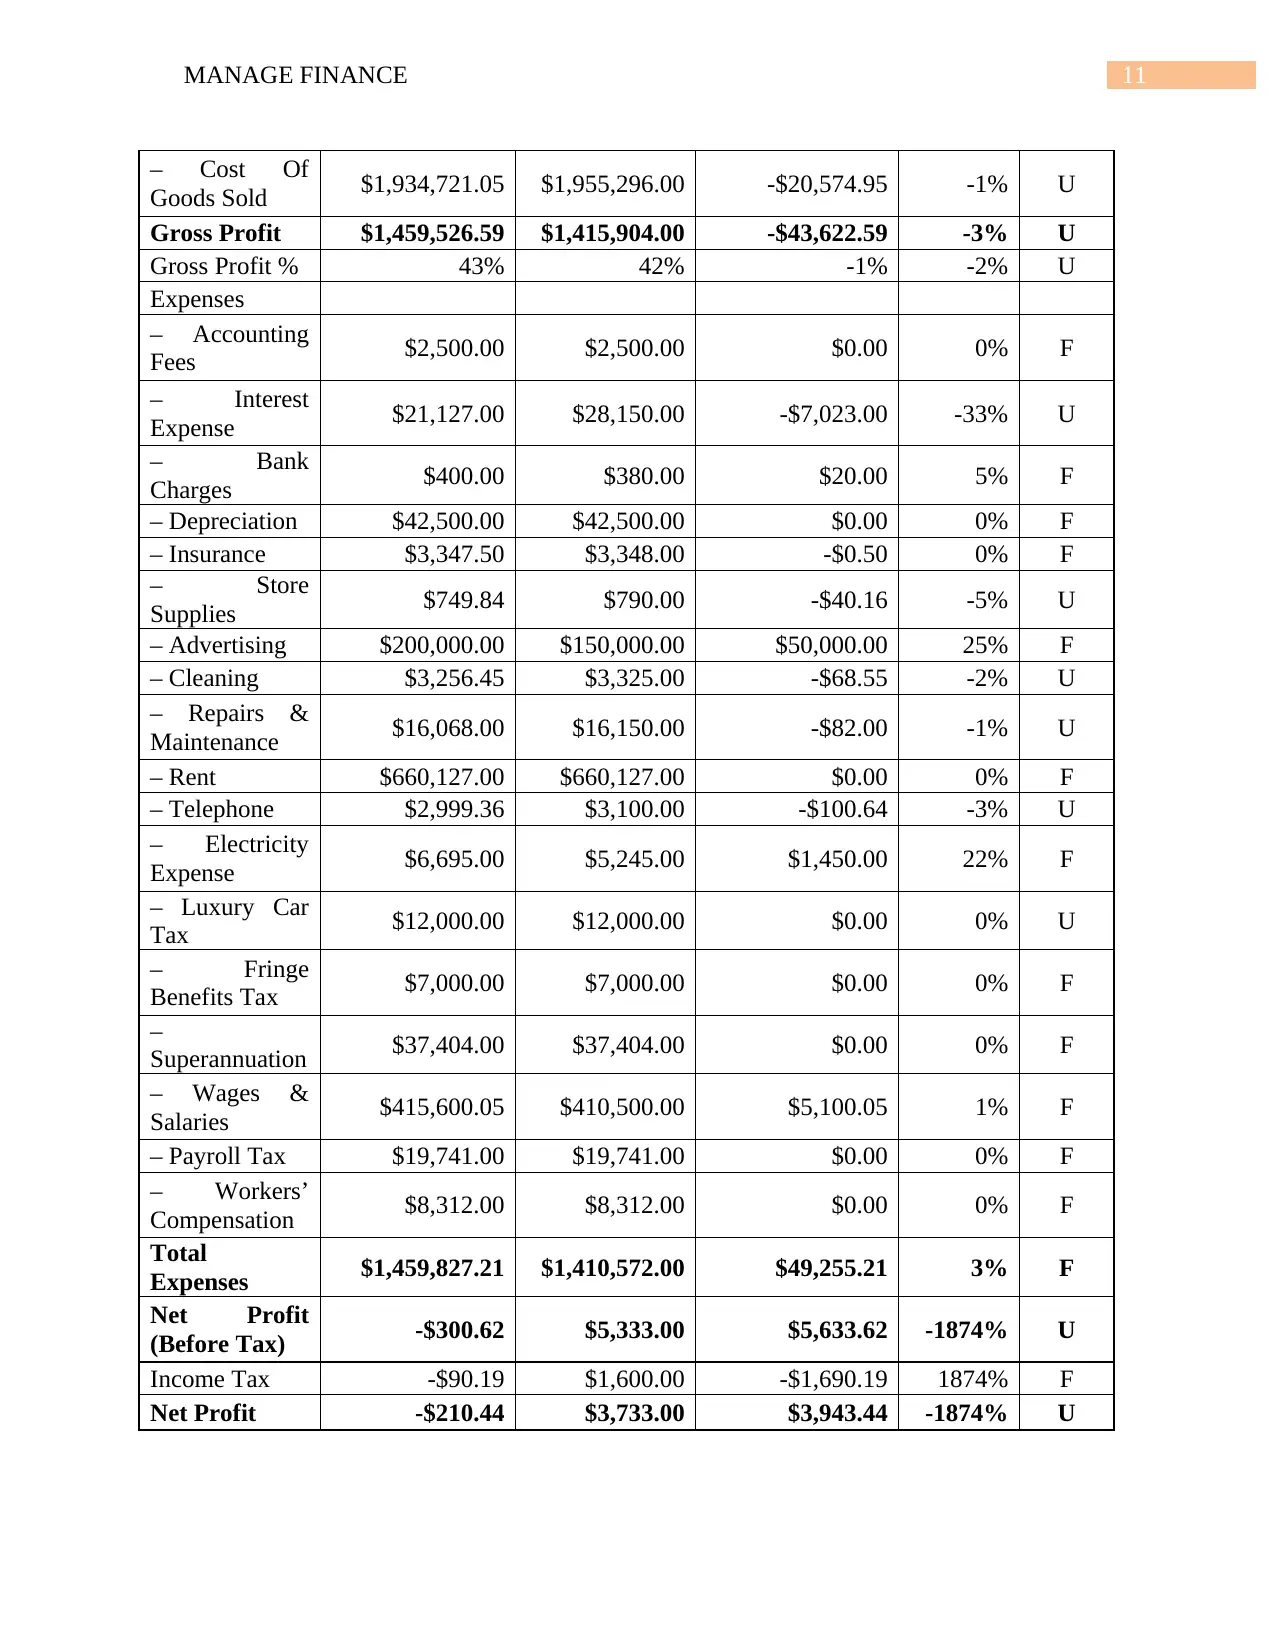
Assessment 2
Budget Variance
Houzit Pty Ltd
Variance to Budget
1 Quarter ended September-2015
Actual Results Budget-Qx Actual-Qx $ %
Variance F or U
Variance
Sales $3,394,247.63 $3,371,200.00 -$23,047.63 -1% U
The discounts given should be reflected in the invoices given to its clients estimate it
properly in the later budget.
The cash balance should be verified after every specific period of time to get rid of the
treachery.
It should be ensured that the workers are being paid after completing the work given to
them. It is the duty of the service manager to keep monitoring about the workers and the
work done by them.
The assets should be identified with the unique code to keep track to them.
Debtors balance should be settled within a specific period of time.
It must be accounted about the newly employed workers and the quitters in order to
maintain the clarity in the payroll system. Sometimes, the supervisors are responsible for
making error in the payroll for their own benefits (Vittorini & Cipollone, 2016).
An individual person should do the reconciliation of cash balance so that the lucidity in
accounting can be maintained well.
Assessment 2
Budget Variance
Houzit Pty Ltd
Variance to Budget
1 Quarter ended September-2015
Actual Results Budget-Qx Actual-Qx $ %
Variance F or U
Variance
Sales $3,394,247.63 $3,371,200.00 -$23,047.63 -1% U
11MANAGE FINANCE
– Cost Of
Goods Sold $1,934,721.05 $1,955,296.00 -$20,574.95 -1% U
Gross Profit $1,459,526.59 $1,415,904.00 -$43,622.59 -3% U
Gross Profit % 43% 42% -1% -2% U
Expenses
– Accounting
Fees $2,500.00 $2,500.00 $0.00 0% F
– Interest
Expense $21,127.00 $28,150.00 -$7,023.00 -33% U
– Bank
Charges $400.00 $380.00 $20.00 5% F
– Depreciation $42,500.00 $42,500.00 $0.00 0% F
– Insurance $3,347.50 $3,348.00 -$0.50 0% F
– Store
Supplies $749.84 $790.00 -$40.16 -5% U
– Advertising $200,000.00 $150,000.00 $50,000.00 25% F
– Cleaning $3,256.45 $3,325.00 -$68.55 -2% U
– Repairs &
Maintenance $16,068.00 $16,150.00 -$82.00 -1% U
– Rent $660,127.00 $660,127.00 $0.00 0% F
– Telephone $2,999.36 $3,100.00 -$100.64 -3% U
– Electricity
Expense $6,695.00 $5,245.00 $1,450.00 22% F
– Luxury Car
Tax $12,000.00 $12,000.00 $0.00 0% U
– Fringe
Benefits Tax $7,000.00 $7,000.00 $0.00 0% F
–
Superannuation $37,404.00 $37,404.00 $0.00 0% F
– Wages &
Salaries $415,600.05 $410,500.00 $5,100.05 1% F
– Payroll Tax $19,741.00 $19,741.00 $0.00 0% F
– Workers’
Compensation $8,312.00 $8,312.00 $0.00 0% F
Total
Expenses $1,459,827.21 $1,410,572.00 $49,255.21 3% F
Net Profit
(Before Tax) -$300.62 $5,333.00 $5,633.62 -1874% U
Income Tax -$90.19 $1,600.00 -$1,690.19 1874% F
Net Profit -$210.44 $3,733.00 $3,943.44 -1874% U
⊘ This is a preview!⊘
Do you want full access?
Subscribe today to unlock all pages.
Trusted by 1+ million students worldwide
1 out of 16
Related Documents


Your All-in-One AI-Powered Toolkit for Academic Success.
+13062052269
info@desklib.com
Available 24*7 on WhatsApp / Email
![[object Object]](/_next/static/media/star-bottom.7253800d.svg)
Unlock your academic potential
Copyright © 2020–2026 A2Z Services. All Rights Reserved. Developed and managed by ZUCOL.