Report: Forecasting HR Demand for Bank Tellers Analysis

Verified

Added on  2022/08/19

|6
|861
|18
Report
AI Summary
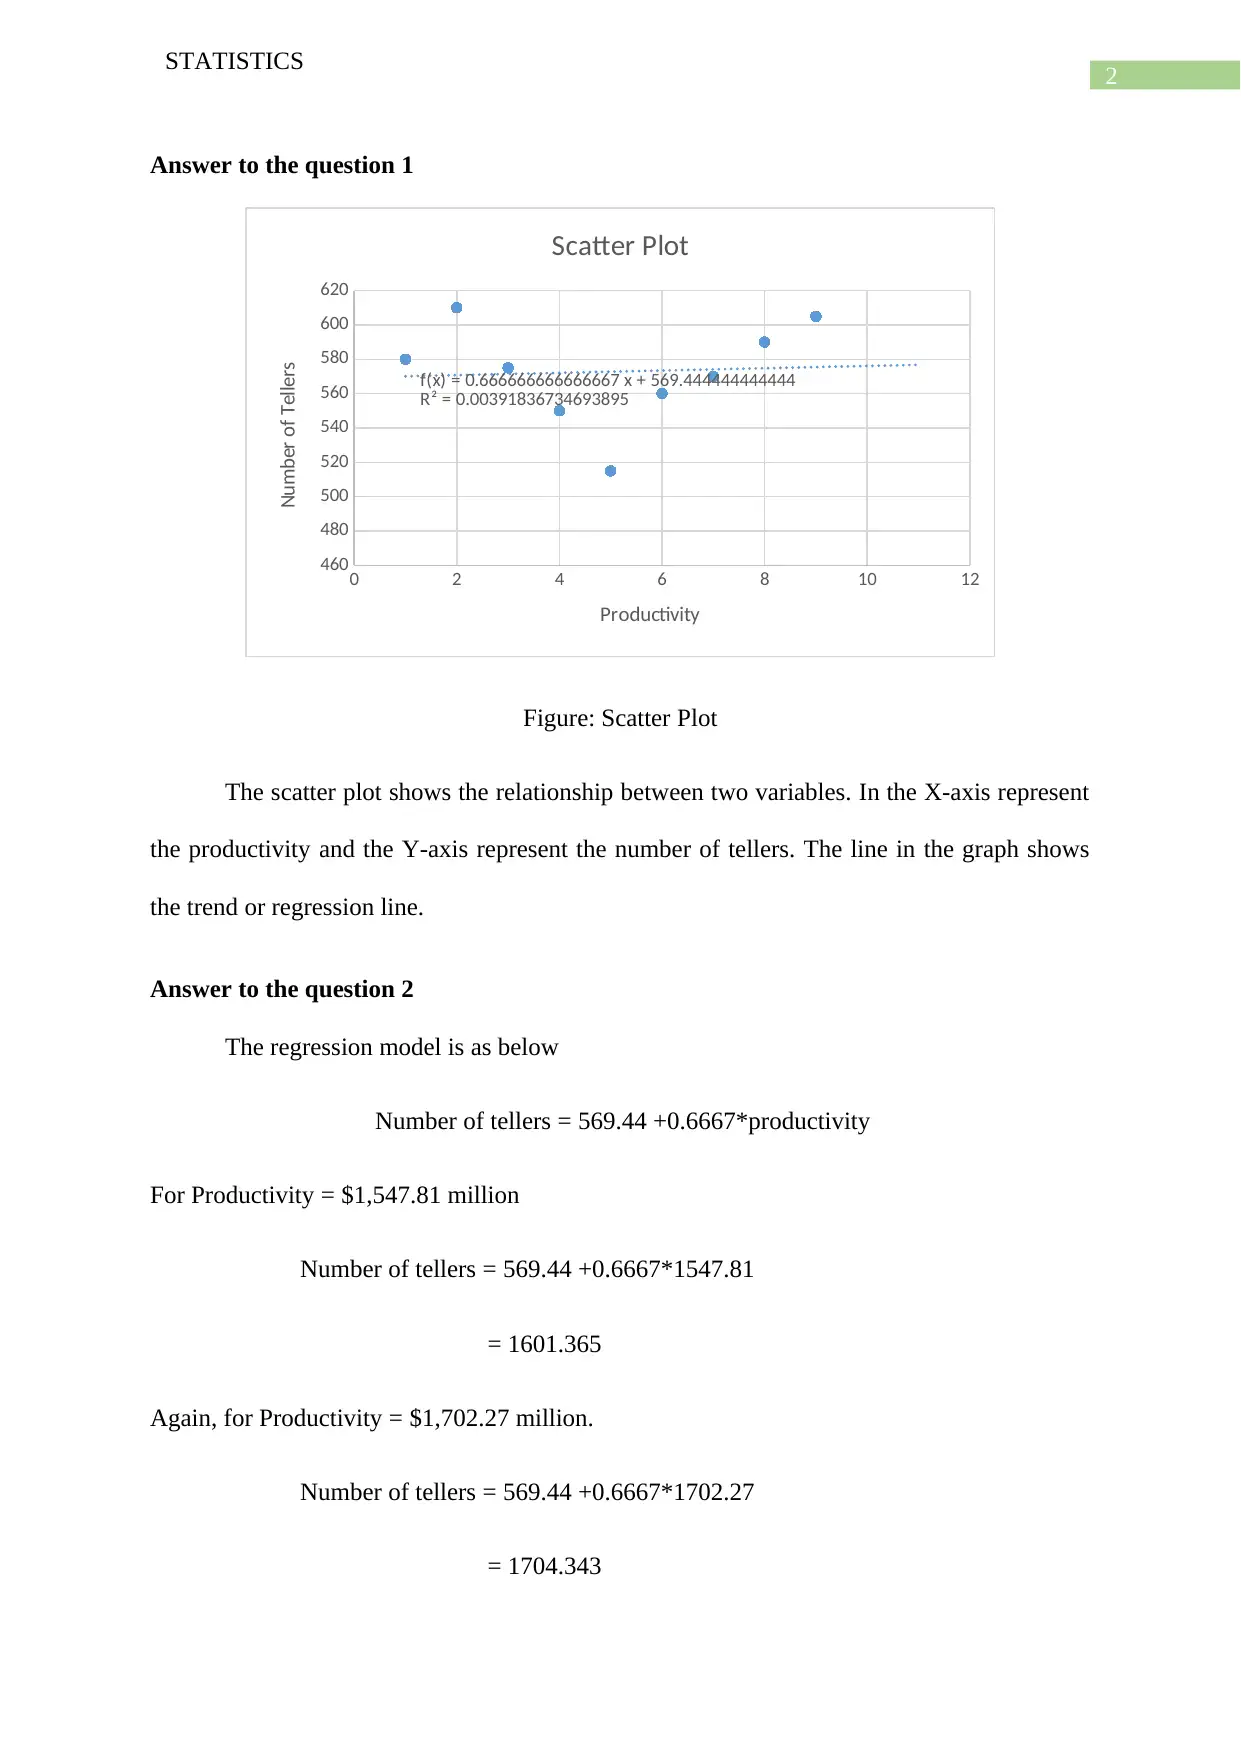
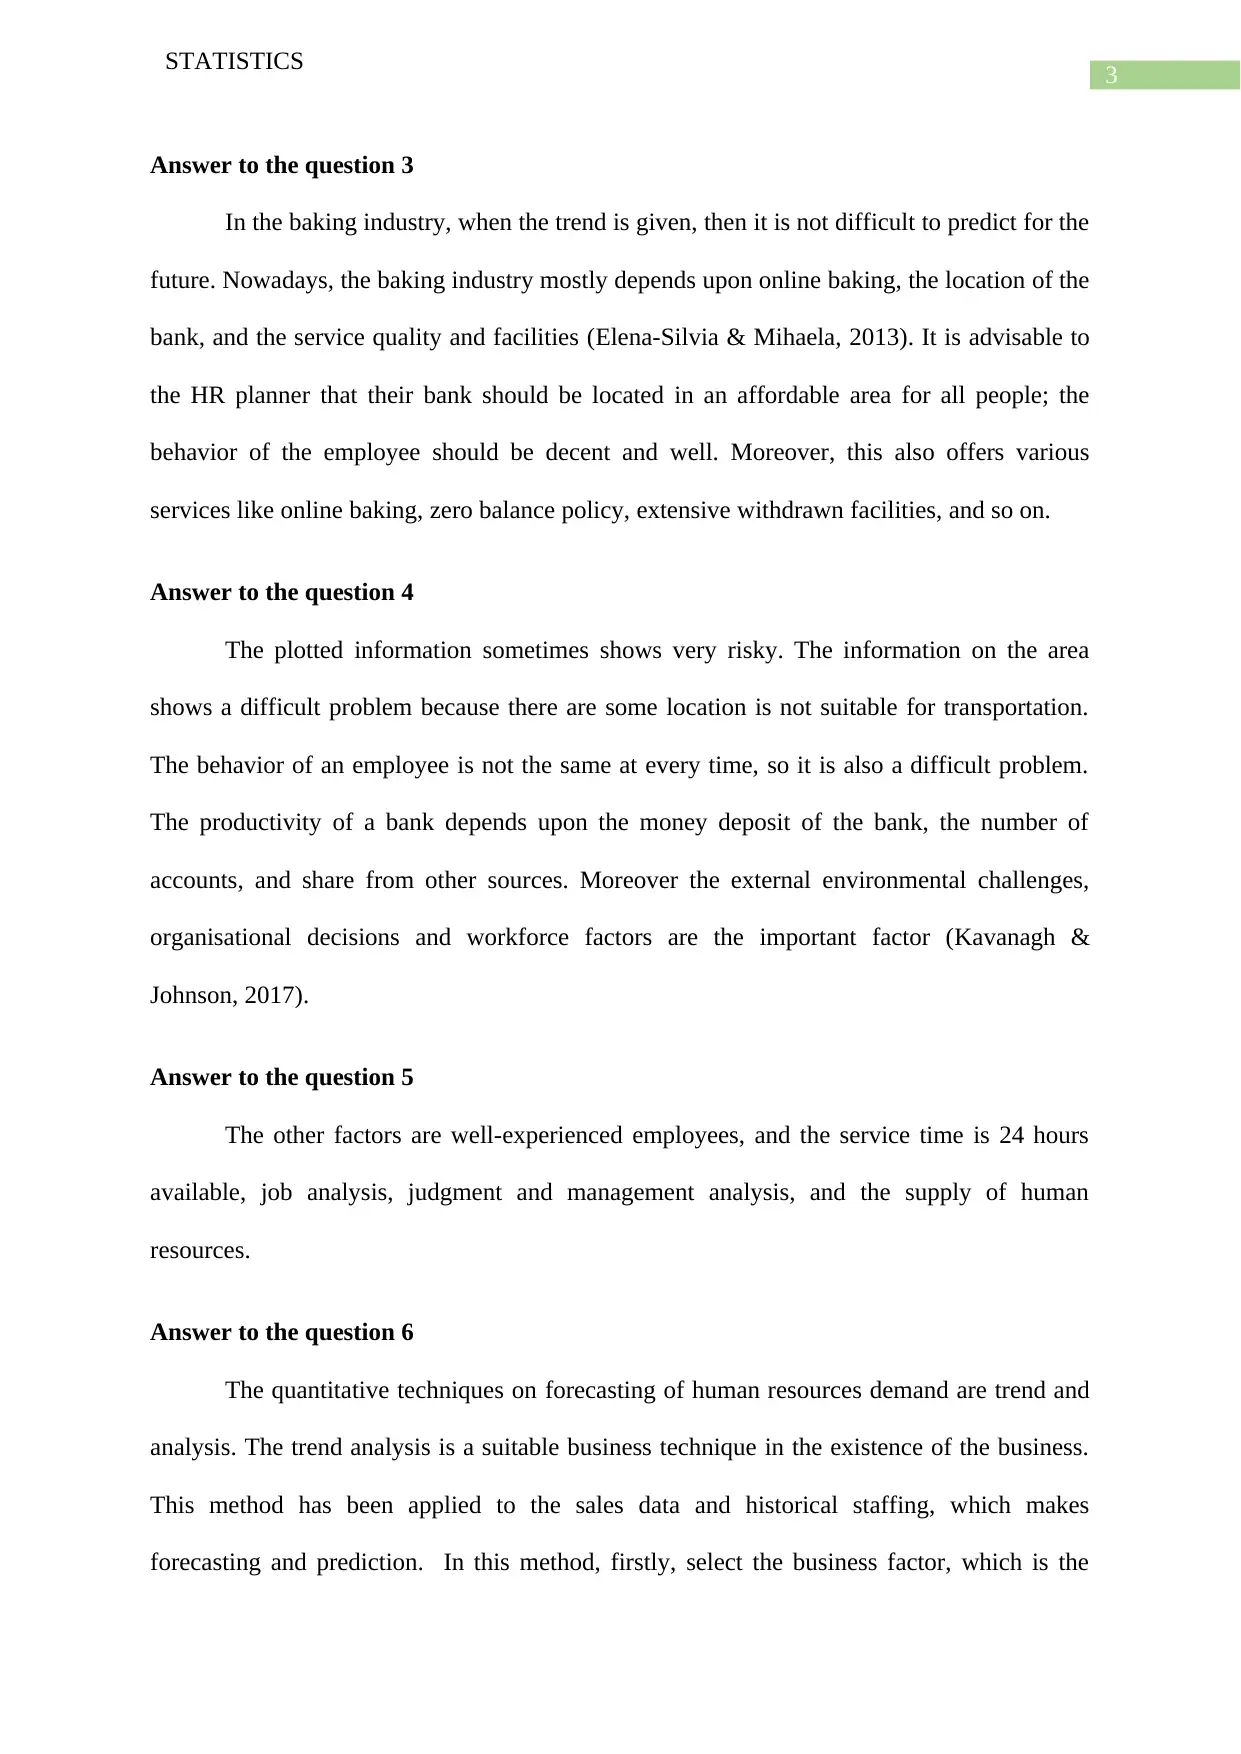
This report addresses the challenge of forecasting HR demand for bank tellers within a national bank context. Utilizing historical data from 2001 to 2009, the report employs ratio analysis to estimate future teller requirements, considering a projected 5% annual customer growth from 2009 to 2012. The analysis incorporates the impact of marketing strategies and a high-interest banking incentive on customer acquisition. Furthermore, the report accounts for anticipated productivity increases due to a planned training and orientation program. The report provides specific HR demand forecasts for 2010 and 2011, offering valuable insights for workforce planning and resource allocation within the banking sector. The report also touches upon the importance of employee behavior, bank location, and service quality in the banking industry. Moreover, it discusses both quantitative and qualitative techniques for forecasting human resources demand, including trend analysis and the Delphi technique. The report provides a detailed methodology and discusses factors influencing bank productivity.
Document Page
Running head: STATISTICS
Statistics
Name of the Student:
Name of the University:
Author note:
tabler-icon-diamond-filled.svg

Paraphrase This Document

Need a fresh take? Get an instant paraphrase of this document with our AI Paraphraser
Document Page
1
STATISTICS
Table of Contents
Answer to the question 1............................................................................................................2
Answer to the question 2............................................................................................................2
Answer to the question 3............................................................................................................3
Answer to the question 4............................................................................................................3
Answer to the question 5............................................................................................................3
Answer to the question 6............................................................................................................3
References..................................................................................................................................5
Document Page
2
STATISTICS
Answer to the question 1
0 2 4 6 8 10 12
460
480
500
520
540
560
580
600
620
f(x) = 0.666666666666667 x + 569.444444444444
R² = 0.00391836734693895
Scatter Plot
Productivity
Number of Tellers
Figure: Scatter Plot
The scatter plot shows the relationship between two variables. In the X-axis represent
the productivity and the Y-axis represent the number of tellers. The line in the graph shows
the trend or regression line.
Answer to the question 2
The regression model is as below
Number of tellers = 569.44 +0.6667*productivity
For Productivity = $1,547.81 million
Number of tellers = 569.44 +0.6667*1547.81
= 1601.365
Again, for Productivity = $1,702.27 million.
Number of tellers = 569.44 +0.6667*1702.27
= 1704.343
Document Page
3
STATISTICS
Answer to the question 3
In the baking industry, when the trend is given, then it is not difficult to predict for the
future. Nowadays, the baking industry mostly depends upon online baking, the location of the
bank, and the service quality and facilities (Elena-Silvia & Mihaela, 2013). It is advisable to
the HR planner that their bank should be located in an affordable area for all people; the
behavior of the employee should be decent and well. Moreover, this also offers various
services like online baking, zero balance policy, extensive withdrawn facilities, and so on.
Answer to the question 4
The plotted information sometimes shows very risky. The information on the area
shows a difficult problem because there are some location is not suitable for transportation.
The behavior of an employee is not the same at every time, so it is also a difficult problem.
The productivity of a bank depends upon the money deposit of the bank, the number of
accounts, and share from other sources. Moreover the external environmental challenges,
organisational decisions and workforce factors are the important factor (Kavanagh &
Johnson, 2017).
Answer to the question 5
The other factors are well-experienced employees, and the service time is 24 hours
available, job analysis, judgment and management analysis, and the supply of human
resources.
Answer to the question 6
The quantitative techniques on forecasting of human resources demand are trend and
analysis. The trend analysis is a suitable business technique in the existence of the business.
This method has been applied to the sales data and historical staffing, which makes
forecasting and prediction. In this method, firstly, select the business factor, which is the
tabler-icon-diamond-filled.svg

Paraphrase This Document

Need a fresh take? Get an instant paraphrase of this document with our AI Paraphraser
Document Page
4
STATISTICS
most usual and available predictor on human resources. In general, in trends analysis, sales,
or value-added has been applied as a predictor. The second step is to plot a historical trend
and concerning the relation of the number of the employee on business factors. The labor
productivity ratio has been calculated from the ratio of employees to the business factor. The
third step is the comparison of the productivity ratio among the past five years. The fourth
step is to calculate the human resource demand with the help of the ratio of business factors
to productivity. The final step is to project the human resource demand for the target year
(McCusker & Gunaydin, 2015).
The qualitative technique on forecasting human resources demand is the Delphi
technique. This method decreases the subjectivity on forecast, which has been done with the
help of the pre-selection group or individual. Thus this shows the judgments on summarizing
and soliciting. A technique of group decision making applied in turn, which shows an
orientation process. It forecast the coordination and cooperation on satisfactory. It has been
seen that dynamic technology changes the effect on the staffing level (Bernard, 2017).
Document Page
5
STATISTICS
References
Bernard, H. R. (2017). Research methods in anthropology: Qualitative and quantitative
approaches. Rowman & Littlefield.
Elena-Silvia, D., & Mihaela, B. (2013). THE EVOLUTION OF BANK BRANCHES IN
THE NEAR FUTURE. Anale. Seria Stiinte Economice. Timisoara, 19, 205.
Kavanagh, M. J., & Johnson, R. D. (Eds.). (2017). Human resource information systems:
Basics, applications, and future directions. Sage Publications.
Kleinbaum, D. G., Kupper, L. L., Nizam, A., & Rosenberg, E. S. (2013). Applied regression
analysis and other multivariable methods. Nelson Education.
McCusker, K., & Gunaydin, S. (2015). Research using qualitative, quantitative or mixed
methods and choice based on the research. Perfusion, 30(7), 537-542.
chevron_up_icon
1 out of 6
circle_padding
hide_on_mobile
zoom_out_icon
[object Object]