Detailed Report on HR Metrics and Workforce Analysis in NSW, Australia

Verified

Added on  2020/11/05

|3
|527
|142
Report
AI Summary
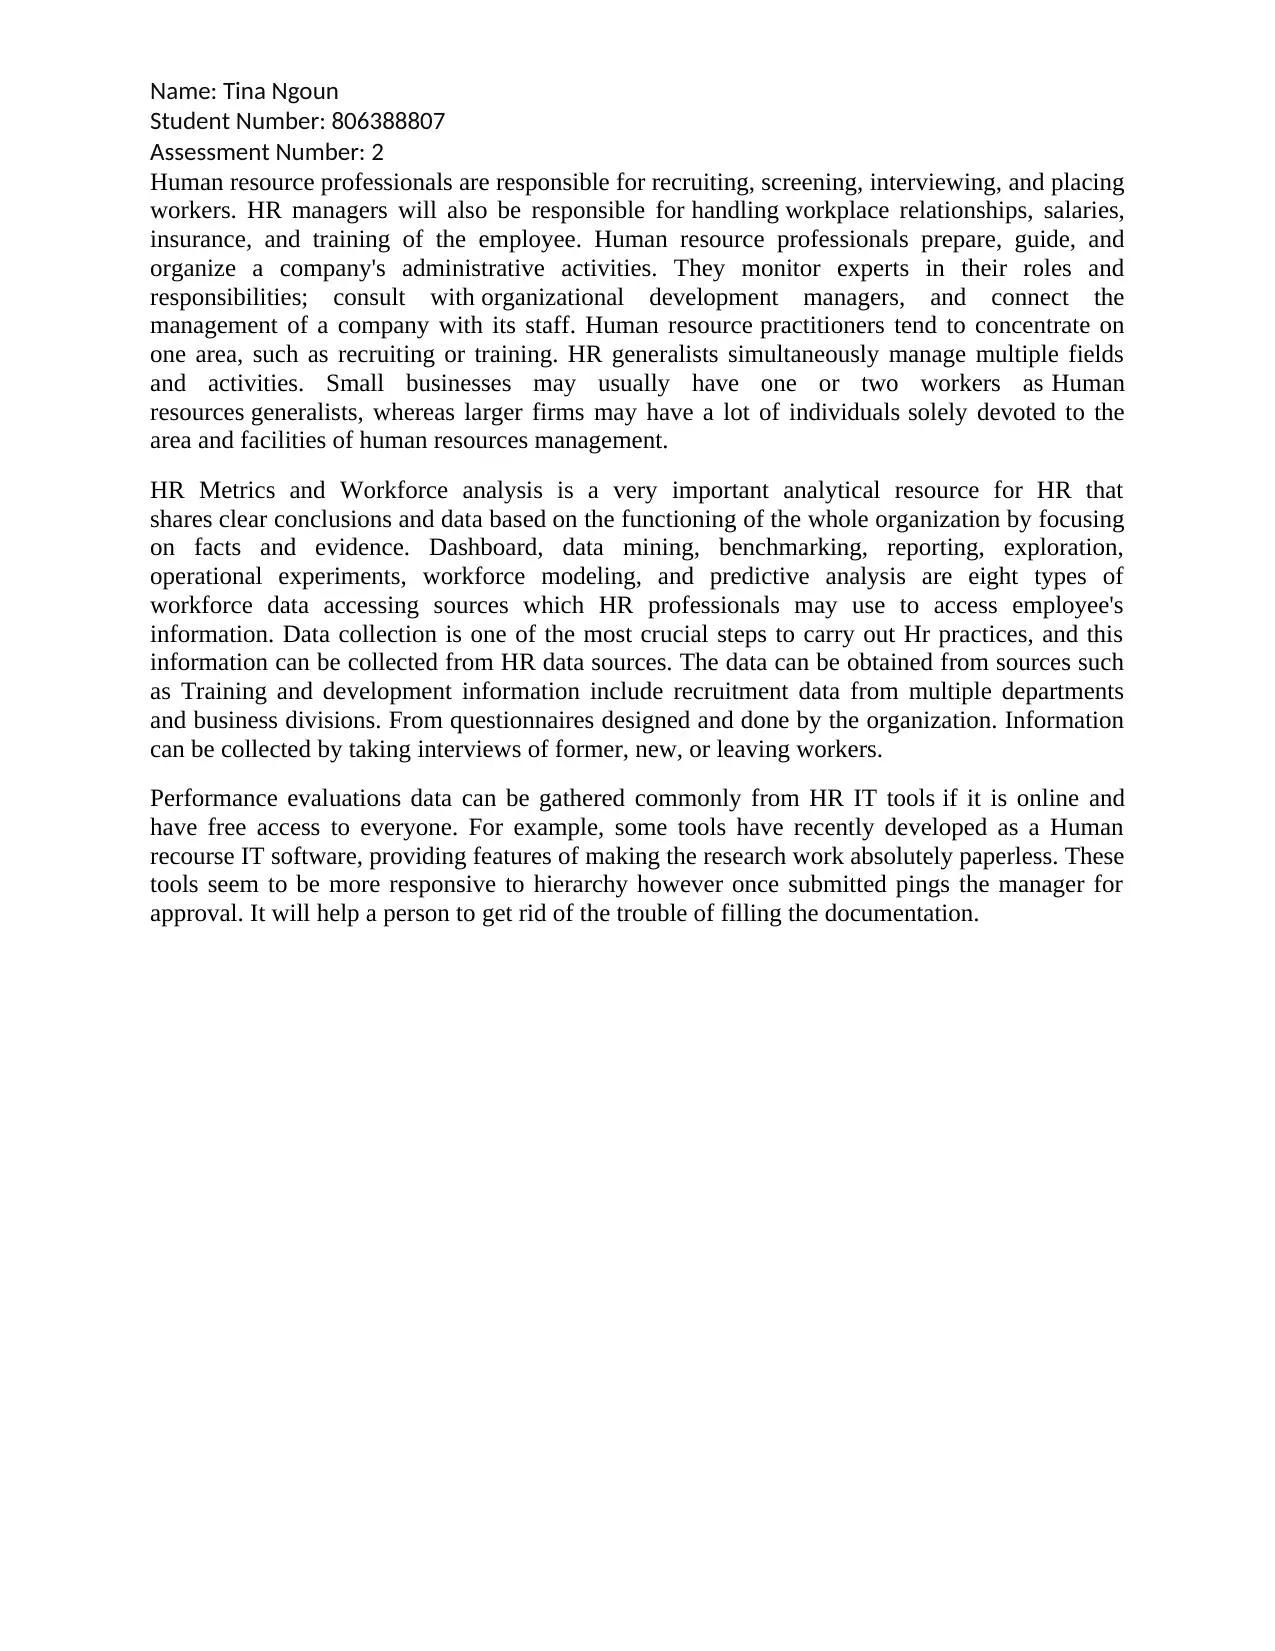
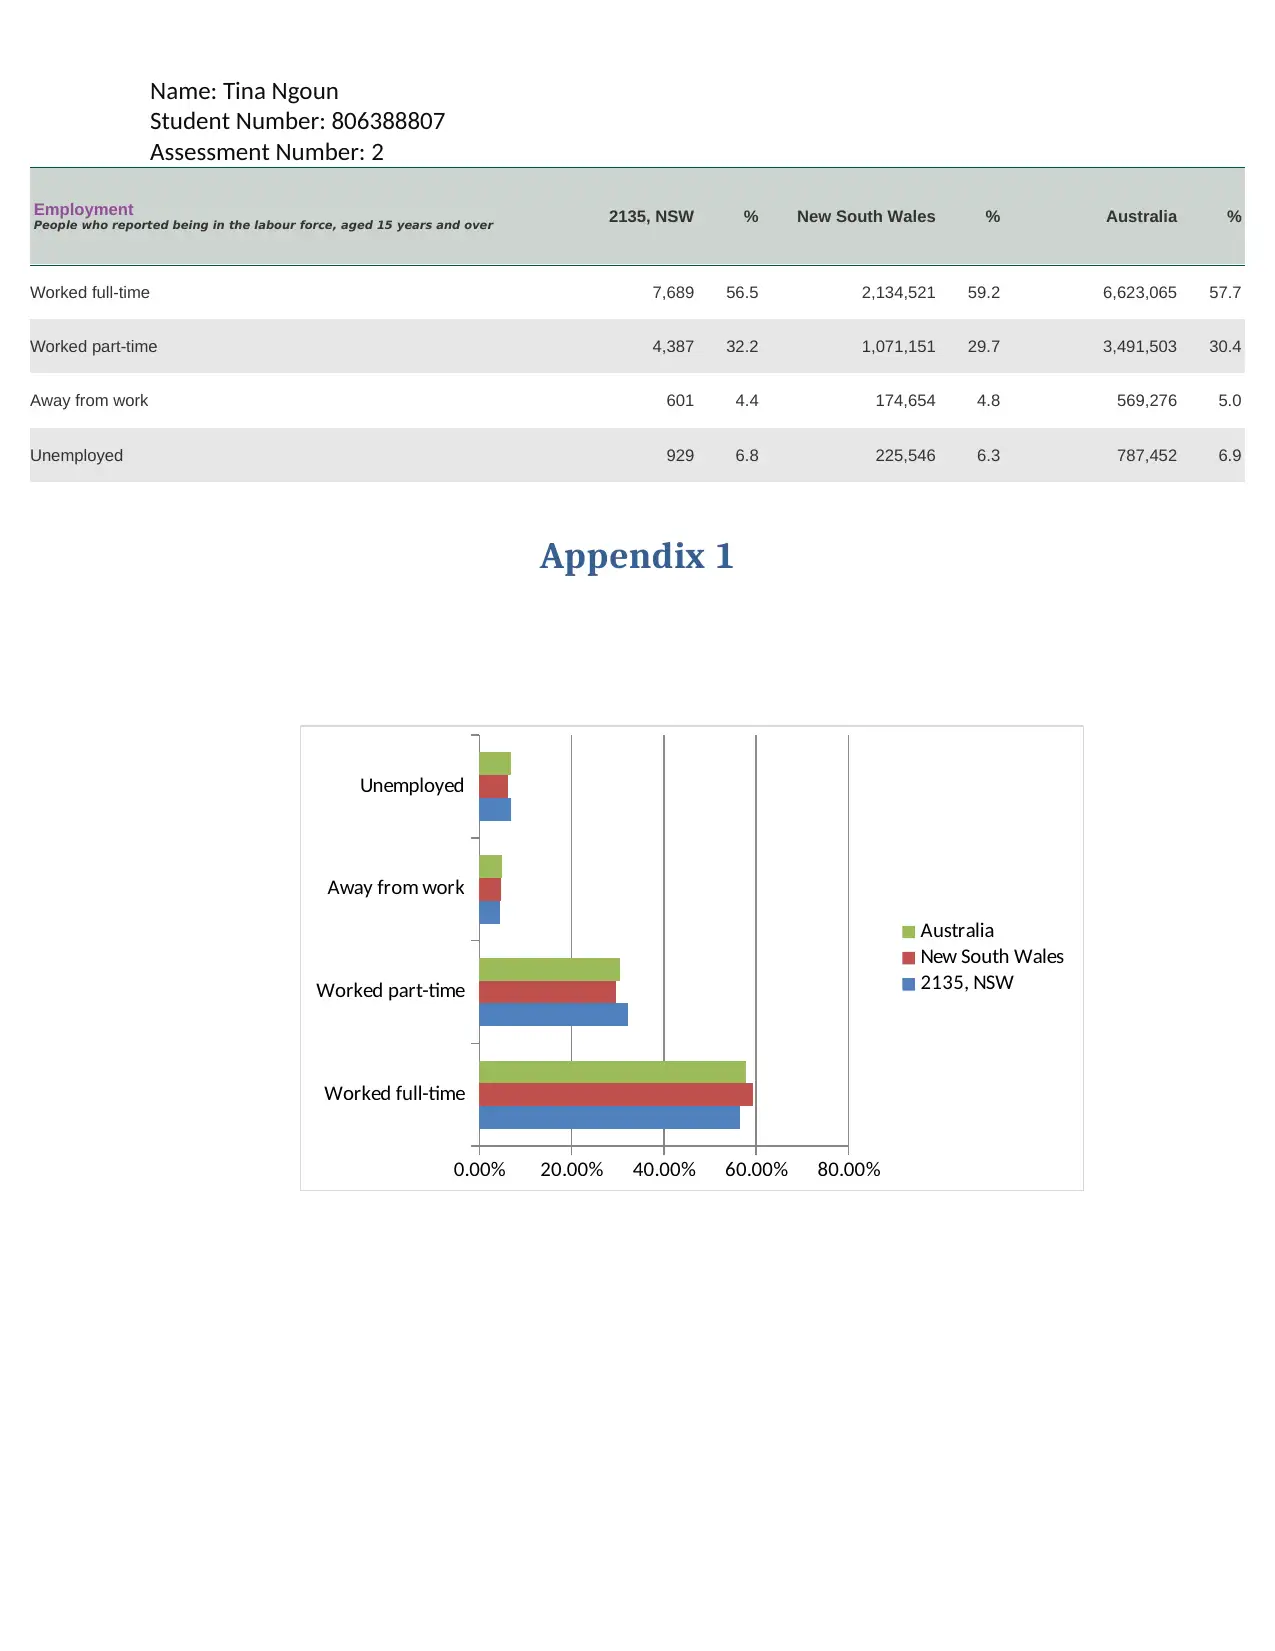
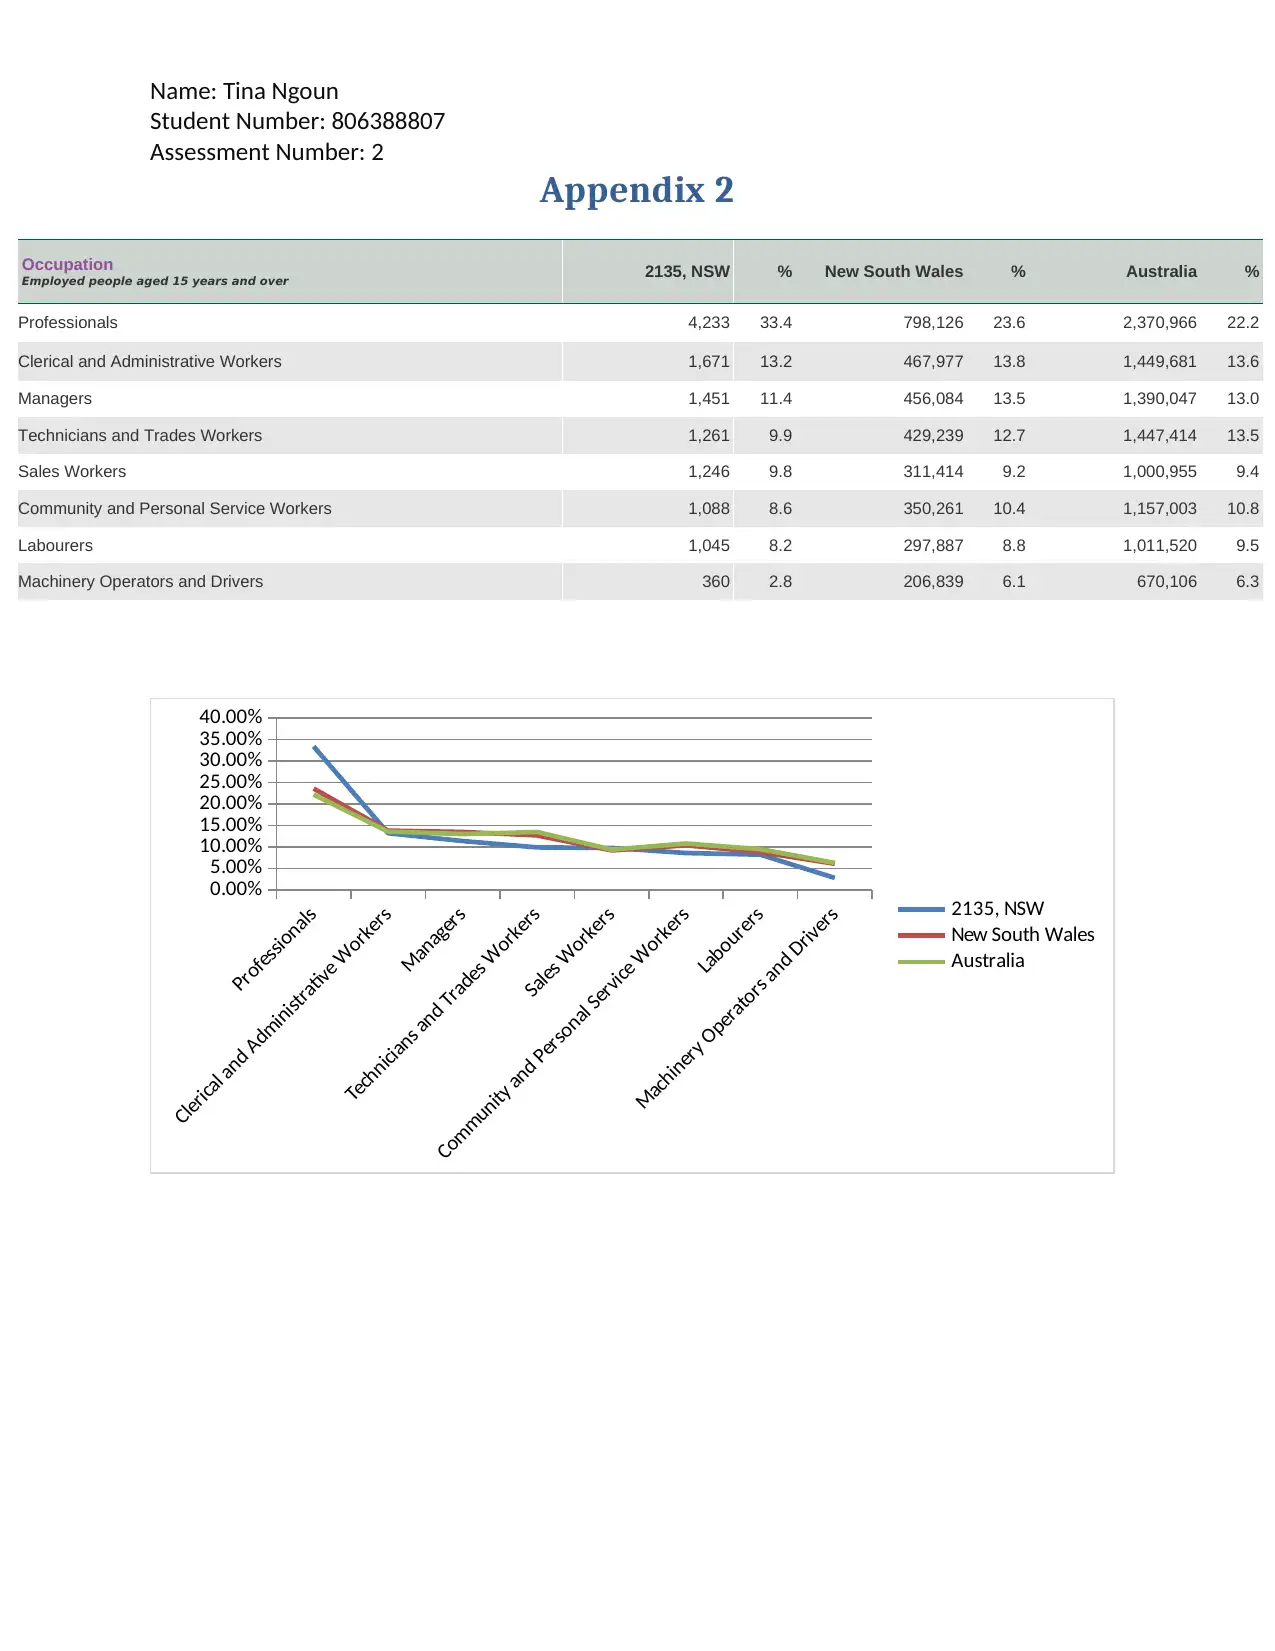
This report provides an overview of HR metrics and workforce analysis, emphasizing the crucial role of HR professionals in managing and analyzing employee data. It discusses various data sources, including training and development information, questionnaires, interviews, and performance evaluations. The report highlights eight types of workforce data accessing sources like dashboards, data mining, and predictive analysis. Furthermore, it presents employment data for NSW, Australia, categorized by work status (full-time, part-time, etc.) and occupation (professionals, managers, etc.). The report underscores the importance of data-driven decision-making in HR and provides insights into workforce trends and characteristics.
tabler-icon-diamond-filled.svg

Contribute Materials

Your contribution can guide someone’s learning journey. Share your documents today.
Document Page
Name: Tina Ngoun
Student Number: 806388807
Assessment Number: 2
Human resource professionals are responsible for recruiting, screening, interviewing, and placing
workers. HR managers will also be responsible for handling workplace relationships, salaries,
insurance, and training of the employee. Human resource professionals prepare, guide, and
organize a company's administrative activities. They monitor experts in their roles and
responsibilities; consult with organizational development managers, and connect the
management of a company with its staff. Human resource practitioners tend to concentrate on
one area, such as recruiting or training. HR generalists simultaneously manage multiple fields
and activities. Small businesses may usually have one or two workers as Human
resources generalists, whereas larger firms may have a lot of individuals solely devoted to the
area and facilities of human resources management.
HR Metrics and Workforce analysis is a very important analytical resource for HR that
shares clear conclusions and data based on the functioning of the whole organization by focusing
on facts and evidence. Dashboard, data mining, benchmarking, reporting, exploration,
operational experiments, workforce modeling, and predictive analysis are eight types of
workforce data accessing sources which HR professionals may use to access employee's
information. Data collection is one of the most crucial steps to carry out Hr practices, and this
information can be collected from HR data sources. The data can be obtained from sources such
as Training and development information include recruitment data from multiple departments
and business divisions. From questionnaires designed and done by the organization. Information
can be collected by taking interviews of former, new, or leaving workers.
Performance evaluations data can be gathered commonly from HR IT tools if it is online and
have free access to everyone. For example, some tools have recently developed as a Human
recourse IT software, providing features of making the research work absolutely paperless. These
tools seem to be more responsive to hierarchy however once submitted pings the manager for
approval. It will help a person to get rid of the trouble of filling the documentation.
tabler-icon-diamond-filled.svg

Secure Best Marks with AI Grader

Need help grading? Try our AI Grader for instant feedback on your assignments.
Document Page
Name: Tina Ngoun
Student Number: 806388807
Assessment Number: 2
Employment
People who reported being in the labour force, aged 15 years and over 2135, NSW % New South Wales % Australia %
Worked full-time 7,689 56.5 2,134,521 59.2 6,623,065 57.7
Worked part-time 4,387 32.2 1,071,151 29.7 3,491,503 30.4
Away from work 601 4.4 174,654 4.8 569,276 5.0
Unemployed 929 6.8 225,546 6.3 787,452 6.9
Appendix 1
Worked full-time
Worked part-time
Away from work
Unemployed
0.00% 20.00% 40.00% 60.00% 80.00%
Australia
New South Wales
2135, NSW
Document Page
Name: Tina Ngoun
Student Number: 806388807
Assessment Number: 2
Appendix 2
Occupation
Employed people aged 15 years and over 2135, NSW % New South Wales % Australia %
Professionals 4,233 33.4 798,126 23.6 2,370,966 22.2
Clerical and Administrative Workers 1,671 13.2 467,977 13.8 1,449,681 13.6
Managers 1,451 11.4 456,084 13.5 1,390,047 13.0
Technicians and Trades Workers 1,261 9.9 429,239 12.7 1,447,414 13.5
Sales Workers 1,246 9.8 311,414 9.2 1,000,955 9.4
Community and Personal Service Workers 1,088 8.6 350,261 10.4 1,157,003 10.8
Labourers 1,045 8.2 297,887 8.8 1,011,520 9.5
Machinery Operators and Drivers 360 2.8 206,839 6.1 670,106 6.3
Professionals
Clerical and Administrative Workers
Managers
Technicians and Trades Workers
Sales Workers
Community and Personal Service Workers
Labourers
Machinery Operators and Drivers
0.00%
5.00%
10.00%
15.00%
20.00%
25.00%
30.00%
35.00%
40.00%
2135, NSW
New South Wales
Australia
chevron_up_icon
1 out of 3
circle_padding
hide_on_mobile
zoom_out_icon
logo.png

Your All-in-One AI-Powered Toolkit for Academic Success.

Available 24*7 on WhatsApp / Email

[object Object]