Comprehensive Ratio Analysis and Comparison: HSBC & Standard Chartered
VerifiedAdded on 2022/08/12
|16
|2560
|22
Report
AI Summary
This report undertakes a comprehensive ratio analysis of HSBC and Standard Chartered banks, evaluating their financial performance across various key metrics. The analysis encompasses profitability ratios (net profit margin, return on assets, return on equity), liquidity ratios (current ratio, quick ratio), capital structure ratios (debt to assets, debt to equity, capital gearing), and efficiency ratios (fixed asset turnover, receivable ratio). The report compares the banks' performance over a period, highlighting trends and identifying strengths and weaknesses. It also discusses the impact of changes in accounting policies and acknowledges the limitations of ratio analysis. The analysis is supported by financial statement data and aims to provide a comparative assessment of the financial health of the two banks, offering valuable insights for financial decision-making and understanding the competitive landscape within the banking sector.
Running head: RATIO ANALYSIS OF HSBC AND STANDARD CHARTERED
Ratio Analysis of HSBC and Standard Chartered
Name of the University
Name of the student
Author note
Ratio Analysis of HSBC and Standard Chartered
Name of the University
Name of the student
Author note
Paraphrase This Document
Need a fresh take? Get an instant paraphrase of this document with our AI Paraphraser
1
RATIO ANALYSIS OF HSBC AND STANDARD CHARTERED
Executive summary
The objective of the report is to highlight the importance of the ratio analysis and on the basis
of the ratio analysis evaluation of the financial strength of HSBC and the standard chartered
bank has been made. The report contains the brief analysis of all the profitability, efficiency
and capital structure ratios to make a comparative analysis between these two banks. It also
contains the impact of changes in the accounting policies of the banks and the report has been
concluded by stating the limitations of the use of ratio analysis to evaluate the financial
condition of the banks.
2
RATIO ANALYSIS OF HSBC AND STANDARD CHARTERED
Table of Contents
Introduction................................................................................................................................3
Discussion..................................................................................................................................3
Conclusion..................................................................................................................................6
References..................................................................................................................................7
Appendix....................................................................................................................................8
⊘ This is a preview!⊘
Do you want full access?
Subscribe today to unlock all pages.
Trusted by 1+ million students worldwide
3
RATIO ANALYSIS OF HSBC AND STANDARD CHARTERED
Introduction
HSBC is one of the leading banks in the world with total asset value of US $2.558
trillion. The bank has around 3900 offices in 65 countries. The bank operates in Asia, Africa,
Europe and north America having a customer base of 38 million. The company is listed in
both the stack exchanges of Hong Kong and the London stock exchange. Standard chartered
is one of its major competitors which is also considered as one of the major banks in the
international market. Standard chartered has 1200 branches all over the world and the
business is expanded over more than 70 countries in the world.
Discussion
Analysis of financial statements
The income statement of HSBC has been analysed and from which it has been
observed the operating profit in the last 5 years has decreased, in spite of generating higher
revenue in the last 5 years, this indicates that the operating expenses has exceeded
significantly in the last five years and the management of the bank has to take preventive
measures to control the increasing trend of expenses.
By analysing the balance sheet, it has been observed that in the last five years the
HSBC bank has been able to enhance the value of their assets which indicates that the bank
has strong financial condition (Monahan 2018).
From the analysis of the cash flow statement it can be observed that despite of
negative free cash flow in the year 2015 and 2017 the bank has made significant
improvement in the year 2016 and 2018 and from negative balance it bring the cash position
in positive balance tht is from (-£ 57,438,000.00) in the year 2015 to £ 66,902,000.00 in the
year 2016 and from (-£ 12,930,000.00) in the year 2017 to £3,425,000.00 in the year2018
and £26,111,000.00 in the year 2019.
Ratio analysis
The financial performance of HSBC is compared with standard chartered bank, in
order to make the comparison four main ratios are considered these are capital structure ratio,
efficiency ratios, profitability ratios, and the liquidity ratios,
Profitability ratios
The profitability ratios that are considered to measure the financial strength of HSBC
and standard chartered bank are net profit margin, return of assets and the return on equity.
The net profit margin of HSBC in the year 2018 and 2019 is 16.73 and the 7.21 which
indicates that the HSBC failed to maintain its net profit margin in the year 2019 and due to its
poor performance in the year 2019 the net profit margin decreased to a significant level. In
comparison to that the standard chartered bank has been able to increase the profit margin
from 7.49 in the year 2018 to 15.17 in the year 2019. This indicates that standard chartered
has been able to perform better than HSBC (Bootle et al 2018).
Return on assets
Paraphrase This Document
Need a fresh take? Get an instant paraphrase of this document with our AI Paraphraser
4
RATIO ANALYSIS OF HSBC AND STANDARD CHARTERED
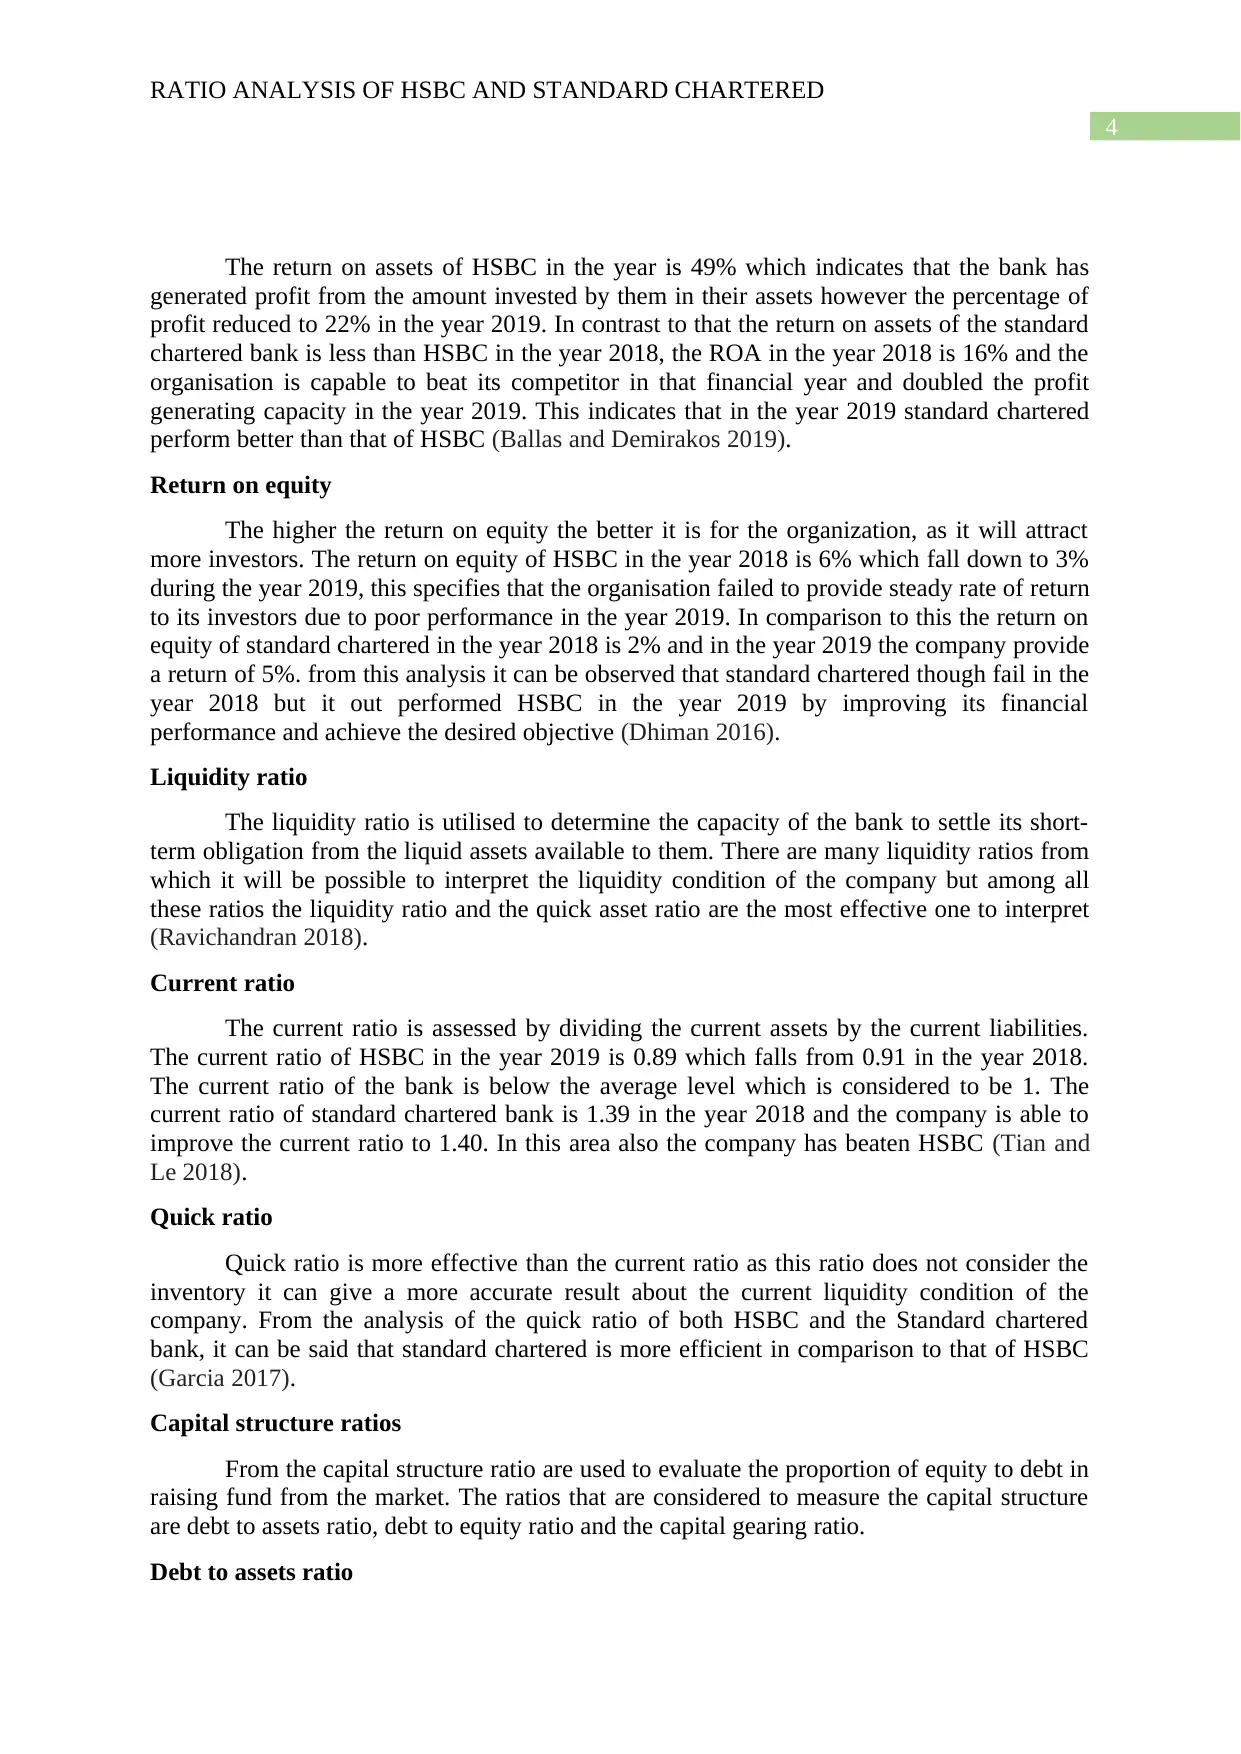
The return on assets of HSBC in the year is 49% which indicates that the bank has
generated profit from the amount invested by them in their assets however the percentage of
profit reduced to 22% in the year 2019. In contrast to that the return on assets of the standard
chartered bank is less than HSBC in the year 2018, the ROA in the year 2018 is 16% and the
organisation is capable to beat its competitor in that financial year and doubled the profit
generating capacity in the year 2019. This indicates that in the year 2019 standard chartered
perform better than that of HSBC (Ballas and Demirakos 2019).
Return on equity
The higher the return on equity the better it is for the organization, as it will attract
more investors. The return on equity of HSBC in the year 2018 is 6% which fall down to 3%
during the year 2019, this specifies that the organisation failed to provide steady rate of return
to its investors due to poor performance in the year 2019. In comparison to this the return on
equity of standard chartered in the year 2018 is 2% and in the year 2019 the company provide
a return of 5%. from this analysis it can be observed that standard chartered though fail in the
year 2018 but it out performed HSBC in the year 2019 by improving its financial
performance and achieve the desired objective (Dhiman 2016).
Liquidity ratio
The liquidity ratio is utilised to determine the capacity of the bank to settle its short-
term obligation from the liquid assets available to them. There are many liquidity ratios from
which it will be possible to interpret the liquidity condition of the company but among all
these ratios the liquidity ratio and the quick asset ratio are the most effective one to interpret
(Ravichandran 2018).
Current ratio
The current ratio is assessed by dividing the current assets by the current liabilities.
The current ratio of HSBC in the year 2019 is 0.89 which falls from 0.91 in the year 2018.
The current ratio of the bank is below the average level which is considered to be 1. The
current ratio of standard chartered bank is 1.39 in the year 2018 and the company is able to
improve the current ratio to 1.40. In this area also the company has beaten HSBC (Tian and
Le 2018).
Quick ratio
Quick ratio is more effective than the current ratio as this ratio does not consider the
inventory it can give a more accurate result about the current liquidity condition of the
company. From the analysis of the quick ratio of both HSBC and the Standard chartered
bank, it can be said that standard chartered is more efficient in comparison to that of HSBC
(Garcia 2017).
Capital structure ratios
From the capital structure ratio are used to evaluate the proportion of equity to debt in
raising fund from the market. The ratios that are considered to measure the capital structure
are debt to assets ratio, debt to equity ratio and the capital gearing ratio.
Debt to assets ratio
RATIO ANALYSIS OF HSBC AND STANDARD CHARTERED
The return on assets of HSBC in the year is 49% which indicates that the bank has
generated profit from the amount invested by them in their assets however the percentage of
profit reduced to 22% in the year 2019. In contrast to that the return on assets of the standard
chartered bank is less than HSBC in the year 2018, the ROA in the year 2018 is 16% and the
organisation is capable to beat its competitor in that financial year and doubled the profit
generating capacity in the year 2019. This indicates that in the year 2019 standard chartered
perform better than that of HSBC (Ballas and Demirakos 2019).
Return on equity
The higher the return on equity the better it is for the organization, as it will attract
more investors. The return on equity of HSBC in the year 2018 is 6% which fall down to 3%
during the year 2019, this specifies that the organisation failed to provide steady rate of return
to its investors due to poor performance in the year 2019. In comparison to this the return on
equity of standard chartered in the year 2018 is 2% and in the year 2019 the company provide
a return of 5%. from this analysis it can be observed that standard chartered though fail in the
year 2018 but it out performed HSBC in the year 2019 by improving its financial
performance and achieve the desired objective (Dhiman 2016).
Liquidity ratio
The liquidity ratio is utilised to determine the capacity of the bank to settle its short-
term obligation from the liquid assets available to them. There are many liquidity ratios from
which it will be possible to interpret the liquidity condition of the company but among all
these ratios the liquidity ratio and the quick asset ratio are the most effective one to interpret
(Ravichandran 2018).
Current ratio
The current ratio is assessed by dividing the current assets by the current liabilities.
The current ratio of HSBC in the year 2019 is 0.89 which falls from 0.91 in the year 2018.
The current ratio of the bank is below the average level which is considered to be 1. The
current ratio of standard chartered bank is 1.39 in the year 2018 and the company is able to
improve the current ratio to 1.40. In this area also the company has beaten HSBC (Tian and
Le 2018).
Quick ratio
Quick ratio is more effective than the current ratio as this ratio does not consider the
inventory it can give a more accurate result about the current liquidity condition of the
company. From the analysis of the quick ratio of both HSBC and the Standard chartered
bank, it can be said that standard chartered is more efficient in comparison to that of HSBC
(Garcia 2017).
Capital structure ratios
From the capital structure ratio are used to evaluate the proportion of equity to debt in
raising fund from the market. The ratios that are considered to measure the capital structure
are debt to assets ratio, debt to equity ratio and the capital gearing ratio.
Debt to assets ratio
5
RATIO ANALYSIS OF HSBC AND STANDARD CHARTERED
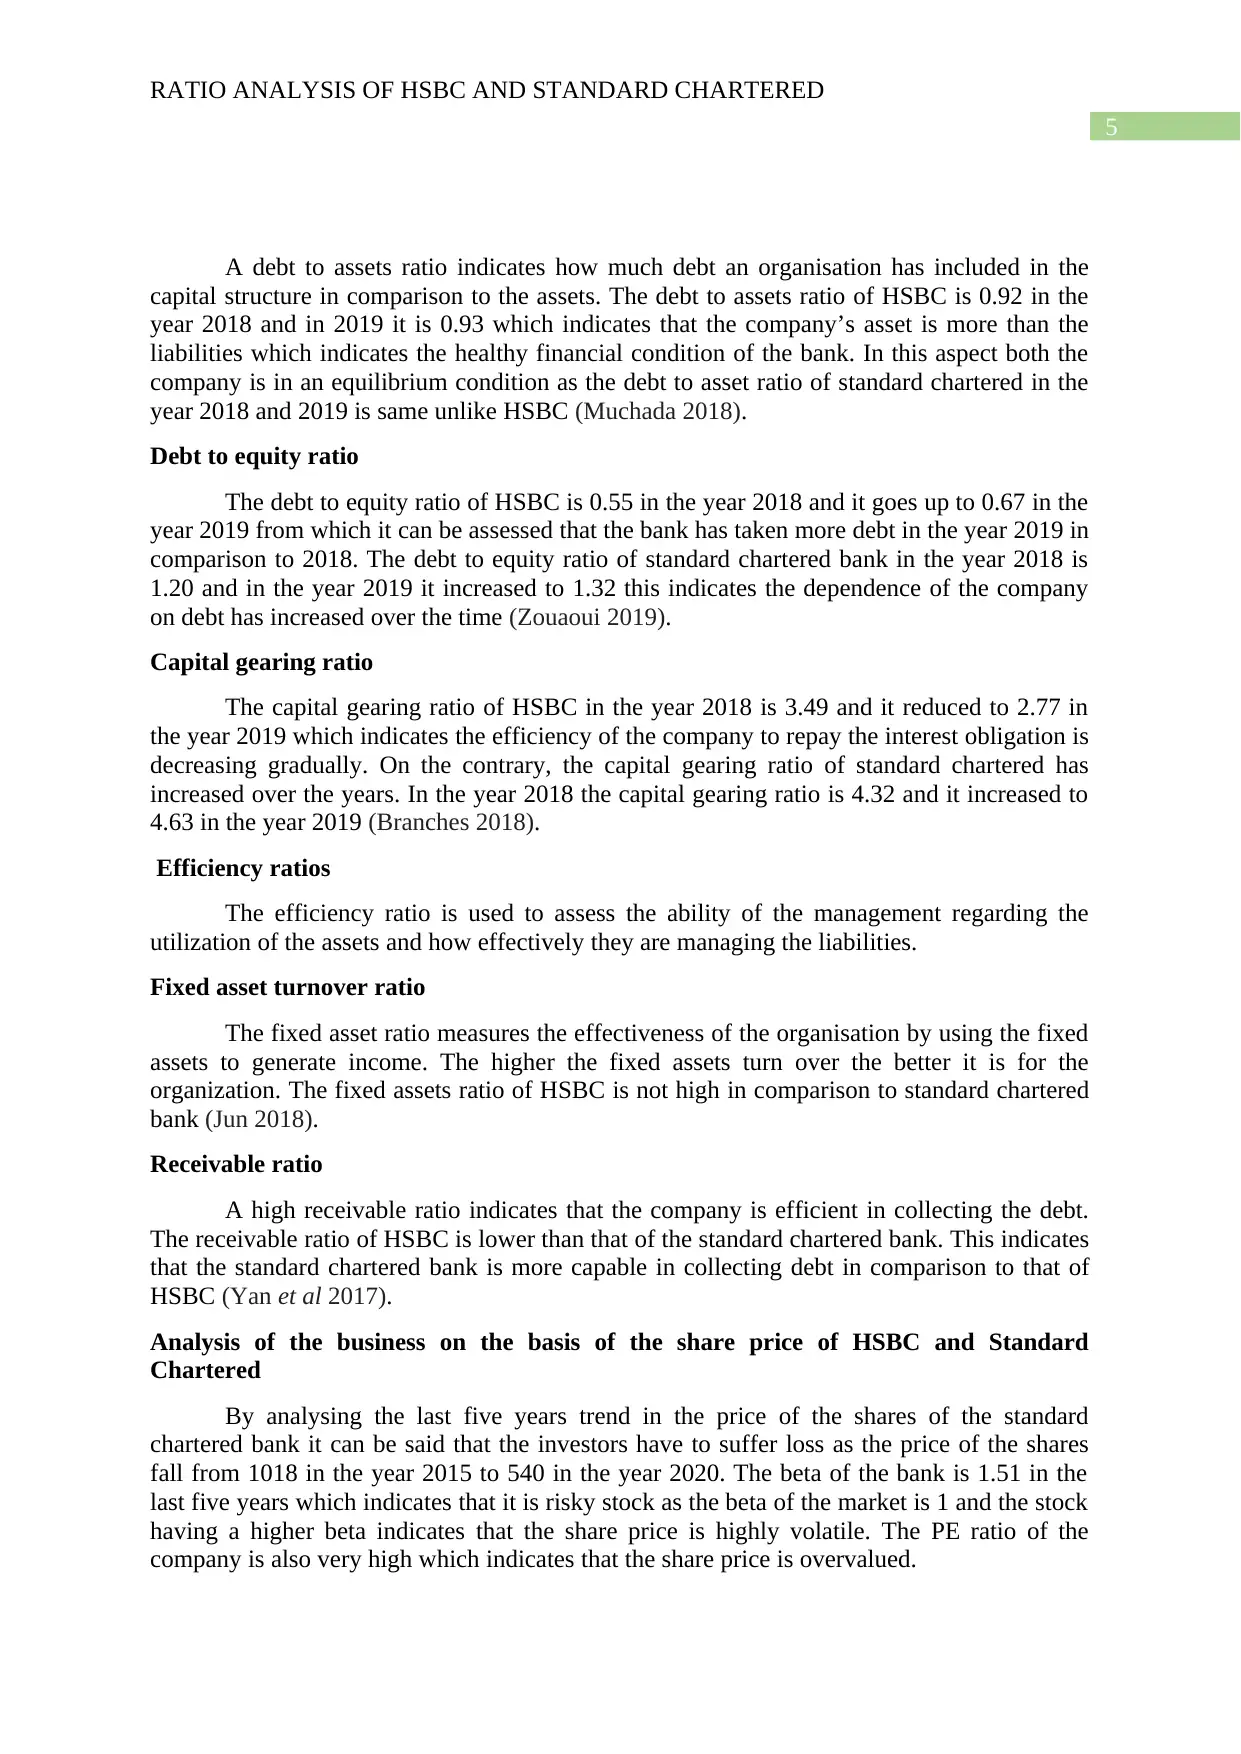
A debt to assets ratio indicates how much debt an organisation has included in the
capital structure in comparison to the assets. The debt to assets ratio of HSBC is 0.92 in the
year 2018 and in 2019 it is 0.93 which indicates that the company’s asset is more than the
liabilities which indicates the healthy financial condition of the bank. In this aspect both the
company is in an equilibrium condition as the debt to asset ratio of standard chartered in the
year 2018 and 2019 is same unlike HSBC (Muchada 2018).
Debt to equity ratio
The debt to equity ratio of HSBC is 0.55 in the year 2018 and it goes up to 0.67 in the
year 2019 from which it can be assessed that the bank has taken more debt in the year 2019 in
comparison to 2018. The debt to equity ratio of standard chartered bank in the year 2018 is
1.20 and in the year 2019 it increased to 1.32 this indicates the dependence of the company
on debt has increased over the time (Zouaoui 2019).
Capital gearing ratio
The capital gearing ratio of HSBC in the year 2018 is 3.49 and it reduced to 2.77 in
the year 2019 which indicates the efficiency of the company to repay the interest obligation is
decreasing gradually. On the contrary, the capital gearing ratio of standard chartered has
increased over the years. In the year 2018 the capital gearing ratio is 4.32 and it increased to
4.63 in the year 2019 (Branches 2018).
Efficiency ratios
The efficiency ratio is used to assess the ability of the management regarding the
utilization of the assets and how effectively they are managing the liabilities.
Fixed asset turnover ratio
The fixed asset ratio measures the effectiveness of the organisation by using the fixed
assets to generate income. The higher the fixed assets turn over the better it is for the
organization. The fixed assets ratio of HSBC is not high in comparison to standard chartered
bank (Jun 2018).
Receivable ratio
A high receivable ratio indicates that the company is efficient in collecting the debt.
The receivable ratio of HSBC is lower than that of the standard chartered bank. This indicates
that the standard chartered bank is more capable in collecting debt in comparison to that of
HSBC (Yan et al 2017).
Analysis of the business on the basis of the share price of HSBC and Standard
Chartered
By analysing the last five years trend in the price of the shares of the standard
chartered bank it can be said that the investors have to suffer loss as the price of the shares
fall from 1018 in the year 2015 to 540 in the year 2020. The beta of the bank is 1.51 in the
last five years which indicates that it is risky stock as the beta of the market is 1 and the stock
having a higher beta indicates that the share price is highly volatile. The PE ratio of the
company is also very high which indicates that the share price is overvalued.
RATIO ANALYSIS OF HSBC AND STANDARD CHARTERED
A debt to assets ratio indicates how much debt an organisation has included in the
capital structure in comparison to the assets. The debt to assets ratio of HSBC is 0.92 in the
year 2018 and in 2019 it is 0.93 which indicates that the company’s asset is more than the
liabilities which indicates the healthy financial condition of the bank. In this aspect both the
company is in an equilibrium condition as the debt to asset ratio of standard chartered in the
year 2018 and 2019 is same unlike HSBC (Muchada 2018).
Debt to equity ratio
The debt to equity ratio of HSBC is 0.55 in the year 2018 and it goes up to 0.67 in the
year 2019 from which it can be assessed that the bank has taken more debt in the year 2019 in
comparison to 2018. The debt to equity ratio of standard chartered bank in the year 2018 is
1.20 and in the year 2019 it increased to 1.32 this indicates the dependence of the company
on debt has increased over the time (Zouaoui 2019).
Capital gearing ratio
The capital gearing ratio of HSBC in the year 2018 is 3.49 and it reduced to 2.77 in
the year 2019 which indicates the efficiency of the company to repay the interest obligation is
decreasing gradually. On the contrary, the capital gearing ratio of standard chartered has
increased over the years. In the year 2018 the capital gearing ratio is 4.32 and it increased to
4.63 in the year 2019 (Branches 2018).
Efficiency ratios
The efficiency ratio is used to assess the ability of the management regarding the
utilization of the assets and how effectively they are managing the liabilities.
Fixed asset turnover ratio
The fixed asset ratio measures the effectiveness of the organisation by using the fixed
assets to generate income. The higher the fixed assets turn over the better it is for the
organization. The fixed assets ratio of HSBC is not high in comparison to standard chartered
bank (Jun 2018).
Receivable ratio
A high receivable ratio indicates that the company is efficient in collecting the debt.
The receivable ratio of HSBC is lower than that of the standard chartered bank. This indicates
that the standard chartered bank is more capable in collecting debt in comparison to that of
HSBC (Yan et al 2017).
Analysis of the business on the basis of the share price of HSBC and Standard
Chartered
By analysing the last five years trend in the price of the shares of the standard
chartered bank it can be said that the investors have to suffer loss as the price of the shares
fall from 1018 in the year 2015 to 540 in the year 2020. The beta of the bank is 1.51 in the
last five years which indicates that it is risky stock as the beta of the market is 1 and the stock
having a higher beta indicates that the share price is highly volatile. The PE ratio of the
company is also very high which indicates that the share price is overvalued.
⊘ This is a preview!⊘
Do you want full access?
Subscribe today to unlock all pages.
Trusted by 1+ million students worldwide
6
RATIO ANALYSIS OF HSBC AND STANDARD CHARTERED
In comparison to standard chartered, the share price is steadier and it does not
fluctuate more, the beta is 0.65 which indicates that the share price tends to provide an
assured return to the investors.
Changes in accounting policies
With the implementation of the changed provision of the IFRS 16 which is related
with the accounting for leases the assets value increased significantly by $5 billion and also
increased the liabilities by the same amount. Beside that the application of the amended
sections in IFRS 9 and IAS 39 (Shanshan 2019).
Standard chartered group has changed the policy of accounting for recording the net
interest margin which creates an impact on the financial performance of the standard
chartered bank, due to the changed policy the interest earning capacity of the bank for
providing loan to the borrowers decreased, which negatively effected the performance of the
bank (Bootle et al 2018).
Limitation
The analysis has been made on the basis of the data given by the company’s annual
report which may not reveal the actual condition of the banks. Different ratios can be
calculated in different methods. The changes in the accounting policies may affect the
valuation of the ratios. It is essential to consider the non financial factors and current events
which can not be measured by ratio analysis.
Conclusion
From analysis of the financial statement and ratio analysis it can be concluded that
these are the essential measurement tool to evaluate the financial strength of HSBC and
standard chartered bank to make a comparative analysis of both the banks. From ratio
analysis it is not possible to detect the accurate financial condition as it does not consider the
non financial aspects and the current situations prevailing in the company.
Paraphrase This Document
Need a fresh take? Get an instant paraphrase of this document with our AI Paraphraser
7
RATIO ANALYSIS OF HSBC AND STANDARD CHARTERED
References
Ballas, A. and Demirakos, E., 2019. The Valuation Properties of the Rating to Economic
Profit. Available at SSRN 3413905.
Bootle, R., Jessop, J., Lyons, G. and Minford, P., 2018. Alternative Brexit Economic
Analysis. London: Economists for Free Trade.
Branches, B., 2018. Standard Chartered Bank. Balance Sheet, 2018.
Burcă, V., Nicolăescu, C. and Drăguţ, D., 2019. Critical Analysis on the Amendments
Discussed, Concerning Changes in Accounting Estimates. Studies in Business and
Economics, 14(1), pp.17-33.
Dhiman, P.K., 2016. PRODUCTIVITY ANALYSIS OF FOREIGN SECTOR
BANKS. International Journal of Management (IJM), 7(7).
Garcia, C.E., 2017. Health behavior and use of internet technologies in adolescents (HSBC
study results).
https://www.hsbc.com/investors/results-and-announcements/annual-report
https://www.macrotrends.net/stocks/charts/HSBC/hsbc/financial-statements
https://www.macrotrends.net/stocks/charts/SCBFF/standard-chartered/financial-statements
https://www.sc.com/en/investors/financial-results/annual-report/
Jun, F., 2018. Study of Relationship Between Credit Risk (Non-Performing Finance Ratio)
and Internal and External Factors in HSBC Bank. Available at SSRN 3301111.
Monahan, S.J., 2018. Financial Statement Analysis and Earnings Forecasting. Foundations
and Trends® in Accounting, 12(2), pp.105-215.
Muchada, L., 2018. Impact of regulatory framework on deposit mobilization by Standard
Chartered Bank.
Rahman, M., 2018. General banking operation of Standard Chartered Bank.
Ravichandran, N., 2018. COMPARATIVE ANALYSIS OF CITI BANK AND STANDARD
CHARTEREDBANK USING DUPONT MODEL.
Shanshan, L., 2019, May. Analysis on the Relationship between the Change of Accounting
Policy and Market Share Price. In 2019 4th International Conference on Social Sciences and
Economic Development (ICSSED 2019). Atlantis Press.
8
RATIO ANALYSIS OF HSBC AND STANDARD CHARTERED
Tian, J. and Le, Y., 2018. Banking Industry Valuation Analysis in the Context of China’s
Listed Banks. Journal of Modern Accounting and Auditing, 14(5), pp.265-270.
Yan, M., Zhang, D., Hall, M.J. and Turner, P., 2017. How liquid are banks: Some evidence
from the United Kingdom. Journal of banking regulation, 18(2), pp.163-179.
Zouaoui, M., 2019. Selectivity and Market Timing Ability of Fund Managers: Comparative
Analysis of Islamic and Conventional HSBC Saudi Mutual Funds. International Journal of
Financial Studies, 7(3), p.48.
⊘ This is a preview!⊘
Do you want full access?
Subscribe today to unlock all pages.
Trusted by 1+ million students worldwide
9
RATIO ANALYSIS OF HSBC AND STANDARD CHARTERED
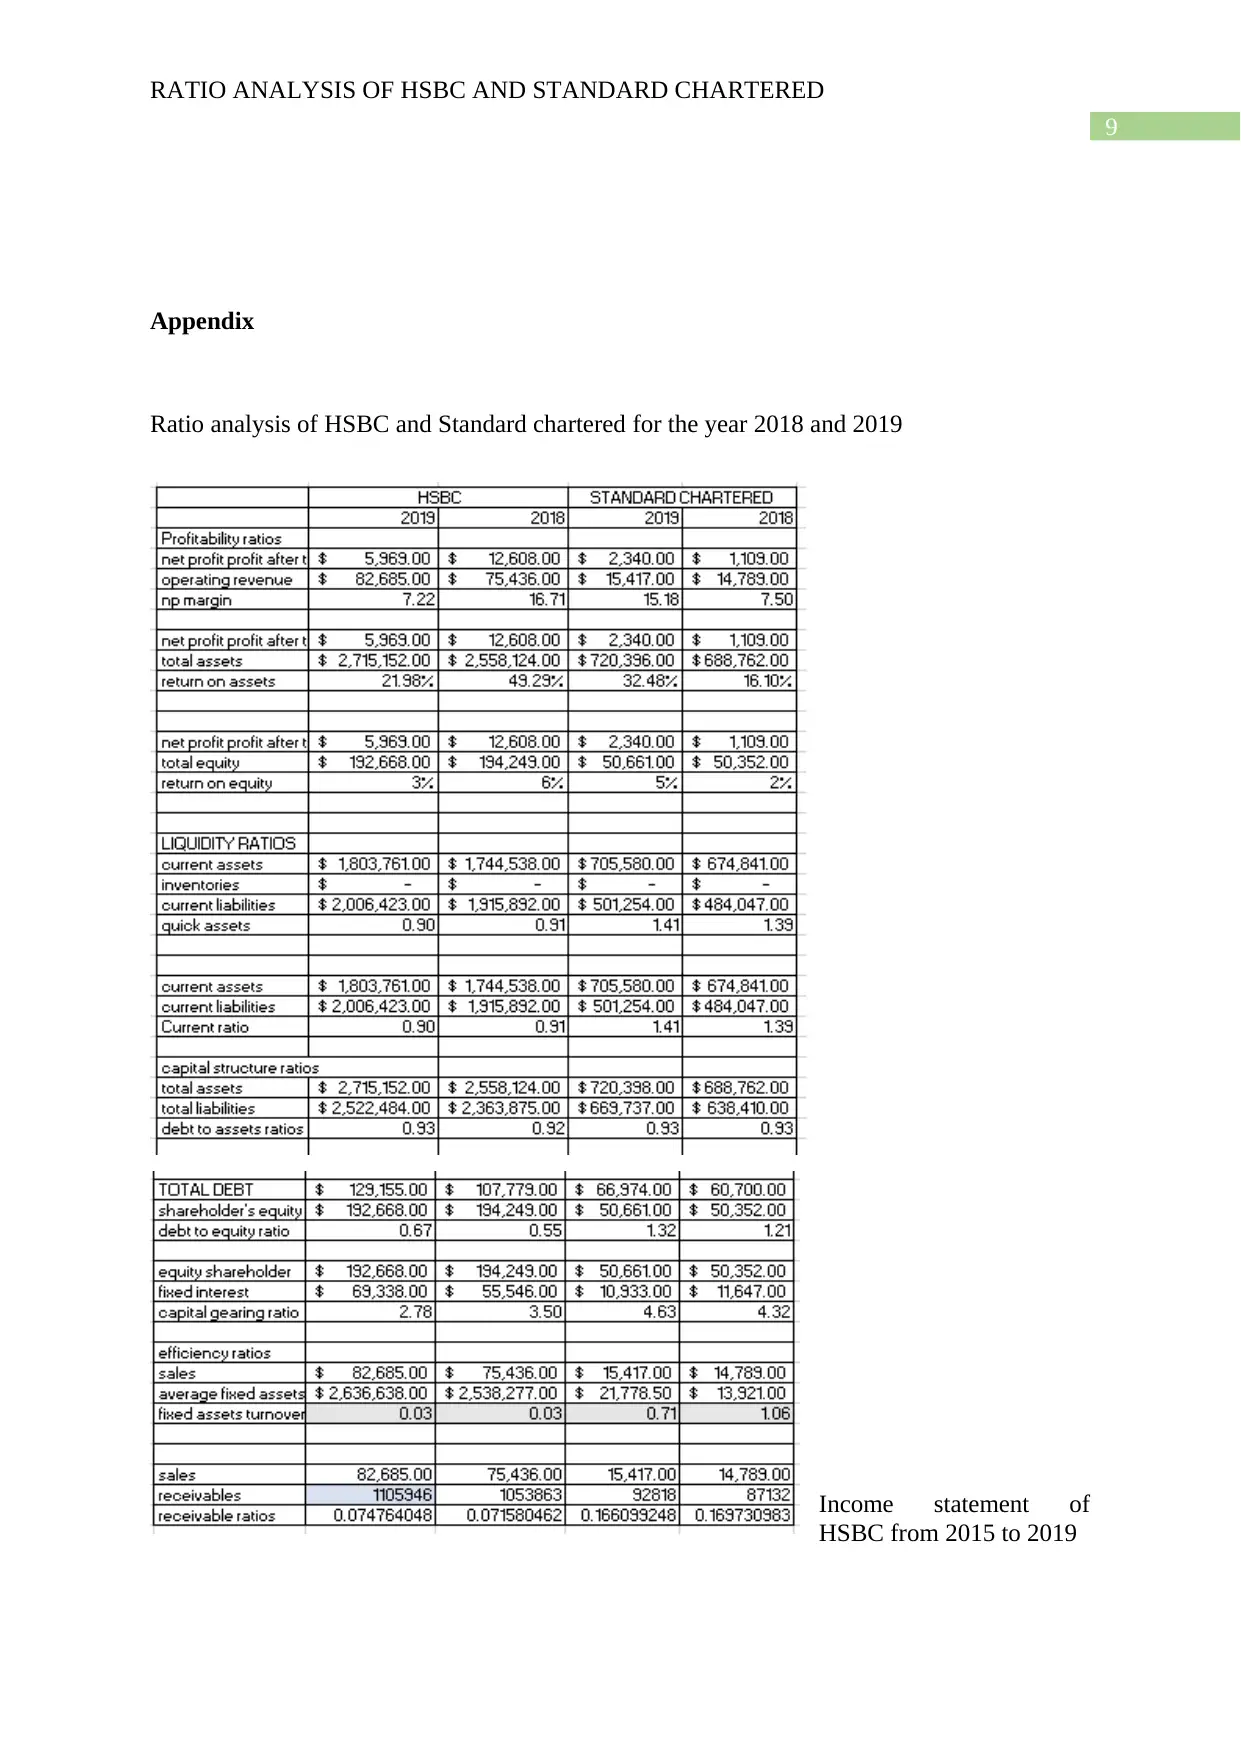
Appendix
Ratio analysis of HSBC and Standard chartered for the year 2018 and 2019
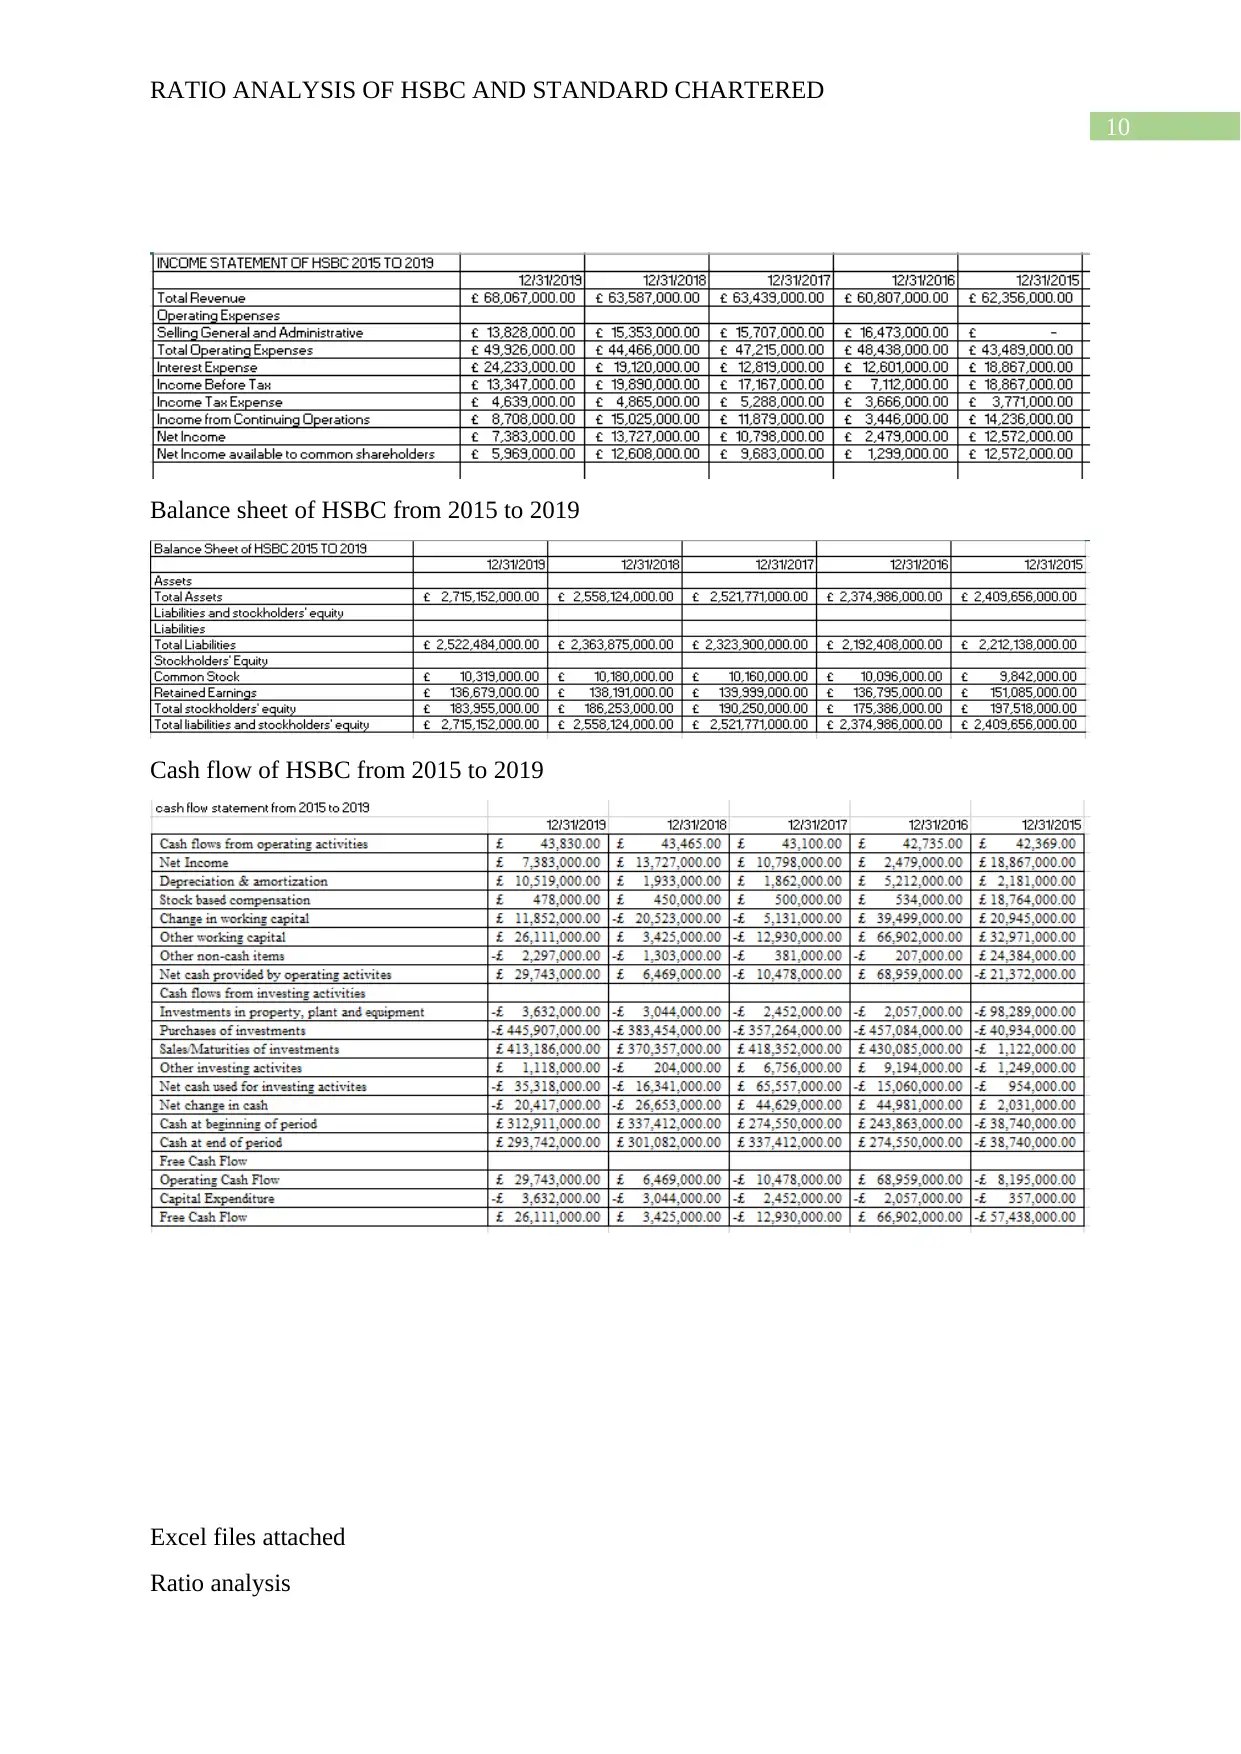
Income statement of
HSBC from 2015 to 2019
RATIO ANALYSIS OF HSBC AND STANDARD CHARTERED
Appendix
Ratio analysis of HSBC and Standard chartered for the year 2018 and 2019
Income statement of
HSBC from 2015 to 2019
Paraphrase This Document
Need a fresh take? Get an instant paraphrase of this document with our AI Paraphraser
10
RATIO ANALYSIS OF HSBC AND STANDARD CHARTERED
Balance sheet of HSBC from 2015 to 2019
Cash flow of HSBC from 2015 to 2019
Excel files attached
Ratio analysis
RATIO ANALYSIS OF HSBC AND STANDARD CHARTERED
Balance sheet of HSBC from 2015 to 2019
Cash flow of HSBC from 2015 to 2019
Excel files attached
Ratio analysis
11
RATIO ANALYSIS OF HSBC AND STANDARD CHARTERED
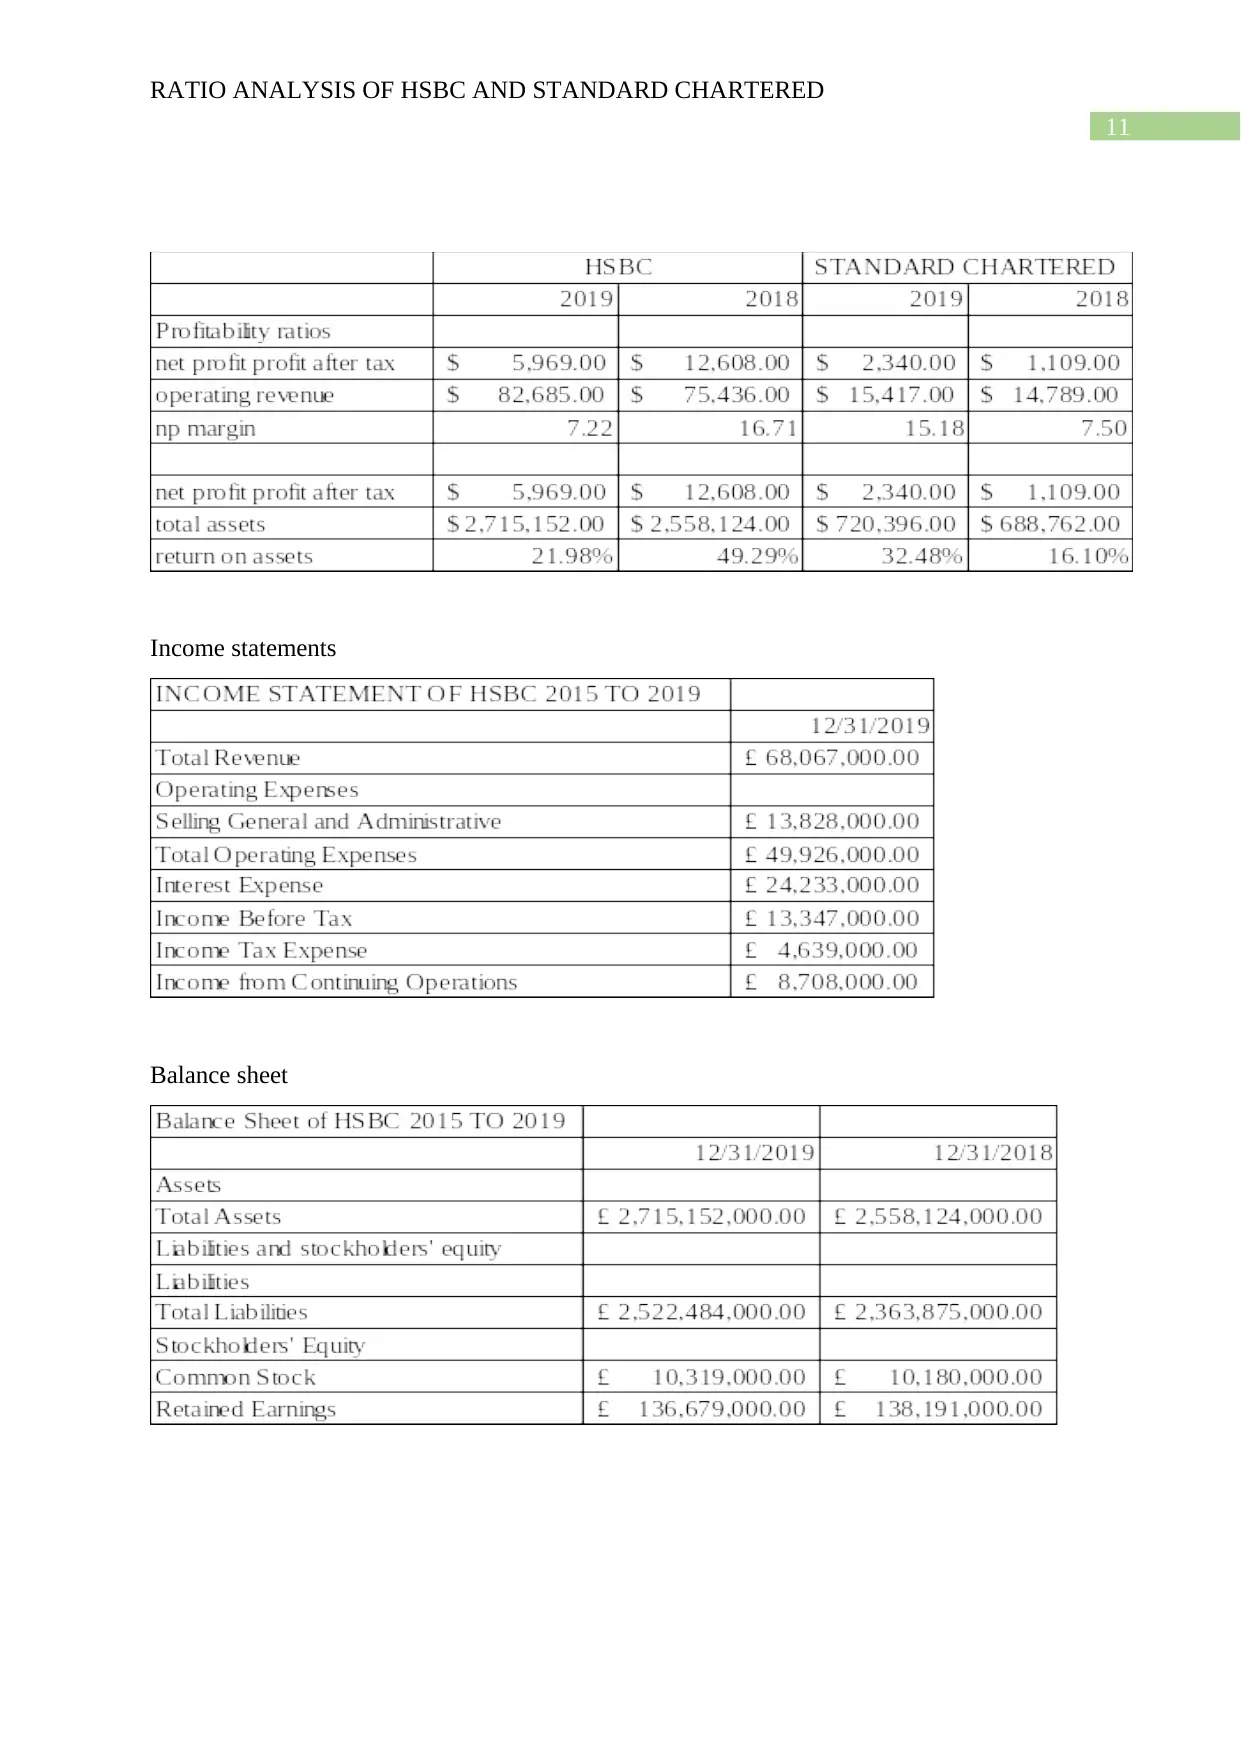
Income statements
Balance sheet
RATIO ANALYSIS OF HSBC AND STANDARD CHARTERED
Income statements
Balance sheet
⊘ This is a preview!⊘
Do you want full access?
Subscribe today to unlock all pages.
Trusted by 1+ million students worldwide
1 out of 16
Related Documents


Your All-in-One AI-Powered Toolkit for Academic Success.
+13062052269
info@desklib.com
Available 24*7 on WhatsApp / Email
![[object Object]](/_next/static/media/star-bottom.7253800d.svg)
Unlock your academic potential
Copyright © 2020–2026 A2Z Services. All Rights Reserved. Developed and managed by ZUCOL.