HSN305 University Report: Nutrition, Activity & Anthropometric
VerifiedAdded on 2023/04/21
|22
|4843
|354
Report
AI Summary
This report presents an analysis of nutrition, physical activity, and anthropometric data collected from a group of university students. The methodology includes food frequency questionnaires, 3-day food records, Active Australia Surveys, and physical activity diaries. Statistical methods such as paired t-tests and Pearson correlations were used to assess relationships between variables like dietary intake, energy expenditure, and body composition. The results highlight nutrient intake levels, potential deficiencies, and differences between assessment methods. The discussion interprets these findings in the context of public health recommendations and the limitations of the assessment techniques. Desklib offers a platform for students to access similar reports and solved assignments.

Running head: HEALTHCARE
Healthcare
Name of the Student:
Name of the University:
Author Note:
Healthcare
Name of the Student:
Name of the University:
Author Note:
Paraphrase This Document
Need a fresh take? Get an instant paraphrase of this document with our AI Paraphraser
1HEALTHCARE
Contents
Introduction......................................................................................................................................2
Methodology....................................................................................................................................3
Result...............................................................................................................................................5
Discussion......................................................................................................................................14
Conclusion and Recommendation.................................................................................................17
Reference.......................................................................................................................................18
2HEALTHCARE
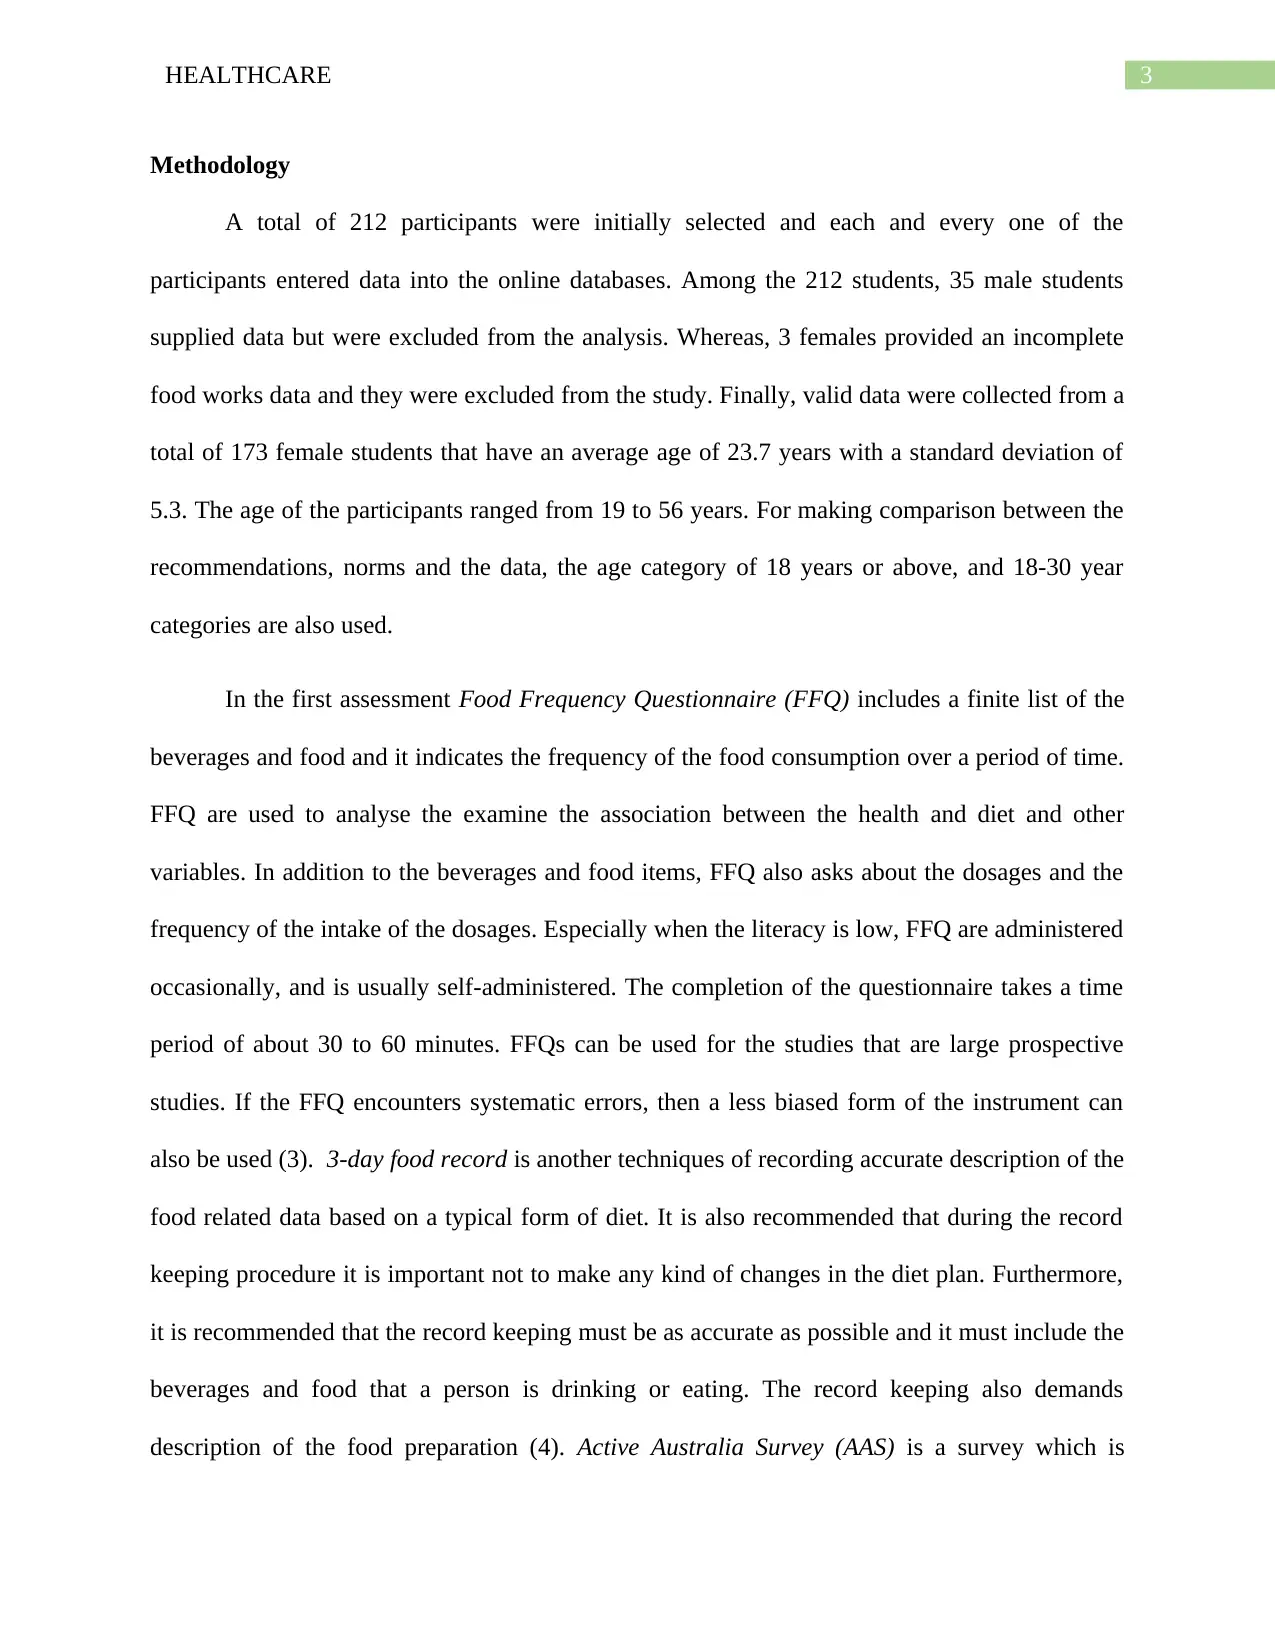
Introduction
The rationale or the background of the study states that physical activity has several
benefits for a person’s health. Physical activity helps a person stay healthy and have a health
body with reduced risk of fractures of bone occurring from the osteoporosis. Unhealthy body
also have increase amount of risks from heart diseases, and other serious illness like cancer. For
majority of the people, it is necessary to participate in the physical activity (1). Whereas,
nutrition also plays a major role in the physical activity because proper nutrition provides the
adequate amount of energy for maintaining a healthy body. A balanced diet means eating
according to the number of servings and it includes each and every food group for majority of
the days. The scientific rationale for nutrition and physical activity assessment will help in
gaining a stronger understanding of physical activity, nutrition through the anthropometric
techniques of assessment (2). The information is presented is a short communication format so
that that it will be easily understandable and will also help in interpretation of the results. The
overall objective of the study is to estimate the dietary intake (calcium) at the individual level
through the short food frequency questionnaire; to compare group dietary intake and individual
dietary intake data with that of the Australian population norms and dietary recommendations; to
compare the relationship between the intake of energy and expenditure results; determination of
the relationship of the energy expenditure with the mean energy intake and the BMI distribution;
to estimate the composition of the body weight with that of circumference, skinfolds, height and
weight and provide a comparison with that of percentage of body fat. Thus, the overall objective
of the study is mainly focused on the nutrient intake and the physical activity through the
different methodologies and procedures.
⊘ This is a preview!⊘
Do you want full access?
Subscribe today to unlock all pages.
Trusted by 1+ million students worldwide
3HEALTHCARE
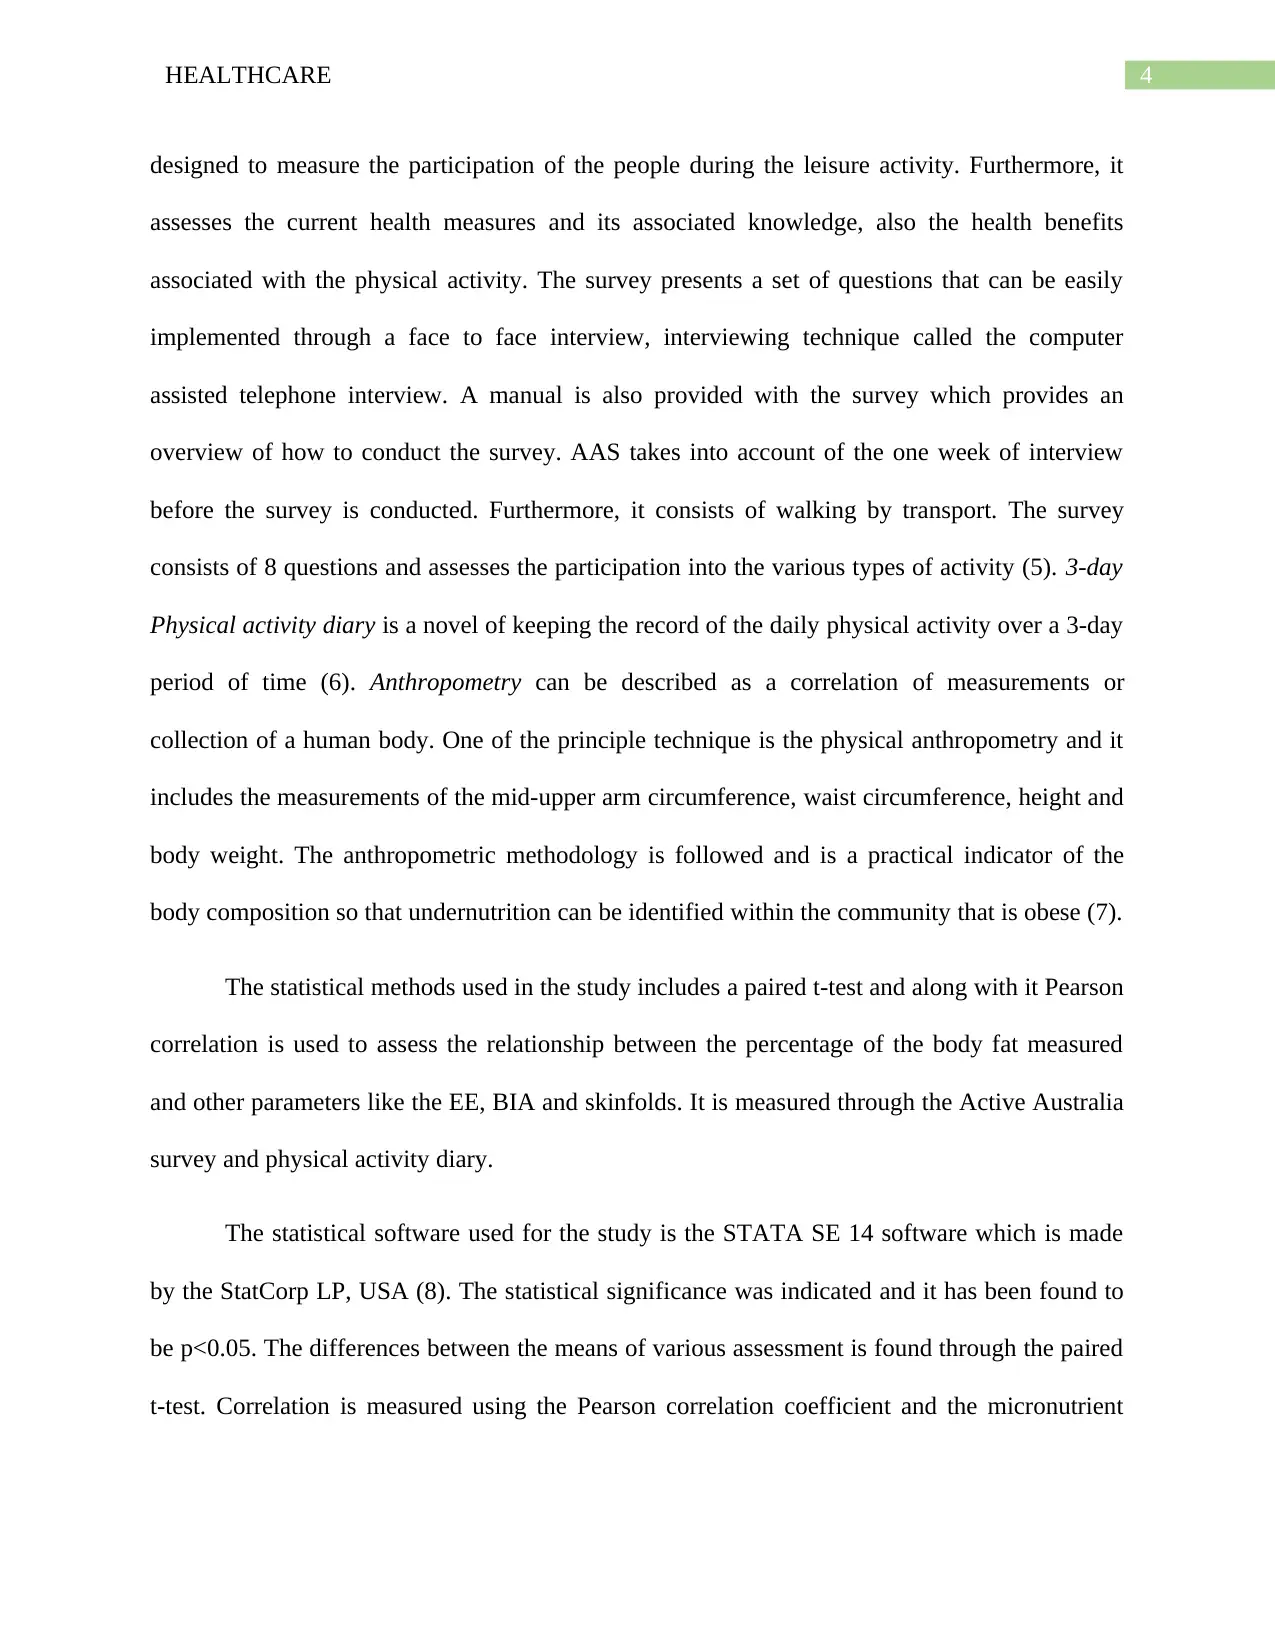
Methodology
A total of 212 participants were initially selected and each and every one of the
participants entered data into the online databases. Among the 212 students, 35 male students
supplied data but were excluded from the analysis. Whereas, 3 females provided an incomplete
food works data and they were excluded from the study. Finally, valid data were collected from a
total of 173 female students that have an average age of 23.7 years with a standard deviation of
5.3. The age of the participants ranged from 19 to 56 years. For making comparison between the
recommendations, norms and the data, the age category of 18 years or above, and 18-30 year
categories are also used.
In the first assessment Food Frequency Questionnaire (FFQ) includes a finite list of the
beverages and food and it indicates the frequency of the food consumption over a period of time.
FFQ are used to analyse the examine the association between the health and diet and other
variables. In addition to the beverages and food items, FFQ also asks about the dosages and the
frequency of the intake of the dosages. Especially when the literacy is low, FFQ are administered
occasionally, and is usually self-administered. The completion of the questionnaire takes a time
period of about 30 to 60 minutes. FFQs can be used for the studies that are large prospective
studies. If the FFQ encounters systematic errors, then a less biased form of the instrument can
also be used (3). 3-day food record is another techniques of recording accurate description of the
food related data based on a typical form of diet. It is also recommended that during the record
keeping procedure it is important not to make any kind of changes in the diet plan. Furthermore,
it is recommended that the record keeping must be as accurate as possible and it must include the
beverages and food that a person is drinking or eating. The record keeping also demands
description of the food preparation (4). Active Australia Survey (AAS) is a survey which is
Paraphrase This Document
Need a fresh take? Get an instant paraphrase of this document with our AI Paraphraser
4HEALTHCARE
designed to measure the participation of the people during the leisure activity. Furthermore, it
assesses the current health measures and its associated knowledge, also the health benefits
associated with the physical activity. The survey presents a set of questions that can be easily
implemented through a face to face interview, interviewing technique called the computer
assisted telephone interview. A manual is also provided with the survey which provides an
overview of how to conduct the survey. AAS takes into account of the one week of interview
before the survey is conducted. Furthermore, it consists of walking by transport. The survey
consists of 8 questions and assesses the participation into the various types of activity (5). 3-day
Physical activity diary is a novel of keeping the record of the daily physical activity over a 3-day
period of time (6). Anthropometry can be described as a correlation of measurements or
collection of a human body. One of the principle technique is the physical anthropometry and it
includes the measurements of the mid-upper arm circumference, waist circumference, height and
body weight. The anthropometric methodology is followed and is a practical indicator of the
body composition so that undernutrition can be identified within the community that is obese (7).
The statistical methods used in the study includes a paired t-test and along with it Pearson
correlation is used to assess the relationship between the percentage of the body fat measured
and other parameters like the EE, BIA and skinfolds. It is measured through the Active Australia
survey and physical activity diary.
The statistical software used for the study is the STATA SE 14 software which is made
by the StatCorp LP, USA (8). The statistical significance was indicated and it has been found to
be p<0.05. The differences between the means of various assessment is found through the paired
t-test. Correlation is measured using the Pearson correlation coefficient and the micronutrient

5HEALTHCARE
intake inadequacy is measured by an EAR-cut point method (for the zinc, vitamin c, folate and
calcium) and full probability approach is followed (for iron).
intake inadequacy is measured by an EAR-cut point method (for the zinc, vitamin c, folate and
calcium) and full probability approach is followed (for iron).
⊘ This is a preview!⊘
Do you want full access?
Subscribe today to unlock all pages.
Trusted by 1+ million students worldwide
6HEALTHCARE
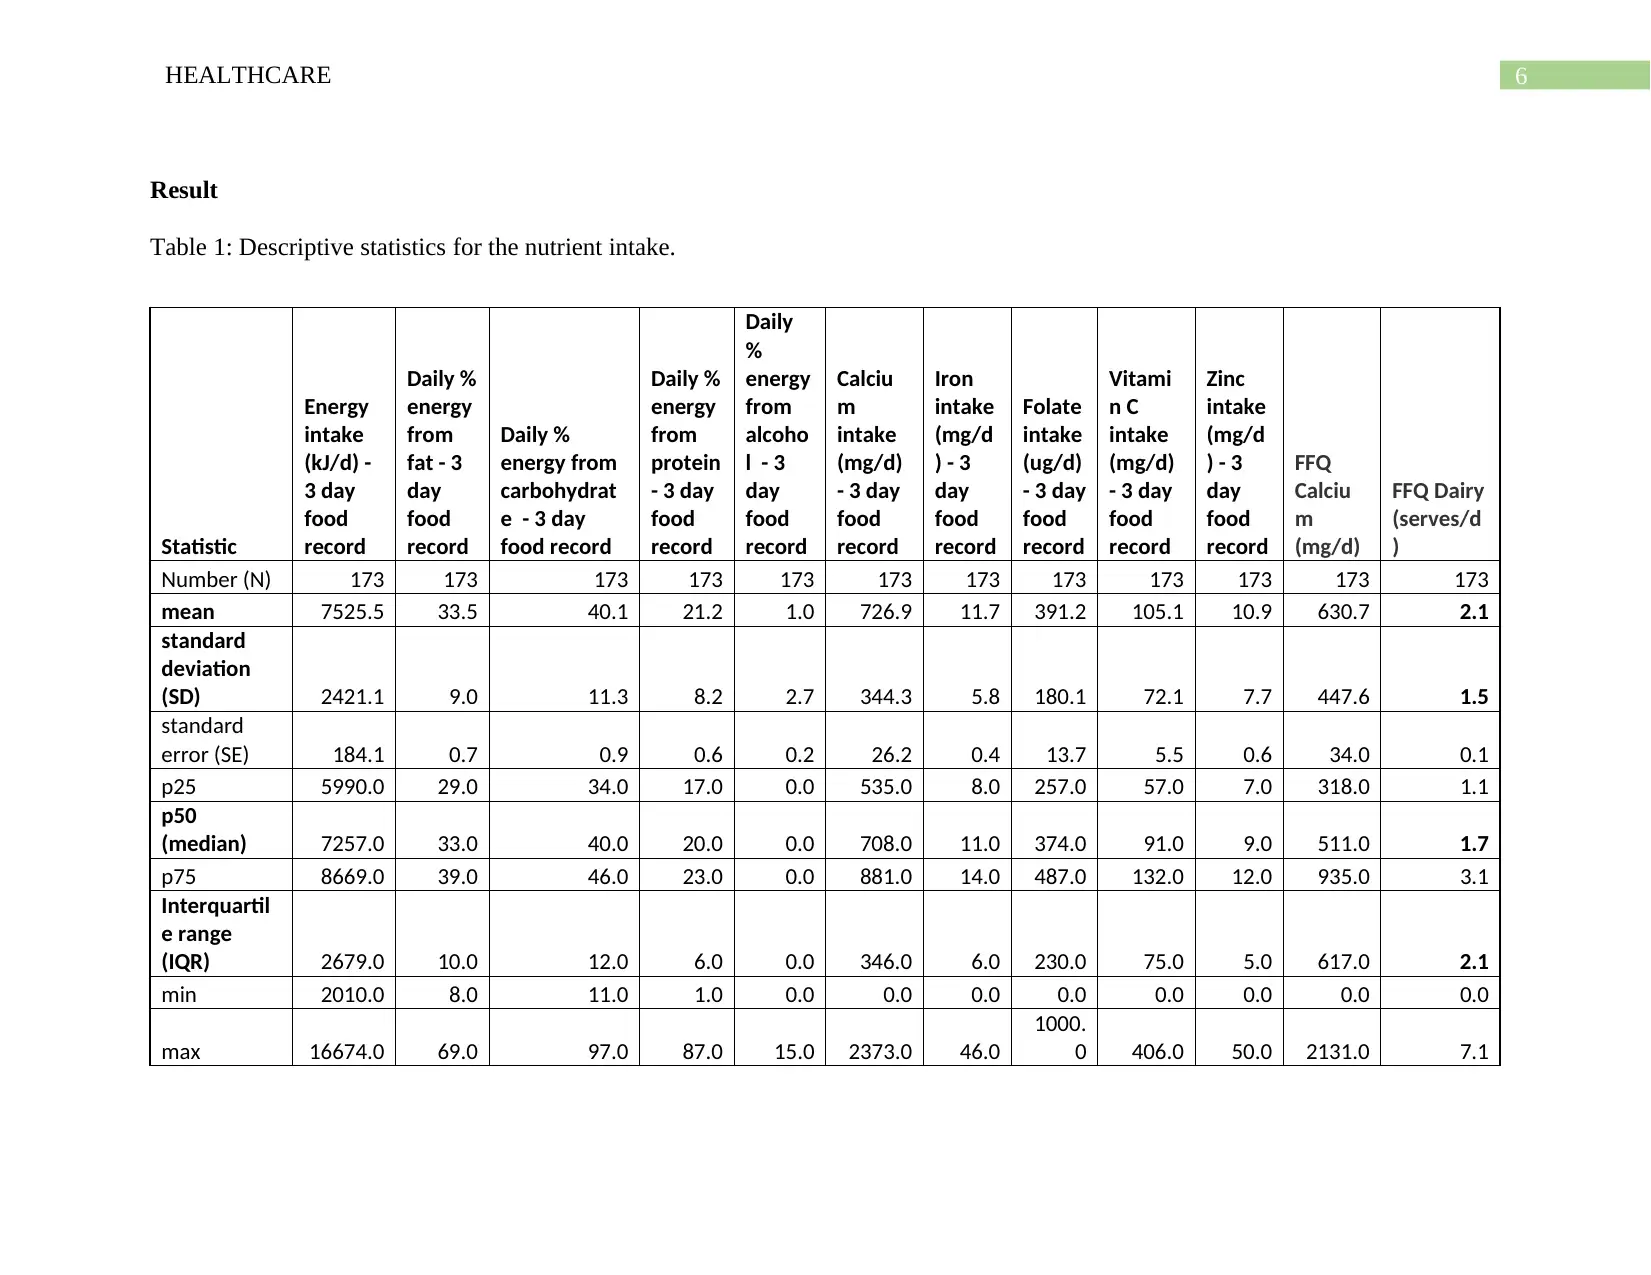
Result
Table 1: Descriptive statistics for the nutrient intake.
Statistic
Energy
intake
(kJ/d) -
3 day
food
record
Daily %
energy
from
fat - 3
day
food
record
Daily %
energy from
carbohydrat
e - 3 day
food record
Daily %
energy
from
protein
- 3 day
food
record
Daily
%
energy
from
alcoho
l - 3
day
food
record
Calciu
m
intake
(mg/d)
- 3 day
food
record
Iron
intake
(mg/d
) - 3
day
food
record
Folate
intake
(ug/d)
- 3 day
food
record
Vitami
n C
intake
(mg/d)
- 3 day
food
record
Zinc
intake
(mg/d
) - 3
day
food
record
FFQ
Calciu
m
(mg/d)
FFQ Dairy
(serves/d
)
Number (N) 173 173 173 173 173 173 173 173 173 173 173 173
mean 7525.5 33.5 40.1 21.2 1.0 726.9 11.7 391.2 105.1 10.9 630.7 2.1
standard
deviation
(SD) 2421.1 9.0 11.3 8.2 2.7 344.3 5.8 180.1 72.1 7.7 447.6 1.5
standard
error (SE) 184.1 0.7 0.9 0.6 0.2 26.2 0.4 13.7 5.5 0.6 34.0 0.1
p25 5990.0 29.0 34.0 17.0 0.0 535.0 8.0 257.0 57.0 7.0 318.0 1.1
p50
(median) 7257.0 33.0 40.0 20.0 0.0 708.0 11.0 374.0 91.0 9.0 511.0 1.7
p75 8669.0 39.0 46.0 23.0 0.0 881.0 14.0 487.0 132.0 12.0 935.0 3.1
Interquartil
e range
(IQR) 2679.0 10.0 12.0 6.0 0.0 346.0 6.0 230.0 75.0 5.0 617.0 2.1
min 2010.0 8.0 11.0 1.0 0.0 0.0 0.0 0.0 0.0 0.0 0.0 0.0
max 16674.0 69.0 97.0 87.0 15.0 2373.0 46.0
1000.
0 406.0 50.0 2131.0 7.1
Paraphrase This Document
Need a fresh take? Get an instant paraphrase of this document with our AI Paraphraser
7HEALTHCARE
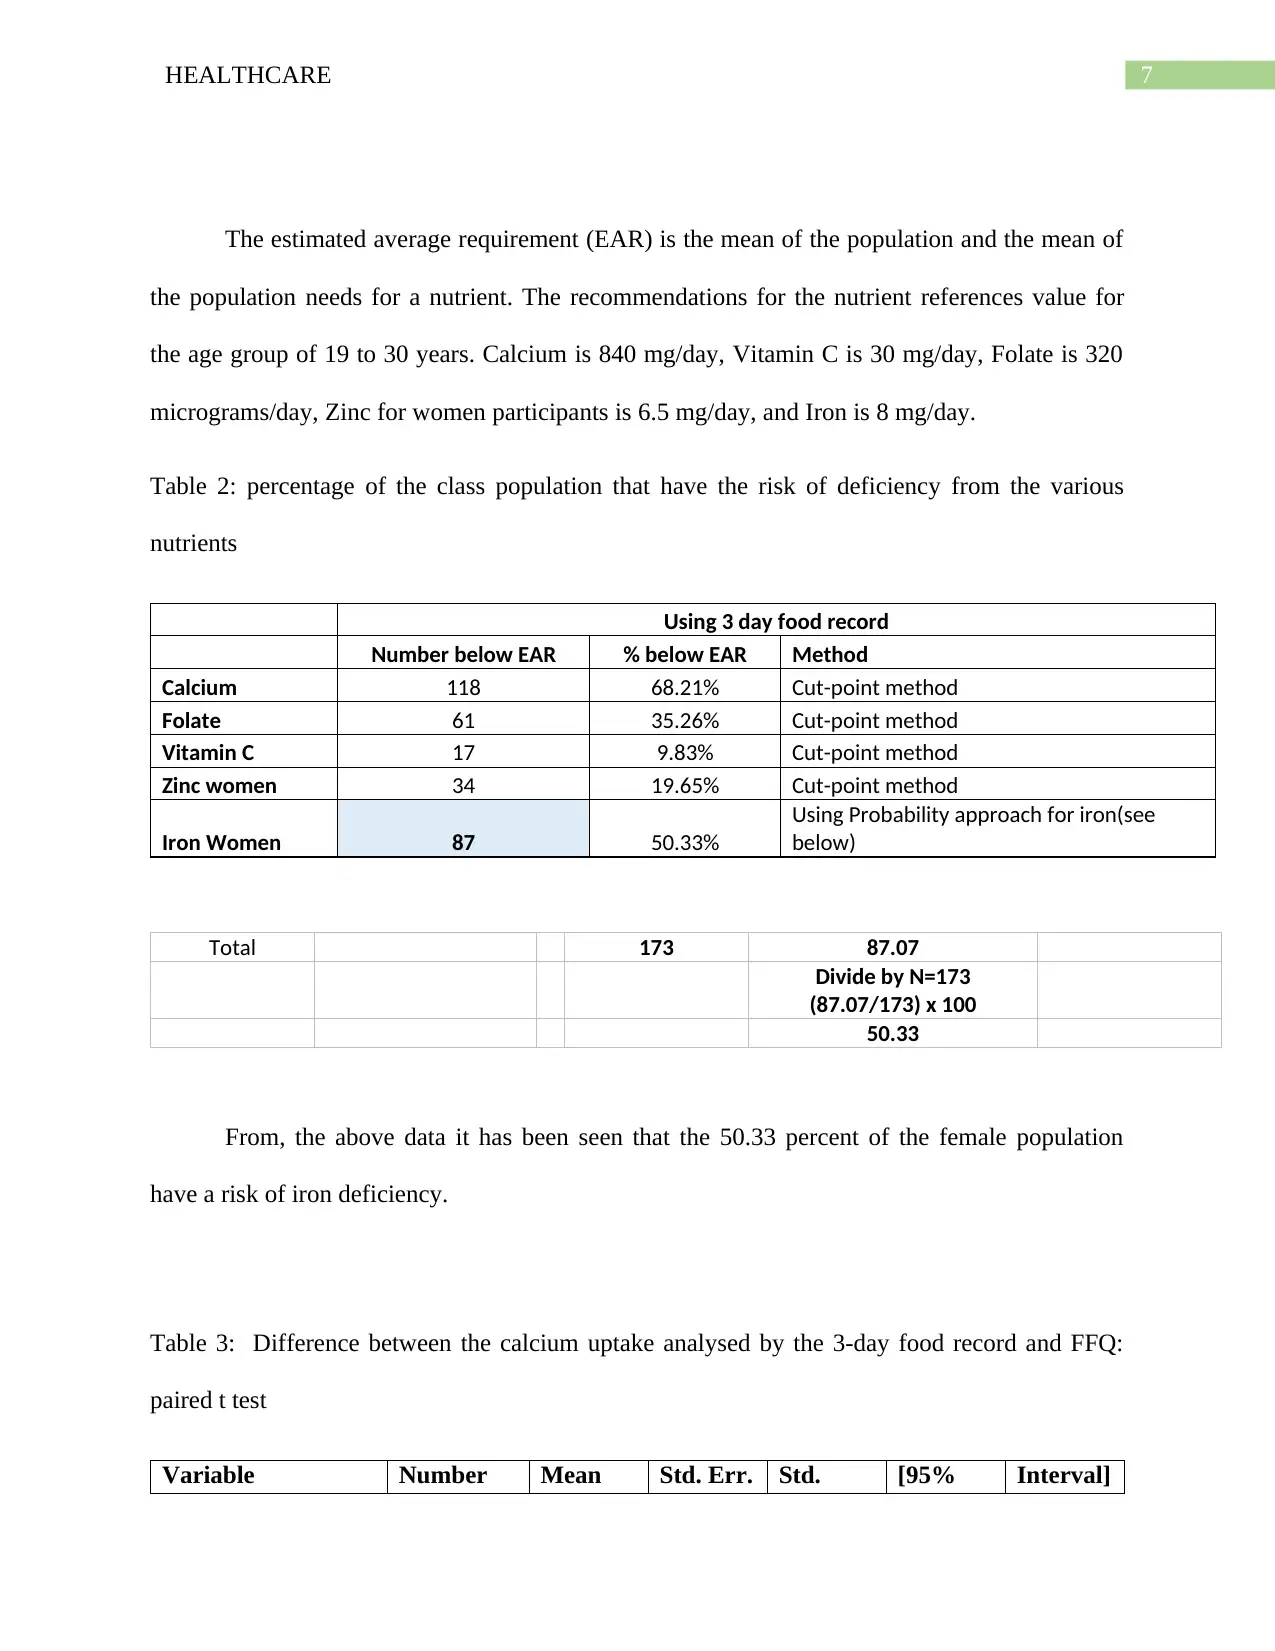
The estimated average requirement (EAR) is the mean of the population and the mean of
the population needs for a nutrient. The recommendations for the nutrient references value for
the age group of 19 to 30 years. Calcium is 840 mg/day, Vitamin C is 30 mg/day, Folate is 320
micrograms/day, Zinc for women participants is 6.5 mg/day, and Iron is 8 mg/day.
Table 2: percentage of the class population that have the risk of deficiency from the various
nutrients
Using 3 day food record
Number below EAR % below EAR Method
Calcium 118 68.21% Cut-point method
Folate 61 35.26% Cut-point method
Vitamin C 17 9.83% Cut-point method
Zinc women 34 19.65% Cut-point method
Iron Women 87 50.33%
Using Probability approach for iron(see
below)
Total 173 87.07
Divide by N=173
(87.07/173) x 100
50.33
From, the above data it has been seen that the 50.33 percent of the female population
have a risk of iron deficiency.
Table 3: Difference between the calcium uptake analysed by the 3-day food record and FFQ:
paired t test
Variable Number Mean Std. Err. Std. [95% Interval]
8HEALTHCARE
(N) Dev. Conf.
FFQ Calcium intake
(mg/d)
173 630.7 34.0 447.6 563.5 697.9
3-day food record
Calcium intake
(mg/d)
173 726.9 26.2 344.3 675.3 778.6
Difference 173 -96.2 35.0 460.3 -165.3 -27.1
T= -2.74, degrees of freedom=172, P-value=0.001
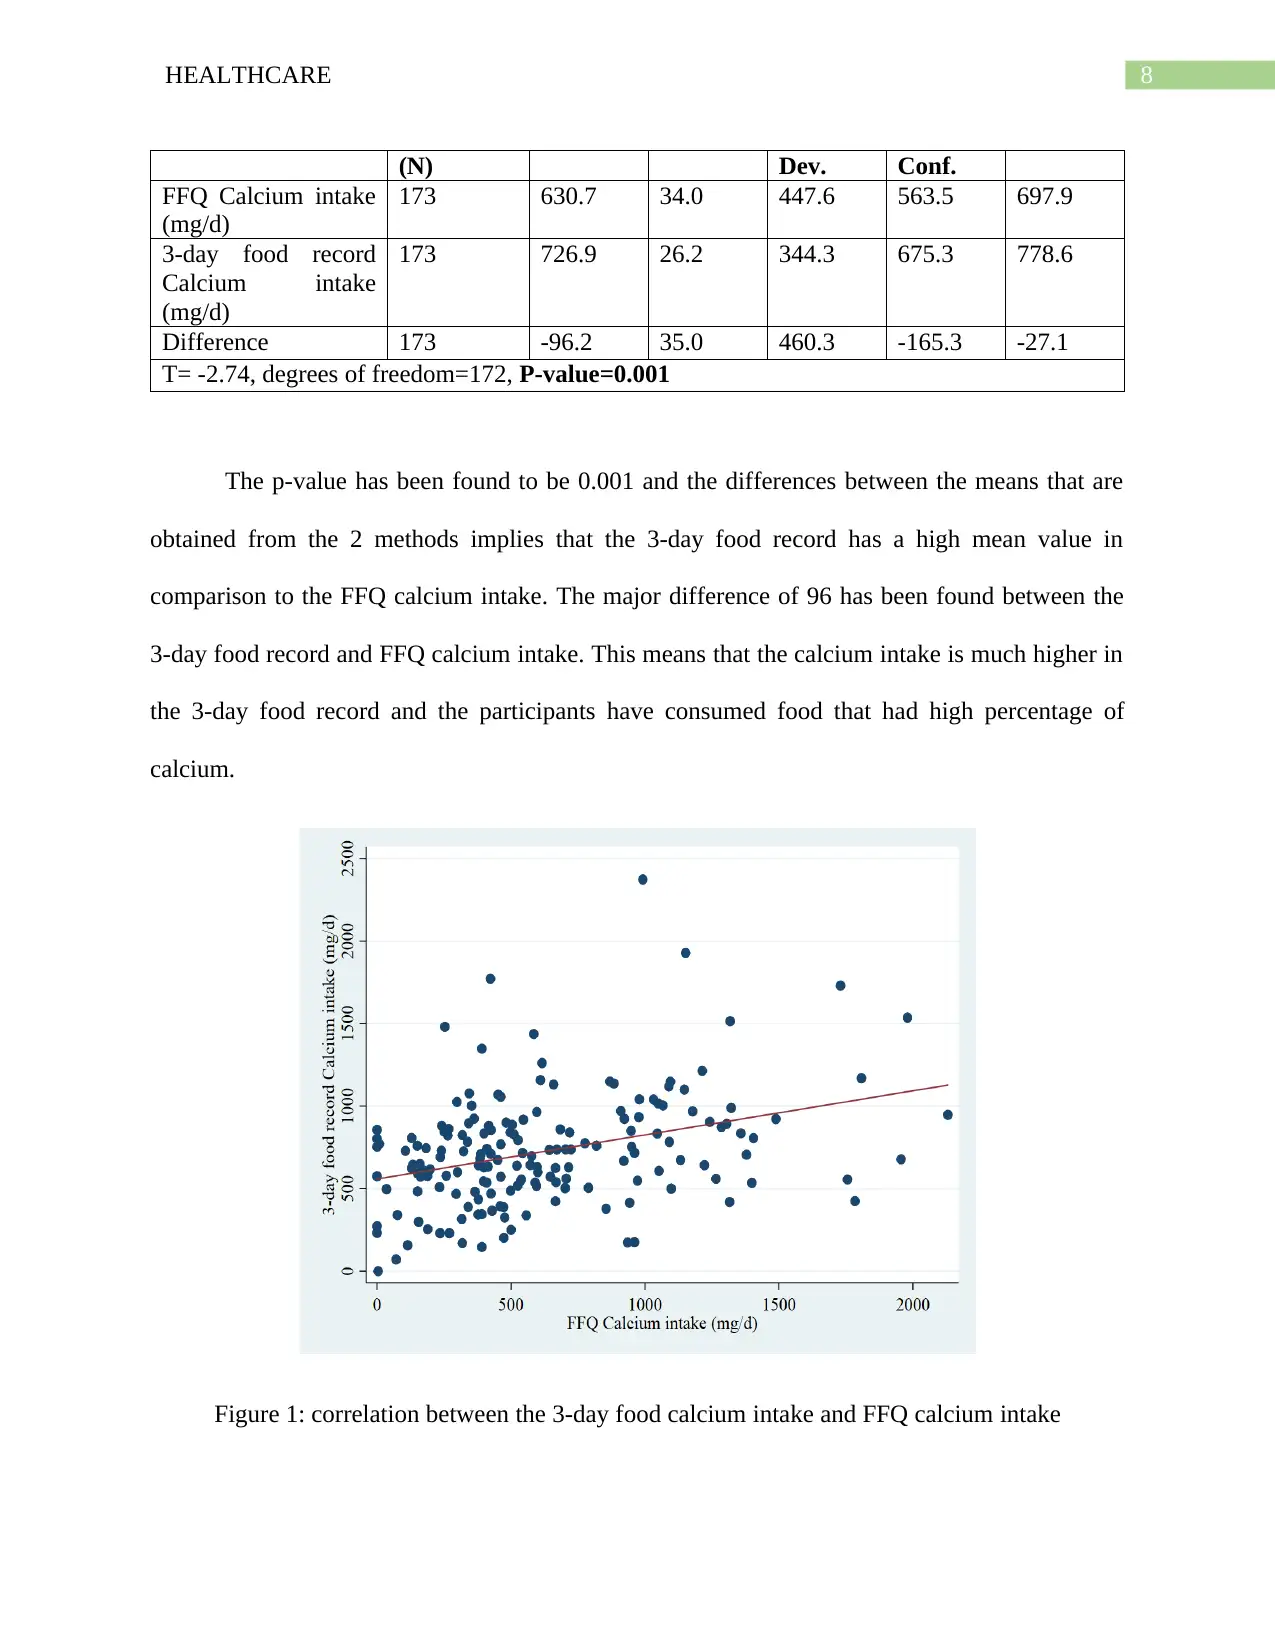
The p-value has been found to be 0.001 and the differences between the means that are
obtained from the 2 methods implies that the 3-day food record has a high mean value in
comparison to the FFQ calcium intake. The major difference of 96 has been found between the
3-day food record and FFQ calcium intake. This means that the calcium intake is much higher in
the 3-day food record and the participants have consumed food that had high percentage of
calcium.
Figure 1: correlation between the 3-day food calcium intake and FFQ calcium intake
(N) Dev. Conf.
FFQ Calcium intake
(mg/d)
173 630.7 34.0 447.6 563.5 697.9
3-day food record
Calcium intake
(mg/d)
173 726.9 26.2 344.3 675.3 778.6
Difference 173 -96.2 35.0 460.3 -165.3 -27.1
T= -2.74, degrees of freedom=172, P-value=0.001
The p-value has been found to be 0.001 and the differences between the means that are
obtained from the 2 methods implies that the 3-day food record has a high mean value in
comparison to the FFQ calcium intake. The major difference of 96 has been found between the
3-day food record and FFQ calcium intake. This means that the calcium intake is much higher in
the 3-day food record and the participants have consumed food that had high percentage of
calcium.
Figure 1: correlation between the 3-day food calcium intake and FFQ calcium intake
⊘ This is a preview!⊘
Do you want full access?
Subscribe today to unlock all pages.
Trusted by 1+ million students worldwide
9HEALTHCARE
Table 4: percentage of the class population presents the percentage of people that are meeting or
are above the recommended daily intake.
Macronutrient (Recommended
Percentage of Daily Energy Intake)
Percentage Below
Recommended
Percentage
Above
Recommended
Percentage
Meeting
Recommended
Fat (20-35%) 5 39 56
Carbohydrate (45-65%) 68 2 30
Protein (15-25%) 9 20 71
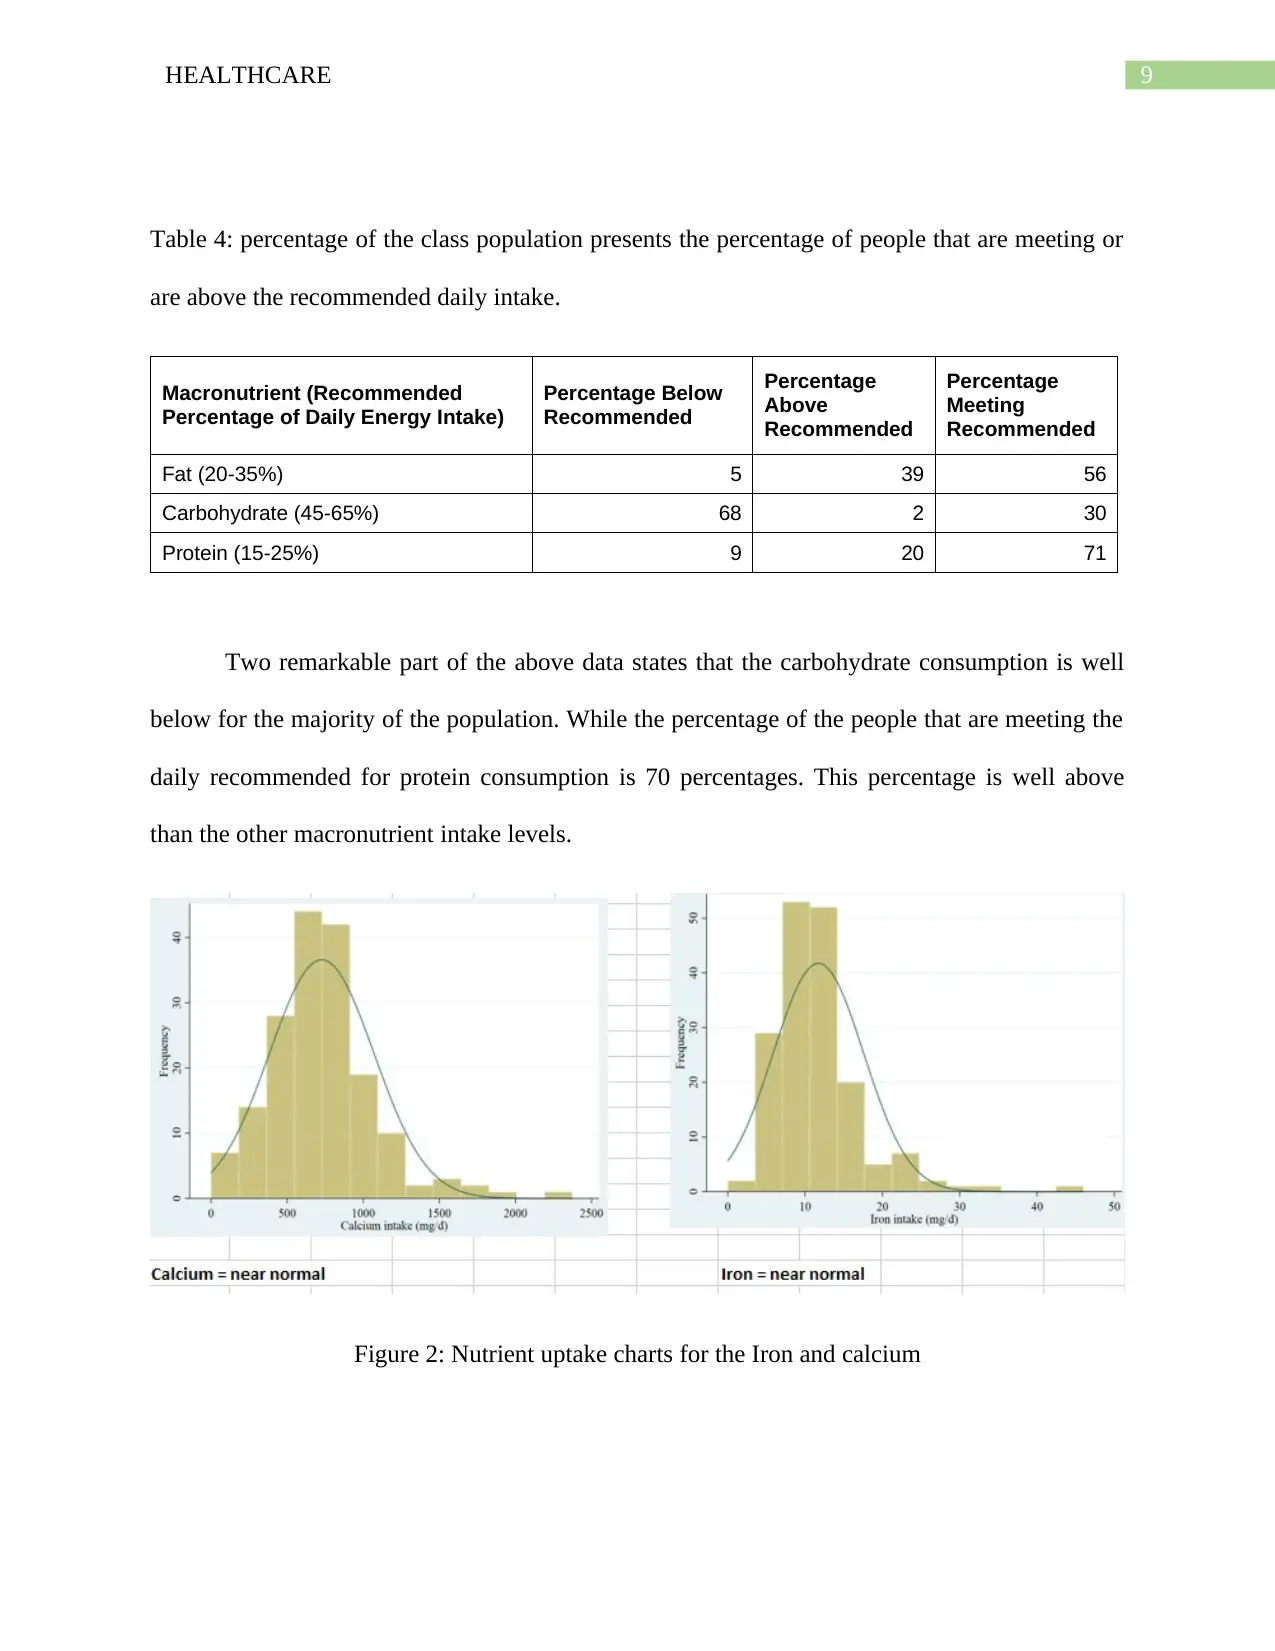
Two remarkable part of the above data states that the carbohydrate consumption is well
below for the majority of the population. While the percentage of the people that are meeting the
daily recommended for protein consumption is 70 percentages. This percentage is well above
than the other macronutrient intake levels.
Figure 2: Nutrient uptake charts for the Iron and calcium
Table 4: percentage of the class population presents the percentage of people that are meeting or
are above the recommended daily intake.
Macronutrient (Recommended
Percentage of Daily Energy Intake)
Percentage Below
Recommended
Percentage
Above
Recommended
Percentage
Meeting
Recommended
Fat (20-35%) 5 39 56
Carbohydrate (45-65%) 68 2 30
Protein (15-25%) 9 20 71
Two remarkable part of the above data states that the carbohydrate consumption is well
below for the majority of the population. While the percentage of the people that are meeting the
daily recommended for protein consumption is 70 percentages. This percentage is well above
than the other macronutrient intake levels.
Figure 2: Nutrient uptake charts for the Iron and calcium
Paraphrase This Document
Need a fresh take? Get an instant paraphrase of this document with our AI Paraphraser
10HEALTHCARE
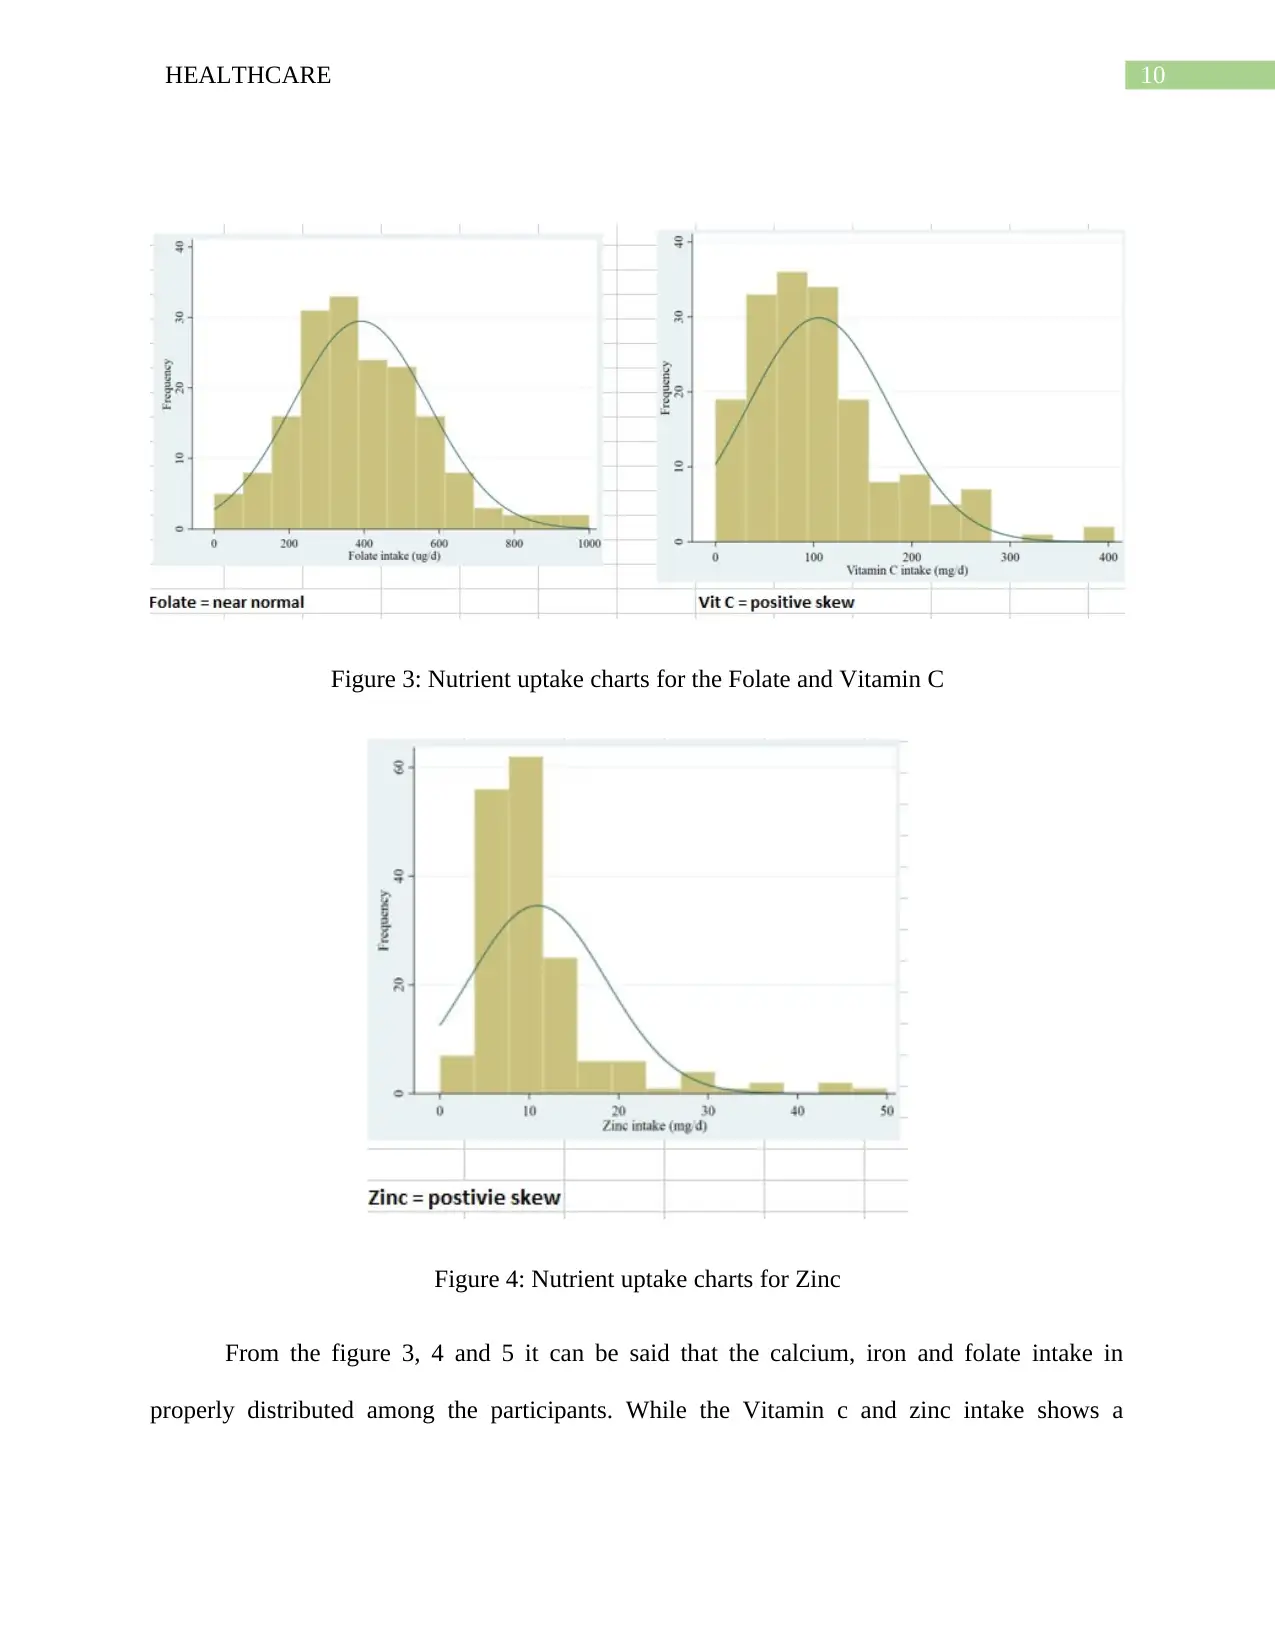
Figure 3: Nutrient uptake charts for the Folate and Vitamin C
Figure 4: Nutrient uptake charts for Zinc
From the figure 3, 4 and 5 it can be said that the calcium, iron and folate intake in
properly distributed among the participants. While the Vitamin c and zinc intake shows a
Figure 3: Nutrient uptake charts for the Folate and Vitamin C
Figure 4: Nutrient uptake charts for Zinc
From the figure 3, 4 and 5 it can be said that the calcium, iron and folate intake in
properly distributed among the participants. While the Vitamin c and zinc intake shows a
11HEALTHCARE
positive skew data. This means that majority of the people takes low amount of zinc and vitamin
c on an everyday basis.
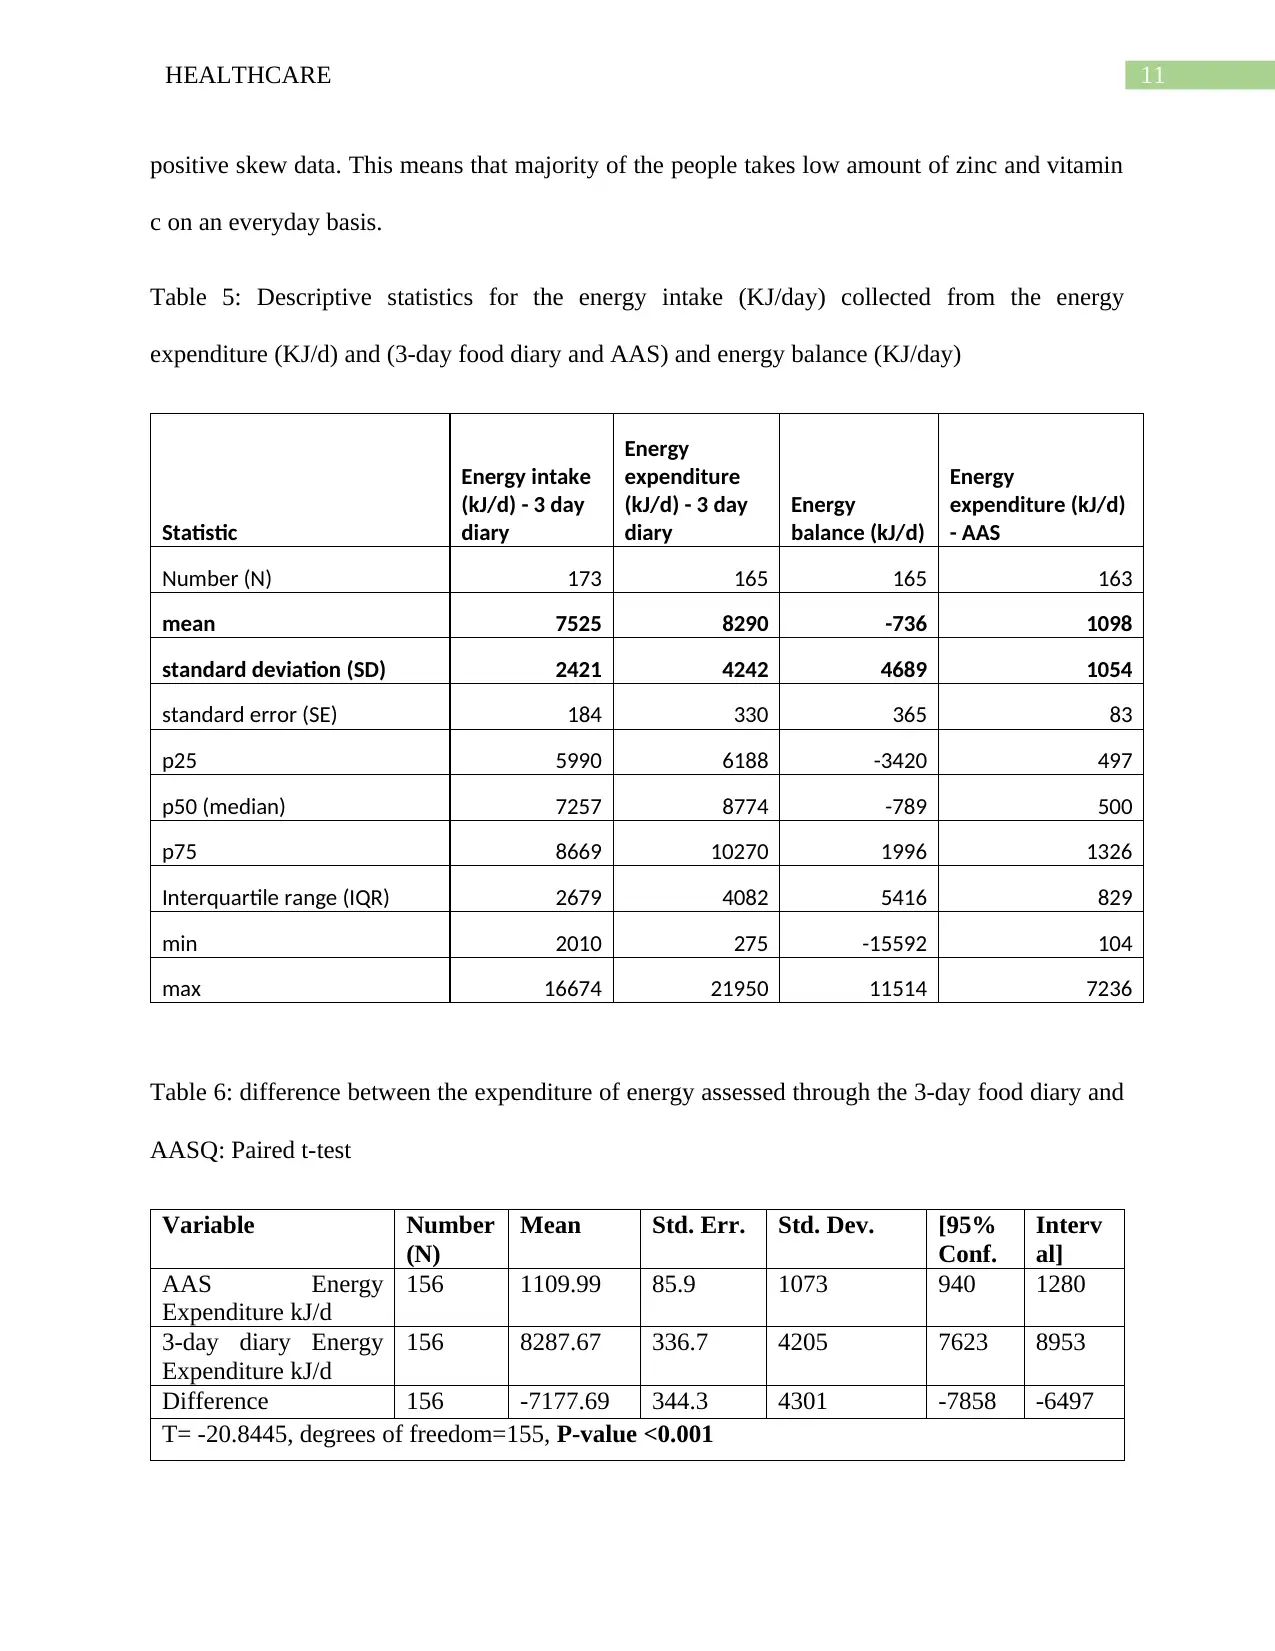
Table 5: Descriptive statistics for the energy intake (KJ/day) collected from the energy
expenditure (KJ/d) and (3-day food diary and AAS) and energy balance (KJ/day)
Statistic
Energy intake
(kJ/d) - 3 day
diary
Energy
expenditure
(kJ/d) - 3 day
diary
Energy
balance (kJ/d)
Energy
expenditure (kJ/d)
- AAS
Number (N) 173 165 165 163
mean 7525 8290 -736 1098
standard deviation (SD) 2421 4242 4689 1054
standard error (SE) 184 330 365 83
p25 5990 6188 -3420 497
p50 (median) 7257 8774 -789 500
p75 8669 10270 1996 1326
Interquartile range (IQR) 2679 4082 5416 829
min 2010 275 -15592 104
max 16674 21950 11514 7236
Table 6: difference between the expenditure of energy assessed through the 3-day food diary and
AASQ: Paired t-test
Variable Number
(N)
Mean Std. Err. Std. Dev. [95%
Conf.
Interv
al]
AAS Energy
Expenditure kJ/d
156 1109.99 85.9 1073 940 1280
3-day diary Energy
Expenditure kJ/d
156 8287.67 336.7 4205 7623 8953
Difference 156 -7177.69 344.3 4301 -7858 -6497
T= -20.8445, degrees of freedom=155, P-value <0.001
positive skew data. This means that majority of the people takes low amount of zinc and vitamin
c on an everyday basis.
Table 5: Descriptive statistics for the energy intake (KJ/day) collected from the energy
expenditure (KJ/d) and (3-day food diary and AAS) and energy balance (KJ/day)
Statistic
Energy intake
(kJ/d) - 3 day
diary
Energy
expenditure
(kJ/d) - 3 day
diary
Energy
balance (kJ/d)
Energy
expenditure (kJ/d)
- AAS
Number (N) 173 165 165 163
mean 7525 8290 -736 1098
standard deviation (SD) 2421 4242 4689 1054
standard error (SE) 184 330 365 83
p25 5990 6188 -3420 497
p50 (median) 7257 8774 -789 500
p75 8669 10270 1996 1326
Interquartile range (IQR) 2679 4082 5416 829
min 2010 275 -15592 104
max 16674 21950 11514 7236
Table 6: difference between the expenditure of energy assessed through the 3-day food diary and
AASQ: Paired t-test
Variable Number
(N)
Mean Std. Err. Std. Dev. [95%
Conf.
Interv
al]
AAS Energy
Expenditure kJ/d
156 1109.99 85.9 1073 940 1280
3-day diary Energy
Expenditure kJ/d
156 8287.67 336.7 4205 7623 8953
Difference 156 -7177.69 344.3 4301 -7858 -6497
T= -20.8445, degrees of freedom=155, P-value <0.001
⊘ This is a preview!⊘
Do you want full access?
Subscribe today to unlock all pages.
Trusted by 1+ million students worldwide
1 out of 22
Related Documents


Your All-in-One AI-Powered Toolkit for Academic Success.
+13062052269
info@desklib.com
Available 24*7 on WhatsApp / Email
![[object Object]](/_next/static/media/star-bottom.7253800d.svg)
Unlock your academic potential
Copyright © 2020–2026 A2Z Services. All Rights Reserved. Developed and managed by ZUCOL.