Hubbard Foods Limited: Analysis of Market Trends and Performance

Verified

Added on  2023/04/19

|10
|1535
|429
Report
AI Summary
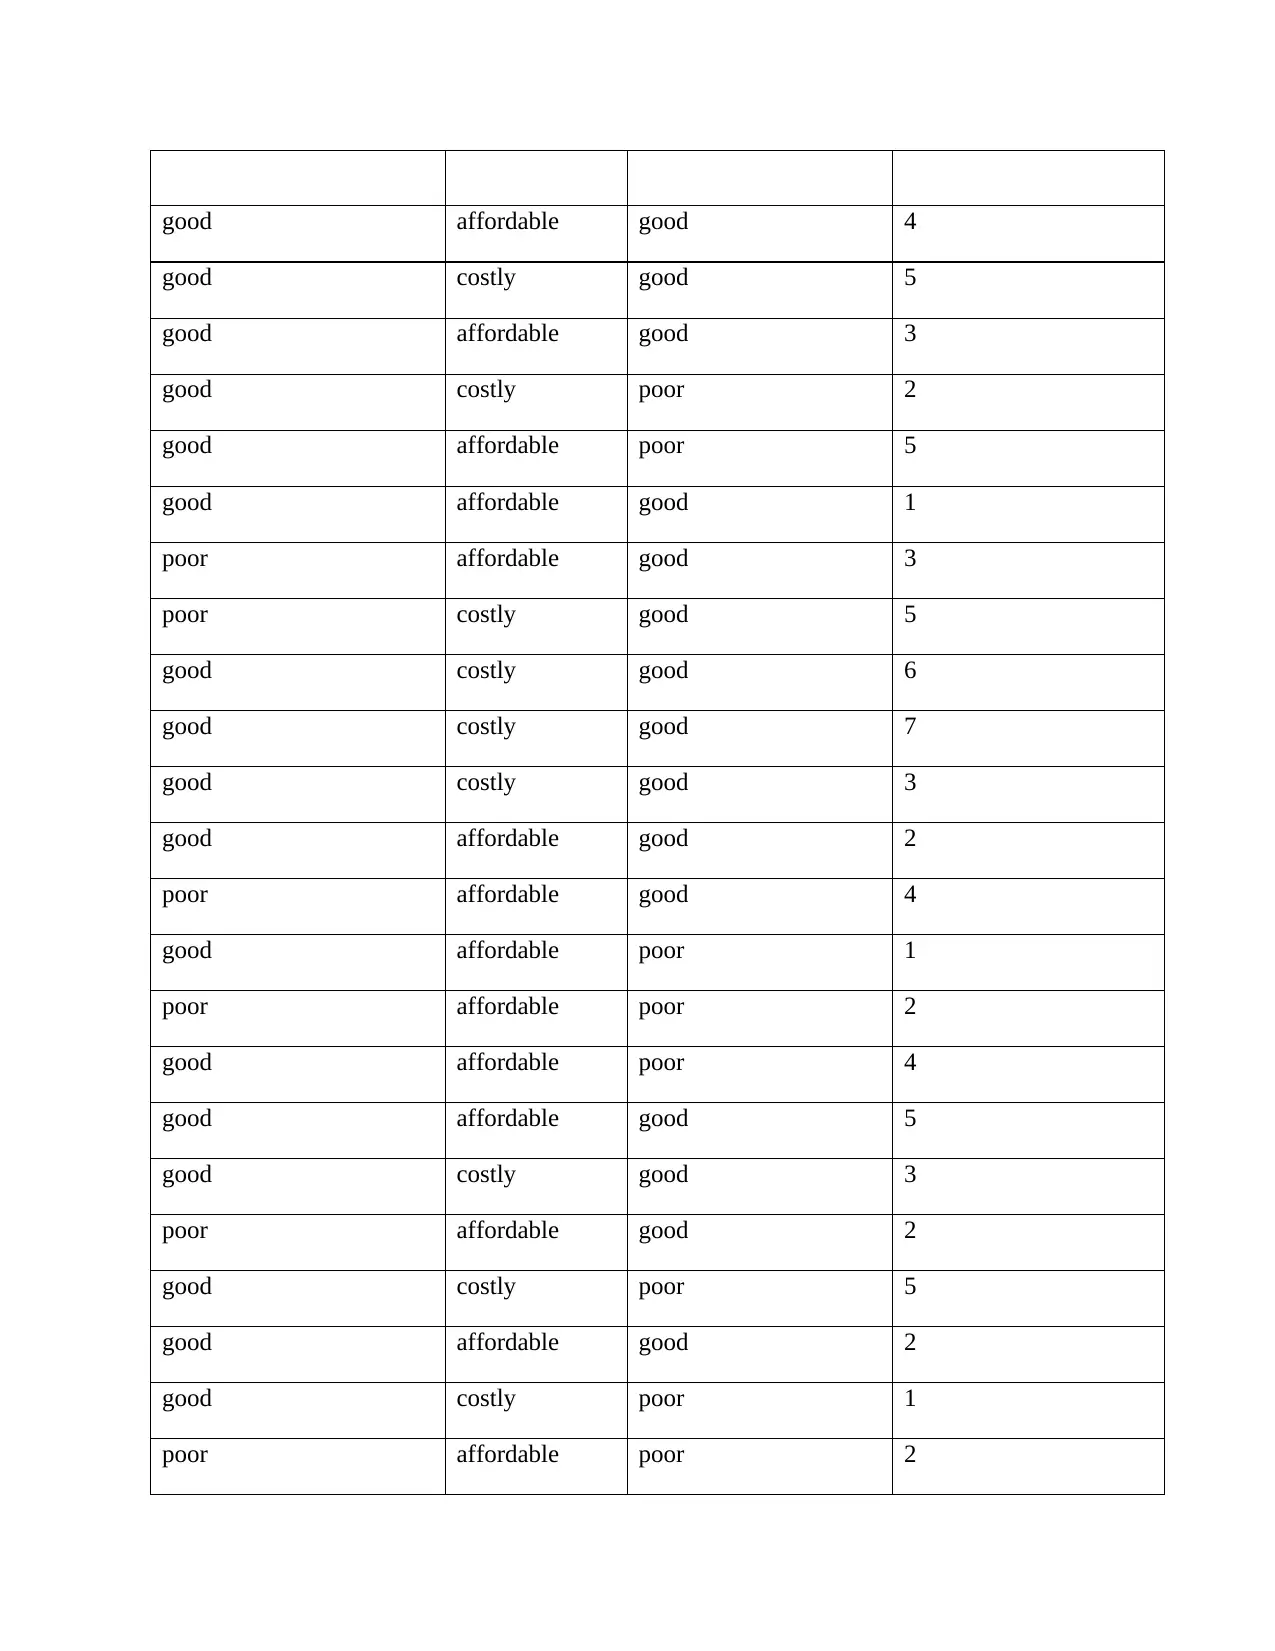
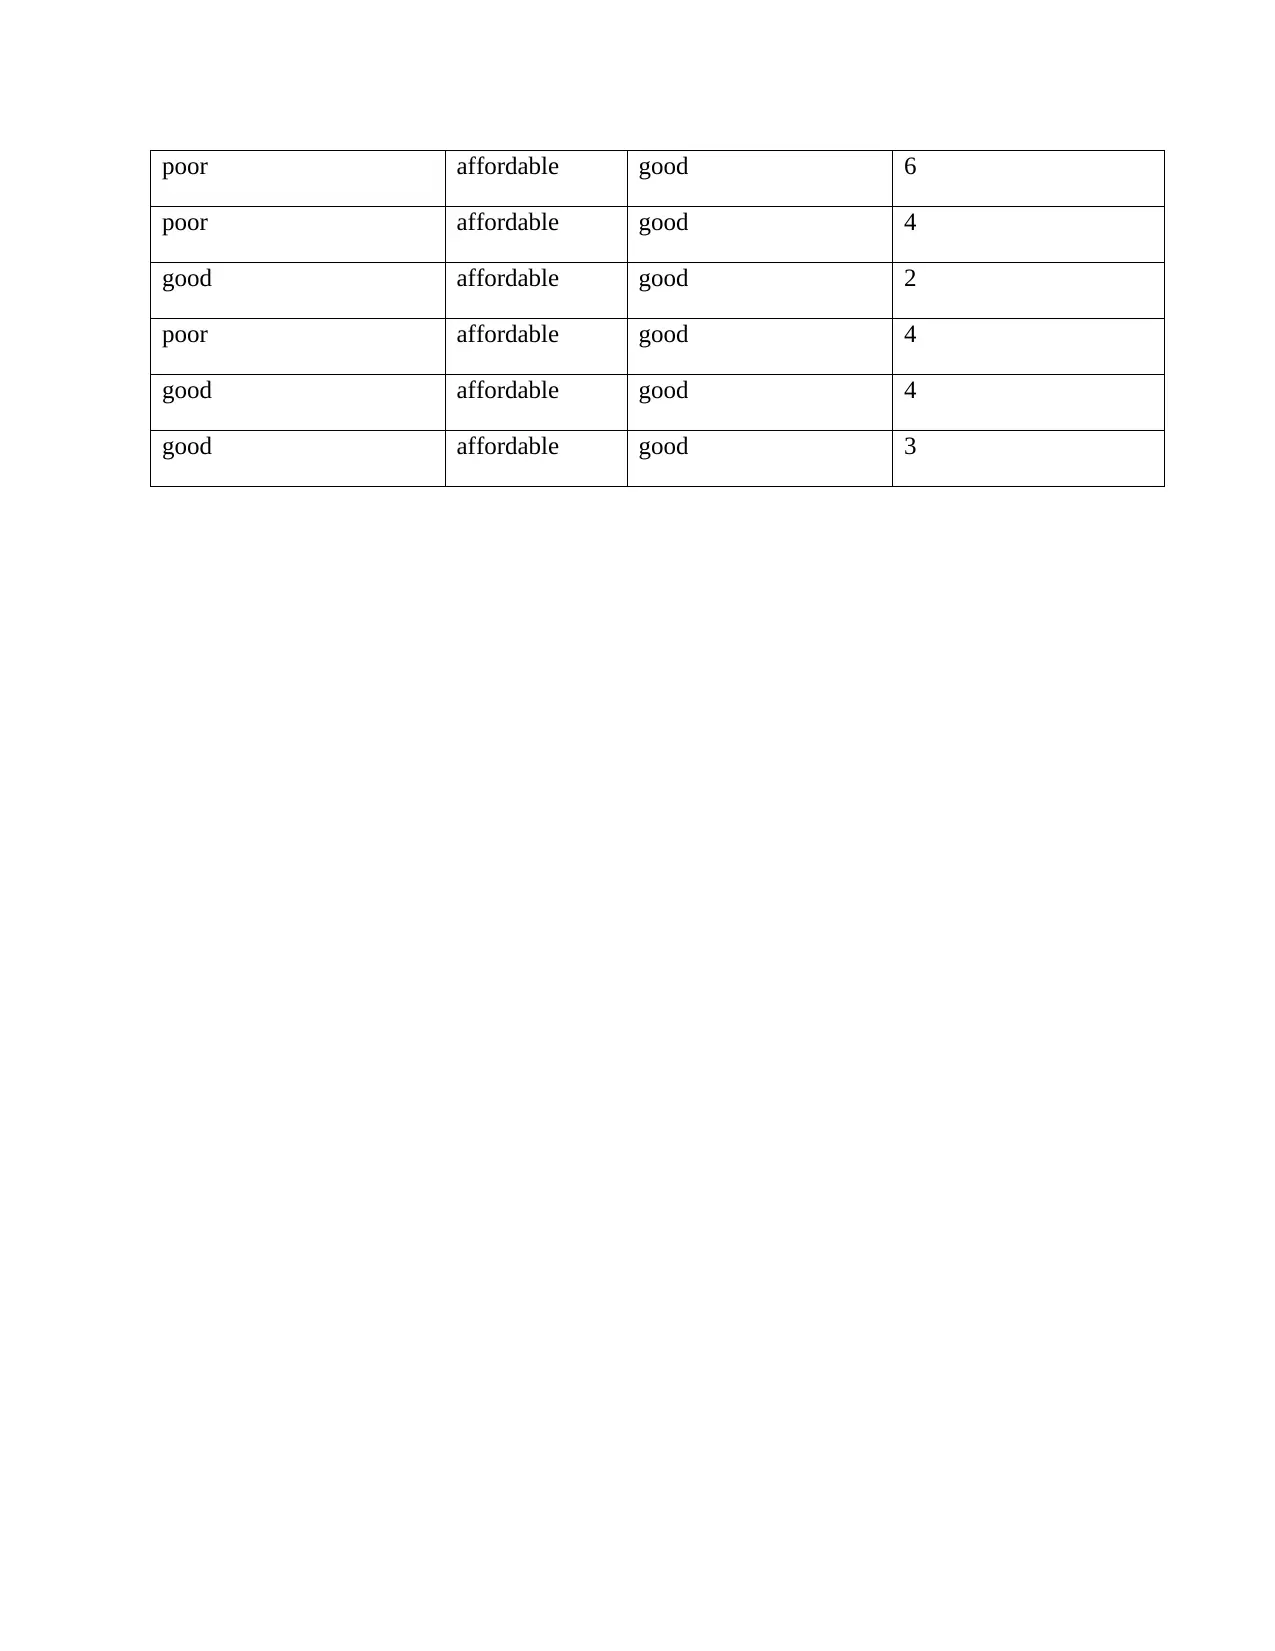
This report provides a comprehensive analysis of Hubbard Foods Limited, a New Zealand-based breakfast cereal company. The study investigates the company's organizational structure, marketing strategies, and market performance through the analysis of secondary data from the company's website and other sources. The report employs both quantitative and qualitative research techniques, including descriptive and inferential statistics, correlation, and regression analysis, to assess the impact of factors such as customer relations, pricing, and product quality on sales performance. The findings reveal that product quality, customer relations, and pricing positively affect the frequency of customer purchases, with product quality having the most significant influence. The report concludes that Hubbard Foods Limited's success is attributed to its strong customer relations, high-quality products, and effective pricing strategies, emphasizing the importance of continuous improvement in these areas to maintain its market dominance. The analysis also compares Hubbard Foods Limited to its competitors like Lian Huat, Cucina, and Choice Egg Noodle, providing insights into their respective market positions.
Document Page
Introduction
Demand for breakfast commodities is always on the rise and the trend will continue to persist
(1). However, stiff competition is on the rise in the industry that deals with the manufacture of
breakfast products. Companies therefore ought to come up with marketing strategies that ensure
they stand out among their competitors in this industry. This report takes a look at the case study
of Hubbard Foods Limited.
The aim of this report is to explore the organizational structure and marketing strategies put in
place by Hubbard Foods Limited to ensure its persistent performance in the market. Data is
collected and market trends analyzed using various statistical tools. The report tries to investigate
some of the factors that lead to the success of a business organization. Market trends are
analyzed to show the general direction or market position of Hubbard Foods Limited. These
trends are compared to those of other companies competing with Hubbard Foods Limited.
Organizational profile
Hubbard Foods Ltd is a New Zealand based company that deals in the manufacture of breakfast
cereals. It was started in 1989, and deals in a range of breakfast products among them Muesli,
Thank goodness Gluten Free, and Light and Right. The organization has its headquarter in
Auckland but exports its products to other states of New Zealand, Australia and other countries
in Asia and Europe. Its main market base is supermarkets in New Zealand. Since 2018, Hubbard
Foods Ltd has been operating as a subsidiary of the HFG Group.
Specializing in brands of breakfast cereals, Hubbard Foods Ltd has gained wide popularity and
market base in New Zealand. The company has achieved high sales over the years and is
currently the leading producer of breakfast products in New Zealand. This could be attributed to
its marketing strategy that makes the company stand out among its competitors (2). Hubbard
tabler-icon-diamond-filled.svg

Paraphrase This Document

Need a fresh take? Get an instant paraphrase of this document with our AI Paraphraser
Document Page
Foods Limited is made up of a sales force that includes 6 sales representatives strategically
located throughout New Zealand and Australia. Sales representatives are remunerated through a
base plus commission formula (3).
Customer response is considered one of the major information source for the company. The
company uses these responses to inform judgement on its market strategies, and thereby make
improvements. Other sources of information include consumer surveys in order to gain insight
on consumer preferences concerning the products offered by the company.
Methodology
Research technique
The study employed both quantitative and qualitative techniques. The research design involved a
case study.
Data collection
Data for this task was collected from secondary sources. The organization’s website provided
vital information necessary for this report. Both quantitative and qualitative data were collected
for analysis.
Data analysis
Both descriptive and inferential statistics tools were used for analyzing the data. Association
among variables was analyzed using correlation analysis (4). Regression and time series analysis
were performed to investigate the market trends of the Hubbard Foods Limited and its associated
competitors.
Qualitative analysis was carried out to provide comparative market information on Hubbard
Foods Limited against its competitors (5).
All analyses were performed using SPSS.
Document Page
Results
Descriptive statistics
Results of the analysis show that on average, Hubbard Foods Limited had the highest sales for
the time period between 2009 to 2018, followed by Lian Huat, followed by Cucina. Choice Egg
Noodle was found to have the lowest sales on average for the time period 2009 to 2018.
Descriptive Statistics
N Minimum Maximum Mean Std. Deviation
Hubbard 10 15378880 17457234 15835629.20 687663.812
Cucina 10 13457892 16447392 14896014.30 905563.631
Choice egg Noodle 10 12673829 13672902 13232202.00 298225.953
Lian Huat 10 14234172 16538372 14955643.90 706030.703
Valid N (listwise) 10
The frequency histograms for the four companies are as shown below;
The histogram shows that majority of the sales for Hubbard foods limited lied between 15000000
to 15500000.
Document Page
Majority of the Cucina sales lied between 15000000 to 15500000.
Majority of the sales for Choice Egg Noodle lied between 1325000 to 13500000.
tabler-icon-diamond-filled.svg

Paraphrase This Document

Need a fresh take? Get an instant paraphrase of this document with our AI Paraphraser
Document Page
Majority of the sales for Lian Huat lied between 14000000 to 15500000.
Inferential statistics
Inferential statistics was used to assess factors that have led to the success of Hubbard Foods
Limited.
Correlation
Correlation is performed to assess association between variables.
Correlations
Weekly
purchase
customer
relations price Products' quality
Weekly purchase Pearson Correlation 1 -.112 .257 -.278
Sig. (2-tailed) .493 .110 .082
N 40 40 40 40
customer relations Pearson Correlation -.112 1 -.221 .012
Sig. (2-tailed) .493 .170 .943
N 40 40 40 40
price Pearson Correlation .257 -.221 1 -.071
Sig. (2-tailed) .110 .170 .661
Document Page
N 40 40 40 40
Products' quality Pearson Correlation -.278 .012 -.071 1
Sig. (2-tailed) .082 .943 .661
N 40 40 40 40
Results of the analysis show that there is no correlation between weekly purchase frequency and
the factors that are thought to influence the success of Hubbard Foods Limited (Customer
relations, pricing and the quality of products offered by the company. This is because p-values
were found to be greater than 0.05 thereby implying lack of significant association between the
factors and the consumers’ frequency of purchase of Hubbard breakfast products.
Regression analysis
Regression analysis was used to assess the effect that factors had on the success of the company.
Coefficientsa
Model
Unstandardized Coefficients
Standardized
Coefficients
t Sig.B Std. Error Beta
1 (Constant) 3.812 1.318 2.891 .006
customer relations 2.192 .519 -.059 -.370 .003
price 1.751 .531 .225 1.414 .01
Products' quality 5.873 .518 -.261 -1.684 .001
a. Dependent Variable: Weekly purchase
Results of the analysis depict that customer relations, product pricing and products’ quality
positively affect the frequency at which customers purchase products from Hubbard Foods
Limited.
The regression equation is as shown below;
Weekly purchase=3.812+2.192customer relations+1.751price+¿
Document Page
5.873Product quality .
Product quality is found to have the largest effect on frequency of purchase (5.873), followed by
customer relations (2.19), then price of products (1.751).
Conclusion
Based on the results of the analysis, Hubbard Foods Limited has a good reputation in the market
as a result of its product quality, customer relations and pricing policy. For the company to enjoy
its dominance in the market, it should make efforts to better improve its customer relation
policies and the quality of these products, as these are the factors with the highest magnitude on
the frequency of consumer products’ purchase.
Bibliography
1. Prediction intervals for future demand of existing products with an observed demand of zero.
Matthew Lindsey, Robert Pavur. 6, 2009, International Journal of Production Economics, Vol. 115, p. 15.
2. Book cover Food security in New Zealand: External supply risks. Hubbard, L.J., Hubbard, Carmen. 12,
2013, Food policy, Vol. 43, pp. 12-13.
3. Global attractivity in delayed differential equations with applications to “food-limited” population
model. Yang, Xitao. 2, 2008, Journal of Mathematical Analysis and Applications, Vol. 344, p. 12.
4. Correlative analysis. Kenon, William. 2011, p. 3.
5. Interactive Qualitative Analysis: A Systems Method for Qualitative Research. Sandelowski, M. 2009, p.
16.
Appendix
Average income out of sales
Year Hubbard Cucina Choice egg Noodle Lian Huat
tabler-icon-diamond-filled.svg

Paraphrase This Document

Need a fresh take? Get an instant paraphrase of this document with our AI Paraphraser
Document Page
2009 15378880 14756789 12673829 14234172
2010 15402335 13457892 12845628 14352719
2011 15402113 13878393 13056729 14255172
2012 15403445 14278934 13254635 14528839
2013 15501901 14678326 13245376 14738291
2014 15502783 15023824 13326182 15288102
2015 15603578 15187390 13452618 14987362
2016 16200456 15267483 13367291 15267129
2017 16503567 16447392 13426830 15366281
2018 17457234 15983720 13672902 16538372
customer relations Pricing Products' quality Weekly purchase
good affordable good 4
good affordable good 3
good affordable good 4
good costly good 3
good affordable poor 2
poor affordable poor 1
poor costly good 3
good costly good 5
good affordable poor 6
poor affordable poor 2
poor affordable good 3
Document Page
good affordable good 4
good costly good 5
good affordable good 3
good costly poor 2
good affordable poor 5
good affordable good 1
poor affordable good 3
poor costly good 5
good costly good 6
good costly good 7
good costly good 3
good affordable good 2
poor affordable good 4
good affordable poor 1
poor affordable poor 2
good affordable poor 4
good affordable good 5
good costly good 3
poor affordable good 2
good costly poor 5
good affordable good 2
good costly poor 1
poor affordable poor 2
Document Page
poor affordable good 6
poor affordable good 4
good affordable good 2
poor affordable good 4
good affordable good 4
good affordable good 3
chevron_up_icon
1 out of 10
circle_padding
hide_on_mobile
zoom_out_icon
[object Object]