Comprehensive Data Analysis Report: London Humidity and Forecasting

Verified

Added on  2023/06/04

|10
|1458
|401
Report
AI Summary
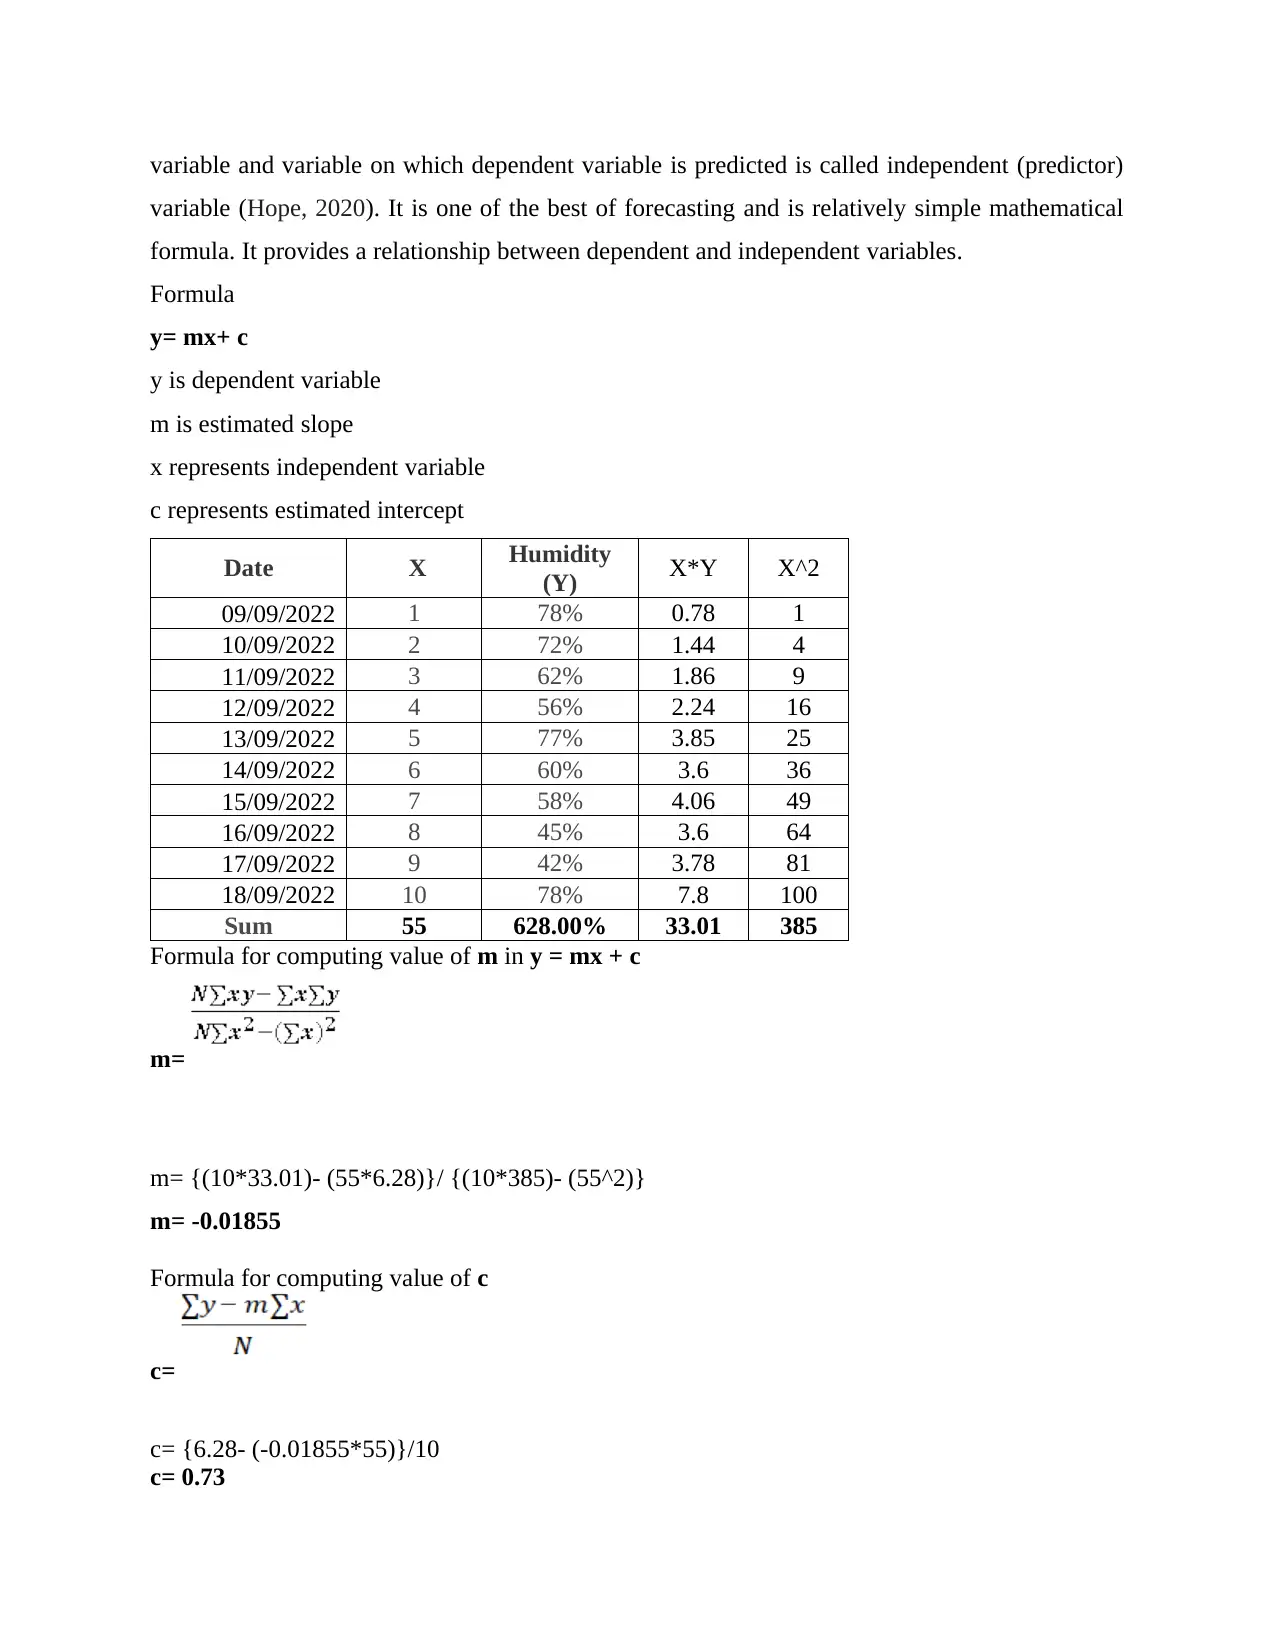
This report provides a detailed data analysis of humidity in London, covering a ten-day period. It begins by arranging the humidity data in a table format and presenting it visually through bar and line charts. The core of the report involves calculating and discussing various statistical measures, including the mean, median, mode, range, and standard deviation, providing insights into the central tendencies and spread of the humidity data. Furthermore, the report utilizes linear regression to forecast the humidity for the subsequent two days, demonstrating the application of statistical tools for predictive analysis. The conclusion summarizes the key findings and the utility of the analytical methods employed. The report references several academic sources to support its methodology and findings, offering a well-rounded understanding of data analysis techniques.
tabler-icon-diamond-filled.svg

Contribute Materials

Your contribution can guide someone’s learning journey. Share your documents today.
Document Page
NUMERACY AND
DATA ANALYSIS
tabler-icon-diamond-filled.svg

Secure Best Marks with AI Grader

Need help grading? Try our AI Grader for instant feedback on your assignments.
Document Page
Table of Contents
INTRODUCTION...........................................................................................................................3
MAIN BODY..................................................................................................................................3
1. Arranging the data in Table format-........................................................................................3
2. Presentation of the data in different types of chart-.................................................................3
3. Calculation and discussion of the following-..........................................................................4
4. Linear regression.....................................................................................................................6
CONCLUSION................................................................................................................................8
REFERENCES................................................................................................................................9
Document Page
INTRODUCTION
Data analysis is a method used for inspecting, transforming, cleaning and modelling of data
which aims to convert raw information or data into useful information which can be used for
making decisions. The report will outline the data analysis of humidity in London. It will
highlight computation of different statistical formulas along with this there will be discussion
regarding the result of each formula. The statistical formulas that are being computed are: mean,
mode, median, range and standard deviation. Data collected regarding humidity in London will
be also presented in tabular as well as in different charts. Further, report will also include
calculation of linear regression which is used for forecasting. In this report linear regression
formula will be used to forecast humidity of next two days i.e. 11th and 12th in London.
MAIN BODY
1. Arranging the data in Table format-
Last ten days humidity in London
Date Humidity
9-Sep 78
10-Sep 72
11-Sep 62
12-Sep 56
13-Sep 77
14-Sep 60
15-Sep 58
16-Sep 45
17-Sep 42
18-Sep 78
The above table represents humidity of London of ten consecutive days from 9th
September, 2022 to 18th September, 2022.
2. Presentation of the data in different types of chart-
Bar chart=
Document Page
Line chart=
3. Calculation and discussion of the following-
1) Mean= Mean is the value which characterizes average value of certain data set. The steps are
taken as below=
Formula= Mean= Sum of the taken humidity/ Number of the days. (Saidi and Siew, 2019)
= 628/10
= 62.8
tabler-icon-diamond-filled.svg

Secure Best Marks with AI Grader

Need help grading? Try our AI Grader for instant feedback on your assignments.
Document Page
The value 62.8 exhibits that the average of this humidity series is 62.8 so average humidity has
been 62.8% in London.
2) Median= This gives the value of centre which rifts a series in two parts, one is bigger and
second one is smaller than the extended value (Kaliyadan and Kulkarni, 2019).
Formula= Median= (n+1)/2
Arranging the data in increasing order= 42, 45, 56, 58, 60, 62, 72, 77, 78, 78
= 10+1/2
= 5.5th value
= 60+62/2
=61
The value of median explains that the medium humidity in London has been 61. So in other days
the humidity was recorded half tenure lower than 61 and half tenure bigger.
3) Mode= It is the value which shows the most frequent value out of the taken data series
(George and Mallery, 2018).
In this case Observation method has been applied as-
42, 45, 56, 58, 60, 62, 72, 77, 78, 78
As from observation it can be twigged that the value 78 is the most frequent one. So the mode in
this case is 78. It articulates that the maximum humidity has been notched up at 78%.
4) Range= this value shows the difference between the biggest and smallest number or figure.
So the formula is=
Formula= Range= Biggest value- Smallest value
Range= 78-42
= 36
The difference between humidity of the undertaken 10 days was 36. So the humidity was ranging
with this margin. On the basis of the calculation it can be summarized that the fulgurations were
quite significant or intensive in last ten days. That’s the reason of such a comprehensive figure of
range (Bagus, and Hanaoka, 2022)
5) Standard Deviation= It shows the value which deciphers the spread out of certain data set
(Weir and et.al., 2018). If the data is clustered around the mean, then it would be lower and in
case of hyper data spread out then the value would be bigger.
Formula=
Document Page
So by applying the formula outcomes are as=
Humidity figures Deviation form Mean Square of the deviations
78 15.2 231.4
72 9.2 84.64
62 -0.8 0.64
56 -6.8 46.24
77 14.2 201.64
60 -2.8 7.84
58 -4.8 23.04
45 -17.8 316.84
42 -20.8 432.64
78 15.2 231.04
628 (mean= 628/10=62.8) 0 1575.6
So as per the formula (1575.6/10)
= 157.56
=157.56^ (1/2)
= 12.55
Standard deviation= 12.55
It shows large spread of the values form the mean. Keeping it as testimony it would be fair
enough to articulate that the humidity was recorded haphazardly. On the basis of the evaluation it
can be said that the spread was highly disseminated.
4. Linear regression
Liner regression is a tool in statistics that is used to predict value of one variable depending on
value of another variable. The variable that is being predicted is known as dependent (response)
Document Page
variable and variable on which dependent variable is predicted is called independent (predictor)
variable (Hope, 2020). It is one of the best of forecasting and is relatively simple mathematical
formula. It provides a relationship between dependent and independent variables.
Formula
y= mx+ c
y is dependent variable
m is estimated slope
x represents independent variable
c represents estimated intercept
Date X Humidity
(Y) X*Y X^2
09/09/2022 1 78% 0.78 1
10/09/2022 2 72% 1.44 4
11/09/2022 3 62% 1.86 9
12/09/2022 4 56% 2.24 16
13/09/2022 5 77% 3.85 25
14/09/2022 6 60% 3.6 36
15/09/2022 7 58% 4.06 49
16/09/2022 8 45% 3.6 64
17/09/2022 9 42% 3.78 81
18/09/2022 10 78% 7.8 100
Sum 55 628.00% 33.01 385
Formula for computing value of m in y = mx + c
m=
m= {(10*33.01)- (55*6.28)}/ {(10*385)- (55^2)}
m= -0.01855
Formula for computing value of c
c=
c= {6.28- (-0.01855*55)}/10
c= 0.73
tabler-icon-diamond-filled.svg

Paraphrase This Document

Need a fresh take? Get an instant paraphrase of this document with our AI Paraphraser
Document Page
Forecasting humidity for day 11th and 12th
Putting the value of m and c calculated above in formula given below humidity of 11th and 12th
day can be forecasted.
11th day humidity
y= mx+ c
y= (-0.01855*11) + 0.73
y= 0.526 or 52.60%
Therefore, it can be said that humidity of 11th day in London may be 52.60%.
12th day humidity
y= mx+ c
y= (-0.01855*12) + 0.73
y= 0.507 or 50.70%
Hence, it can be forecasted that humidity of 12th may be 50.70%.
CONCLUSION
The report had been made with an aim of understanding different mathematical formulas
used for analysing data and generating useful information which can be used for making
effective decisions. Report consist of calculation different statistical formulas and generate
information regarding humidity in London. The data collected for various day humidity were
presented in tabular and charts form. At last, report also highlighted forecast of 11th and 12th day
humidity using linear regression.
Document Page
REFERENCES
Bagus, M. R. D. and Hanaoka, S., 2022. The central tendency of the seaport-fulcrum supply
chain risk in Indonesia using a rough set. The Asian Journal of Shipping and Logistics.
George, D. and Mallery, P., 2018. Descriptive statistics. In IBM SPSS Statistics 25 Step by
Step (pp. 126-134). Routledge.
Hope, T. M., 2020. Linear regression. In Machine Learning (pp. 67-81). Academic Press.
Kaliyadan, F. and Kulkarni, V., 2019. Types of variables, descriptive statistics, and sample
size. Indian dermatology online journal. 10(1). p.82.
Saidi, S. S. and Siew, N. M., 2019. Assessing Students' Understanding of the Measures of
Central Tendency and Attitude towards Statistics in Rural Secondary
Schools. International Electronic Journal of Mathematics Education, 14(1), pp.73-86.
Weir, C. J and et.al., 2018. Dealing with missing standard deviation and mean values in meta-
analysis of continuous outcomes: a systematic review. BMC medical research
methodology. 18(1). pp.1-14.
Document Page
chevron_up_icon
1 out of 10
circle_padding
hide_on_mobile
zoom_out_icon
logo.png

Your All-in-One AI-Powered Toolkit for Academic Success.

Available 24*7 on WhatsApp / Email

[object Object]