Data Analysis and Forecasting Report: Humidity in Arad, Romania

Verified

Added on  2023/01/16

|9
|1393
|92
Report
AI Summary
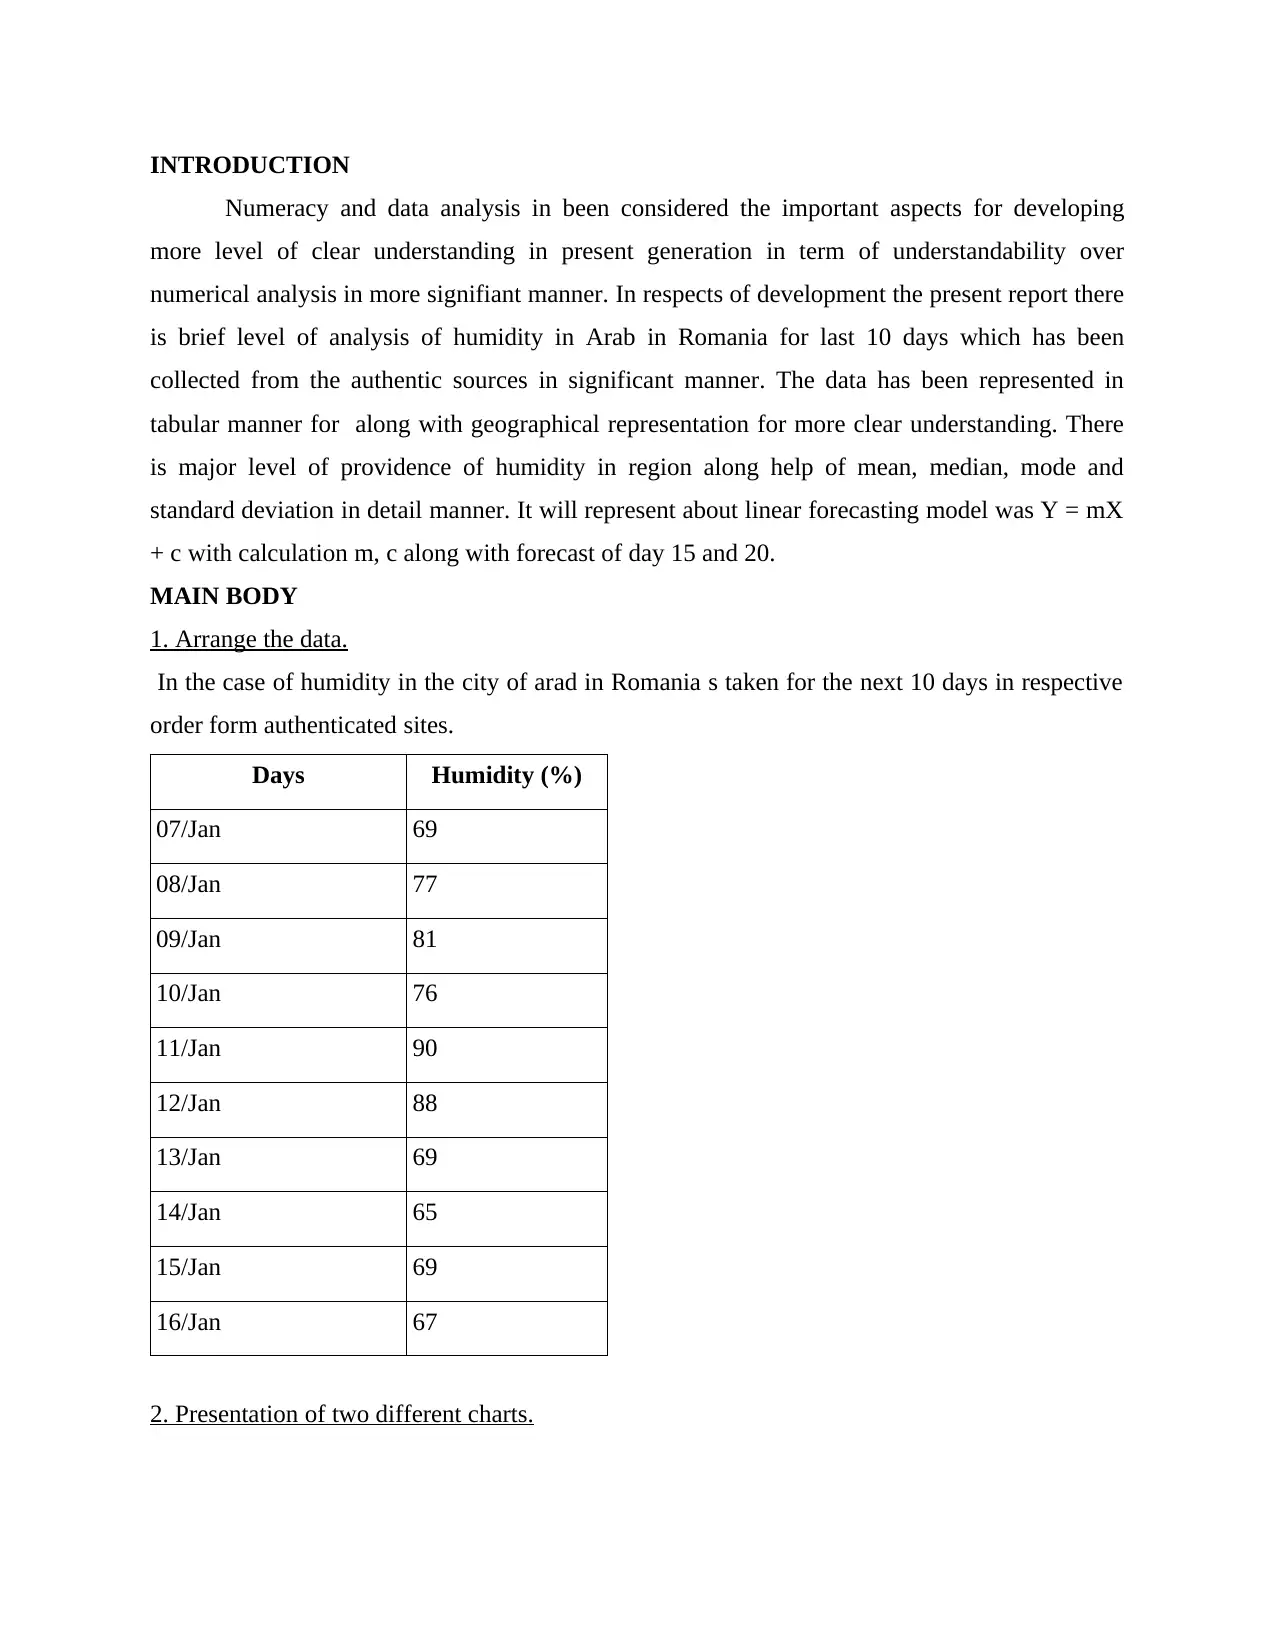
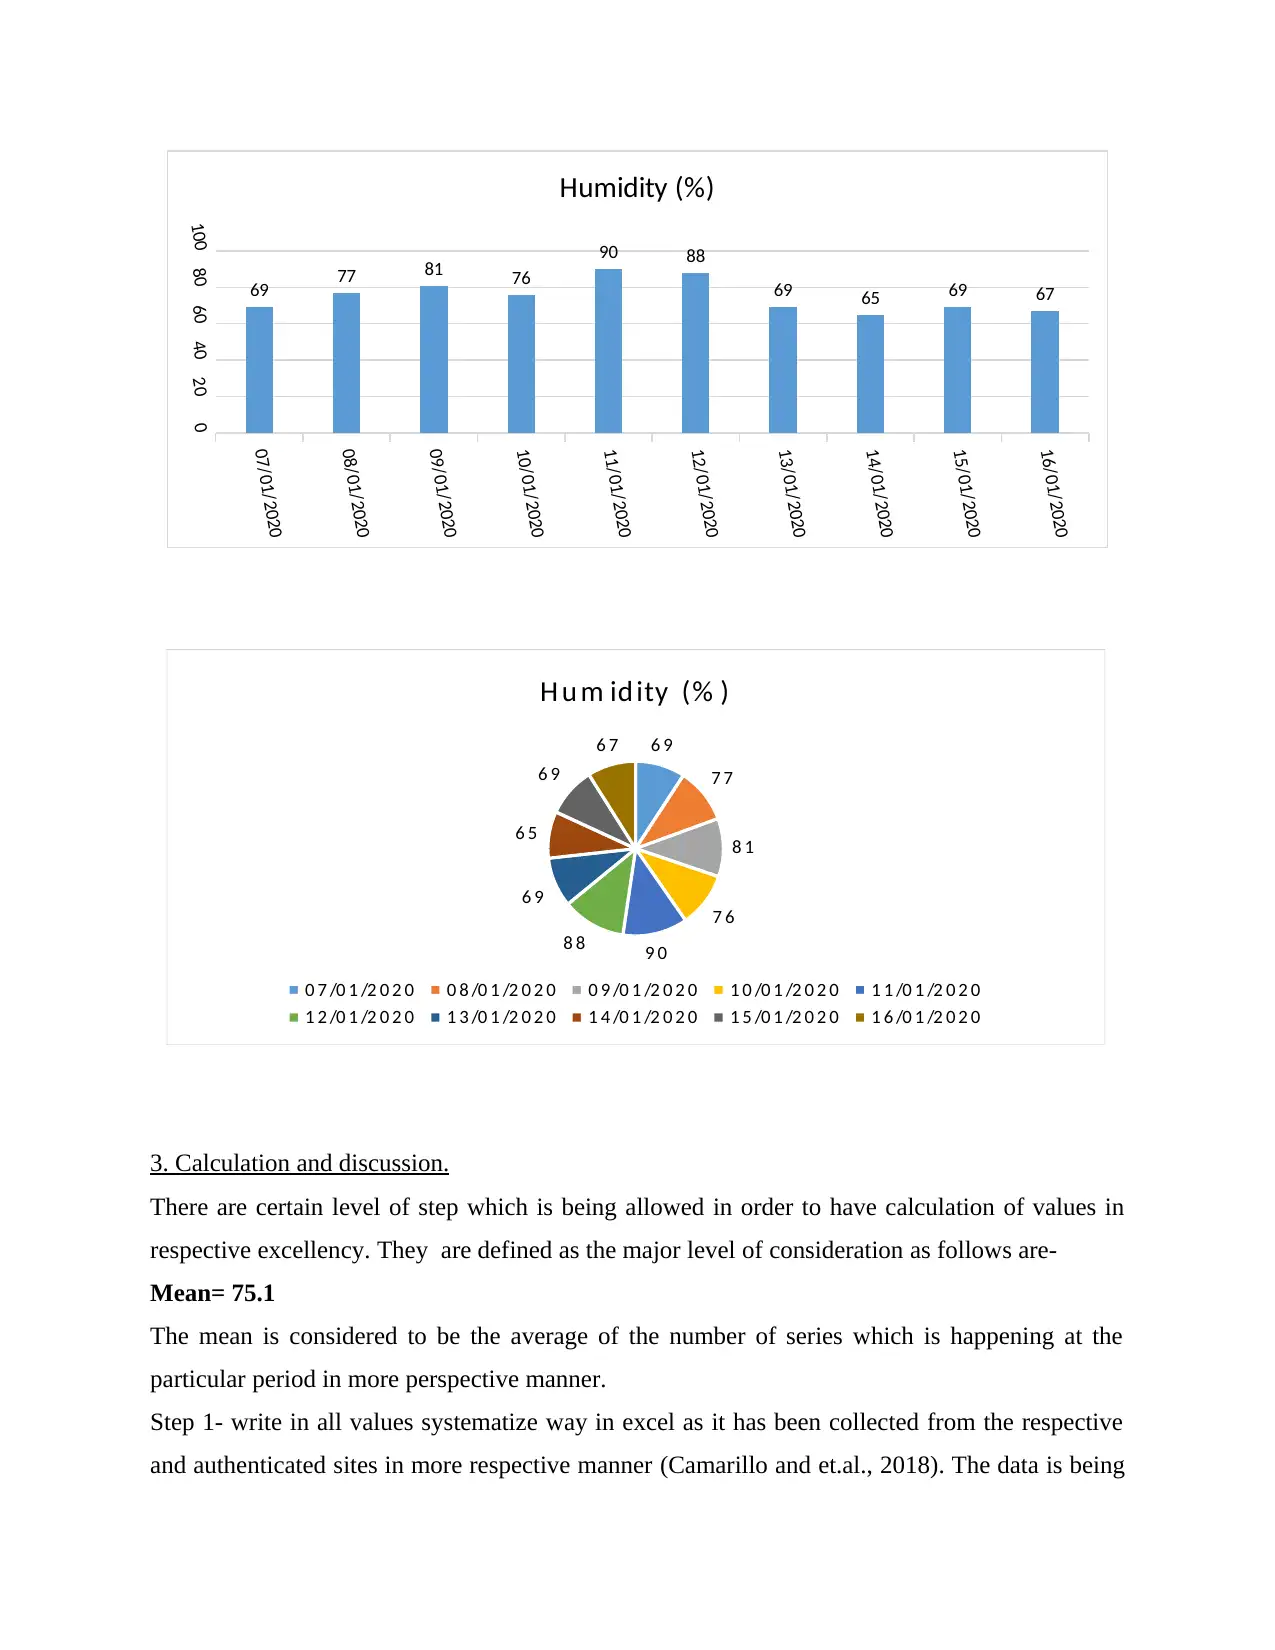
This report provides a detailed analysis of humidity data collected in Arad, Romania, over a 10-day period. The analysis begins with data arrangement and presentation, including two different chart types to visualize humidity trends. Statistical calculations, such as mean, median, mode, range, and standard deviation, are performed and discussed to provide insights into the data. Furthermore, the report delves into linear forecasting using the equation Y = mX + c, calculating the values of 'm' and 'c' and forecasting humidity levels for the 15th and 20th days. The conclusion emphasizes the importance of statistical tools in understanding numerical data and highlights the practical application of these tools in analyzing and forecasting humidity levels in the specified location. The report also references relevant academic sources to support the analysis.
Document Page
Data Analysis and
Forecasting
tabler-icon-diamond-filled.svg

Secure Best Marks with AI Grader

Need help grading? Try our AI Grader for instant feedback on your assignments.
Document Page
Table of Contents
INTRODUCTION...........................................................................................................................3
MAIN BODY...................................................................................................................................3
1. Arrange the data.......................................................................................................................3
2. Presentation of two different charts.........................................................................................3
3. Calculation and discussion.......................................................................................................4
4. Calculation and discussion of equation-..................................................................................6
CONCLUSION................................................................................................................................7
REFERENCES................................................................................................................................8
Document Page
INTRODUCTION
Numeracy and data analysis in been considered the important aspects for developing
more level of clear understanding in present generation in term of understandability over
numerical analysis in more signifiant manner. In respects of development the present report there
is brief level of analysis of humidity in Arab in Romania for last 10 days which has been
collected from the authentic sources in significant manner. The data has been represented in
tabular manner for along with geographical representation for more clear understanding. There
is major level of providence of humidity in region along help of mean, median, mode and
standard deviation in detail manner. It will represent about linear forecasting model was Y = mX
+ c with calculation m, c along with forecast of day 15 and 20.
MAIN BODY
1. Arrange the data.
In the case of humidity in the city of arad in Romania s taken for the next 10 days in respective
order form authenticated sites.
Days Humidity (%)
07/Jan 69
08/Jan 77
09/Jan 81
10/Jan 76
11/Jan 90
12/Jan 88
13/Jan 69
14/Jan 65
15/Jan 69
16/Jan 67
2. Presentation of two different charts.
Document Page
07/01/2020
08/01/2020
09/01/2020
10/01/2020
11/01/2020
12/01/2020
13/01/2020
14/01/2020
15/01/2020
16/01/2020
020406080100
69 77 81 76
90 88
69 65 69 67
Humidity (%)
6 9
7 7
8 1
7 6
9 0
8 8
6 9
6 5
6 9
6 7
H u m id ity (% )
0 7 /0 1 /2 0 2 0 0 8 /0 1 /2 0 2 0 0 9 /0 1 /2 0 2 0 1 0 /0 1 /2 0 2 0 1 1 /0 1 /2 0 2 0
1 2 /0 1 /2 0 2 0 1 3 /0 1 /2 0 2 0 1 4 /0 1 /2 0 2 0 1 5 /0 1 /2 0 2 0 1 6 /0 1 /2 0 2 0
3. Calculation and discussion.
There are certain level of step which is being allowed in order to have calculation of values in
respective excellency. They are defined as the major level of consideration as follows are-
Mean= 75.1
The mean is considered to be the average of the number of series which is happening at the
particular period in more perspective manner.
Step 1- write in all values systematize way in excel as it has been collected from the respective
and authenticated sites in more respective manner (Camarillo and et.al., 2018). The data is being
tabler-icon-diamond-filled.svg

Secure Best Marks with AI Grader

Need help grading? Try our AI Grader for instant feedback on your assignments.
Document Page
actually put up into able along with puttying formula into excel of the mean that is = average
(values).
Step 2 Have the proper level of selectional in which values in needed to be calculated in more
systematic manner.
Step 3 then in order to get the answer please press Enter key for signifiant results.
Median = 72.5
Step 1- in order to have the proper level of calculation of the mean there should be writing down
of signifiant level of values in respective table in systematic manner which will helps in
calculating the median. The formulae will be interested will be = median (values)
Step 2 There will be proper level of selection of the value which is been required to be selected
in signifiant order. This step stronghold be taken place with more level of caresser.
Step 3- the next step in to have the calculation in column in order to be more calculate manner in
systematic order
Mode= 69
Step 1 write in all values systematize way in excel as it has been collected from the respective
and authenticated sites in more respective manner (Wittmann and et.al., 2018). The data is being
actually put up into able along with puttying formula into excel of the mode that is = mode
(values).
Step 2 Select the column to calculate answer
Step 3 press the enter in order to have generation of answer in more respected manner.
Range=25
Step 1 open excel and having more note down the values in more systematic manner.
Step 2 Write formulae for range which is = max (value) – min (value)
Step 3 have the selection of colour along with being pressing enter to generate the answer in
more respective manner.
Standard deviation= 8.86
Step 1 the major step in write done the values correcting in systematic manner in excel which is
necessary to have accurate level of evaluation
Step 2 There will be proper level of selection of the value which is been required to be selected
in signifiant order. The formula will be interested as Stdev (value)
Step 3 after the pressing the key of enter, the answer will be automagically generated.
Document Page
From the above data it can be analysed that the above static show that the Mean and Median of
the above data is been calculated is seen to quiets similar which are sac as 75.1 and 72.5.
However, next of mode of the data, there is level of reforestation of value 69 that is
approximately 3 times. More over the range and standard deviation about 25 and 8.86
respectively.
4. Calculation and discussion of equation-
Days Days (X) Humidity (%) XY X^2
07/Jan 1 69 69 1
08/Jan 2 77 154 4
09/Jan 3 81 243 9
10/Jan 4 76 304 16
11/Jan 5 90 450 25
12/Jan 6 88 528 36
13/Jan 7 69 483 49
14/Jan 8 65 520 64
15/Jan 9 69 621 81
16/Jan 10 67 670 100
total 55 751 4042 385
a) Step to calculate m and discussion.
Particulars Details
m NΣxy – Σx Σy / NΣ x^2 – (Σx)^2
(10 * 4042) – (55 * 751) / (10 * 385) – (55)^2
(40420-41305) / (3850-3025)
1.07
Step to calculate c and discussion
Document Page
Particulars Details
c Σy - m Σx / N
(751 – (1.07 * 55))/10
14.2
Using the calculated 'm' and 'c' values, forecast the humidity for day 15 and day 20
Forecast of 15th day
Y = mX + C
Y 1.07 (X) + 14.2
X 15
Y 1.07 (15) + 14.2
30.29
Forecast of 21th day
Y = mX + C
Y 1.07 (X) + 14.2
X 20
Y 1.07 (20) + 14.2
35.65
CONCLUSION
From the above report it can be concluded that the level of importance in aspects for
developing more level of clear understanding in present generation in term of understandability
over numerical analysis in more signifiant manner (Kim and et.al., 2018). This report has helps
in developing the clear way of understanding the used and importance of various statistical tools
which helps in developing the understanding in restitution to humidity in selected location it also
makes to have consultation reassigning 15th and 20th day in more systematic manner that is
30.29% and 35.65%
tabler-icon-diamond-filled.svg

Paraphrase This Document

Need a fresh take? Get an instant paraphrase of this document with our AI Paraphraser
Document Page
REFERENCES
Kim, M.H. and et.al., 2018. Segregated subnetworks of intracortical projection neurons in
primary visual cortex. Neuron. 100(6). pp.1313-1321.
Document Page
Wittmann, S. and et.al., 2018. Filtering mode for intra prediction inferred from statistics of
surrounding blocks. U.S. Patent 9,973,772.
Camarillo, T. and et.al., 2018. Median Statistics Estimate of the Distance to the Galactic Center.
Publications of the Astronomical Society of the Pacific. 130(984). p.024101.
chevron_up_icon
1 out of 9
circle_padding
hide_on_mobile
zoom_out_icon
logo.png

Your All-in-One AI-Powered Toolkit for Academic Success.

Available 24*7 on WhatsApp / Email

[object Object]