Report on Numeracy and Data Analysis of Bristol Humidity Data

Verified

Added on  2023/06/05

|10
|1489
|113
Report
AI Summary
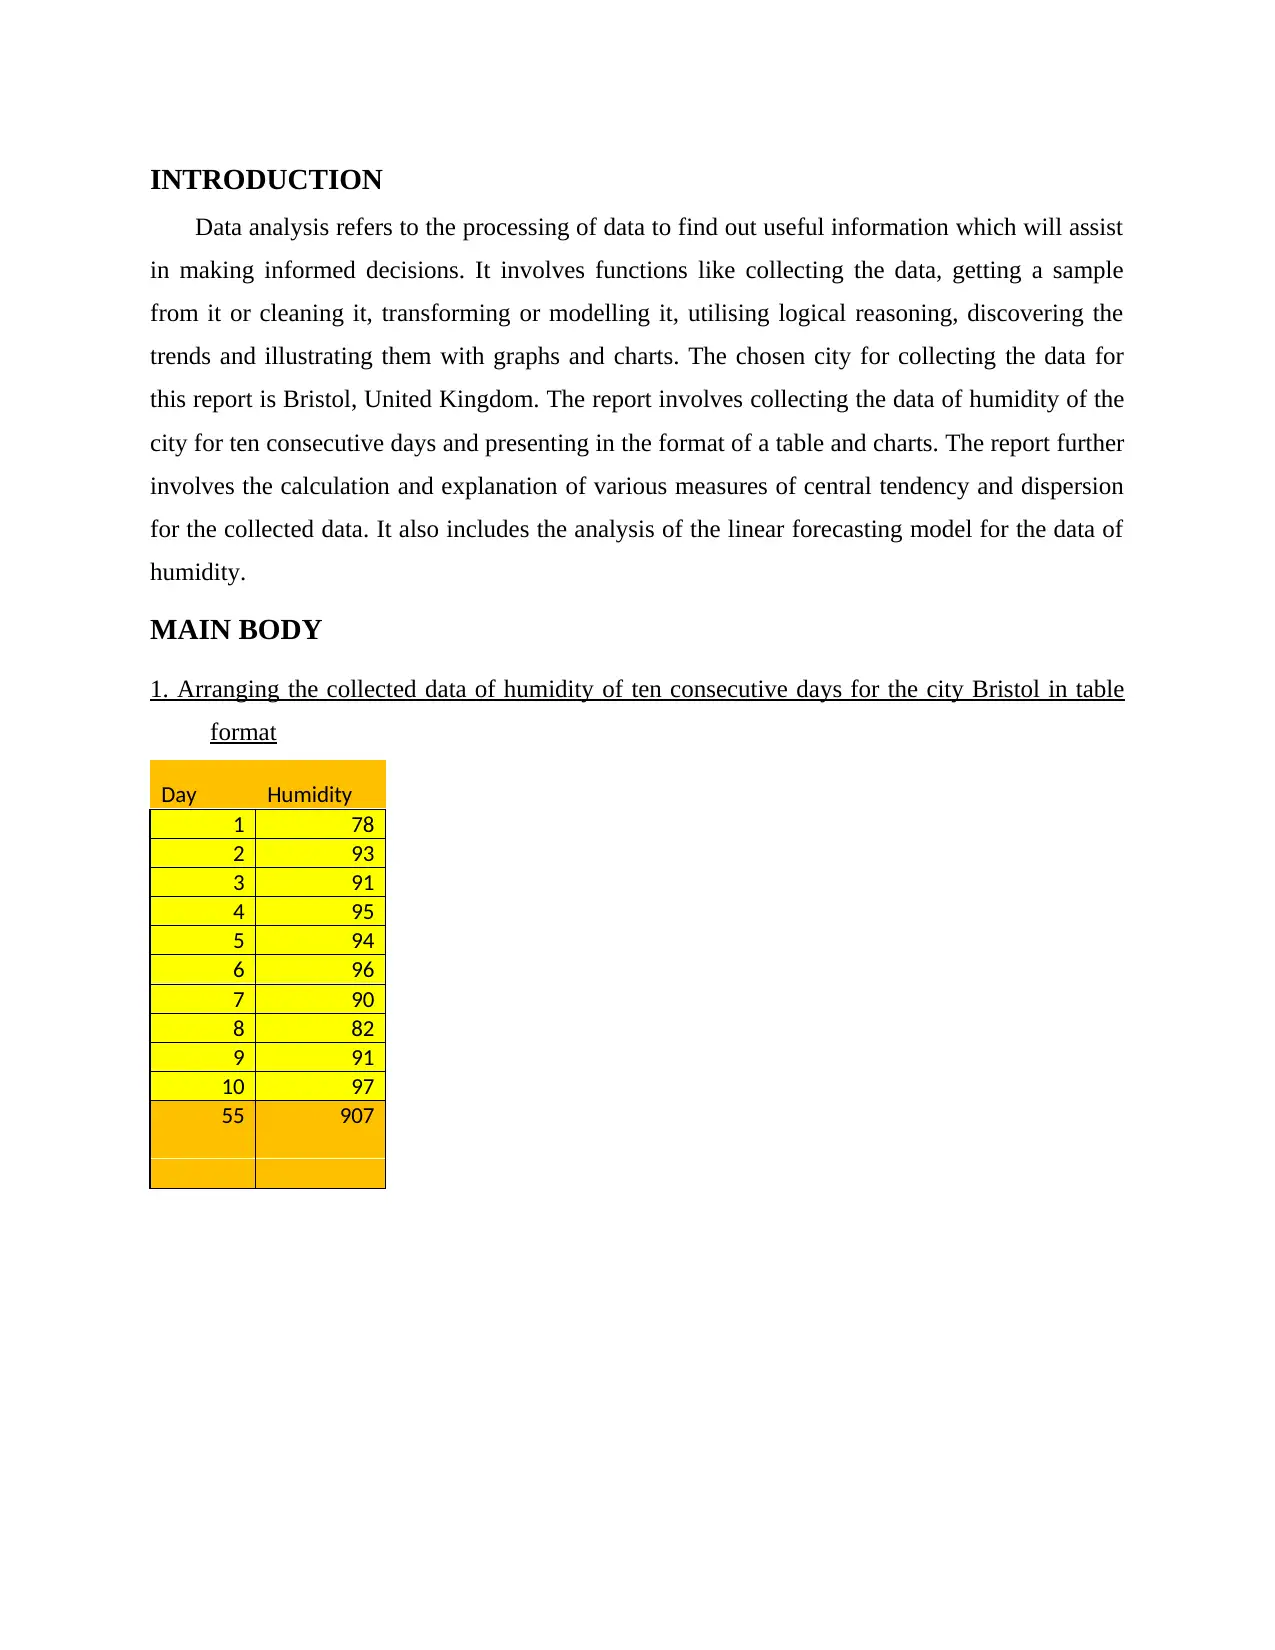
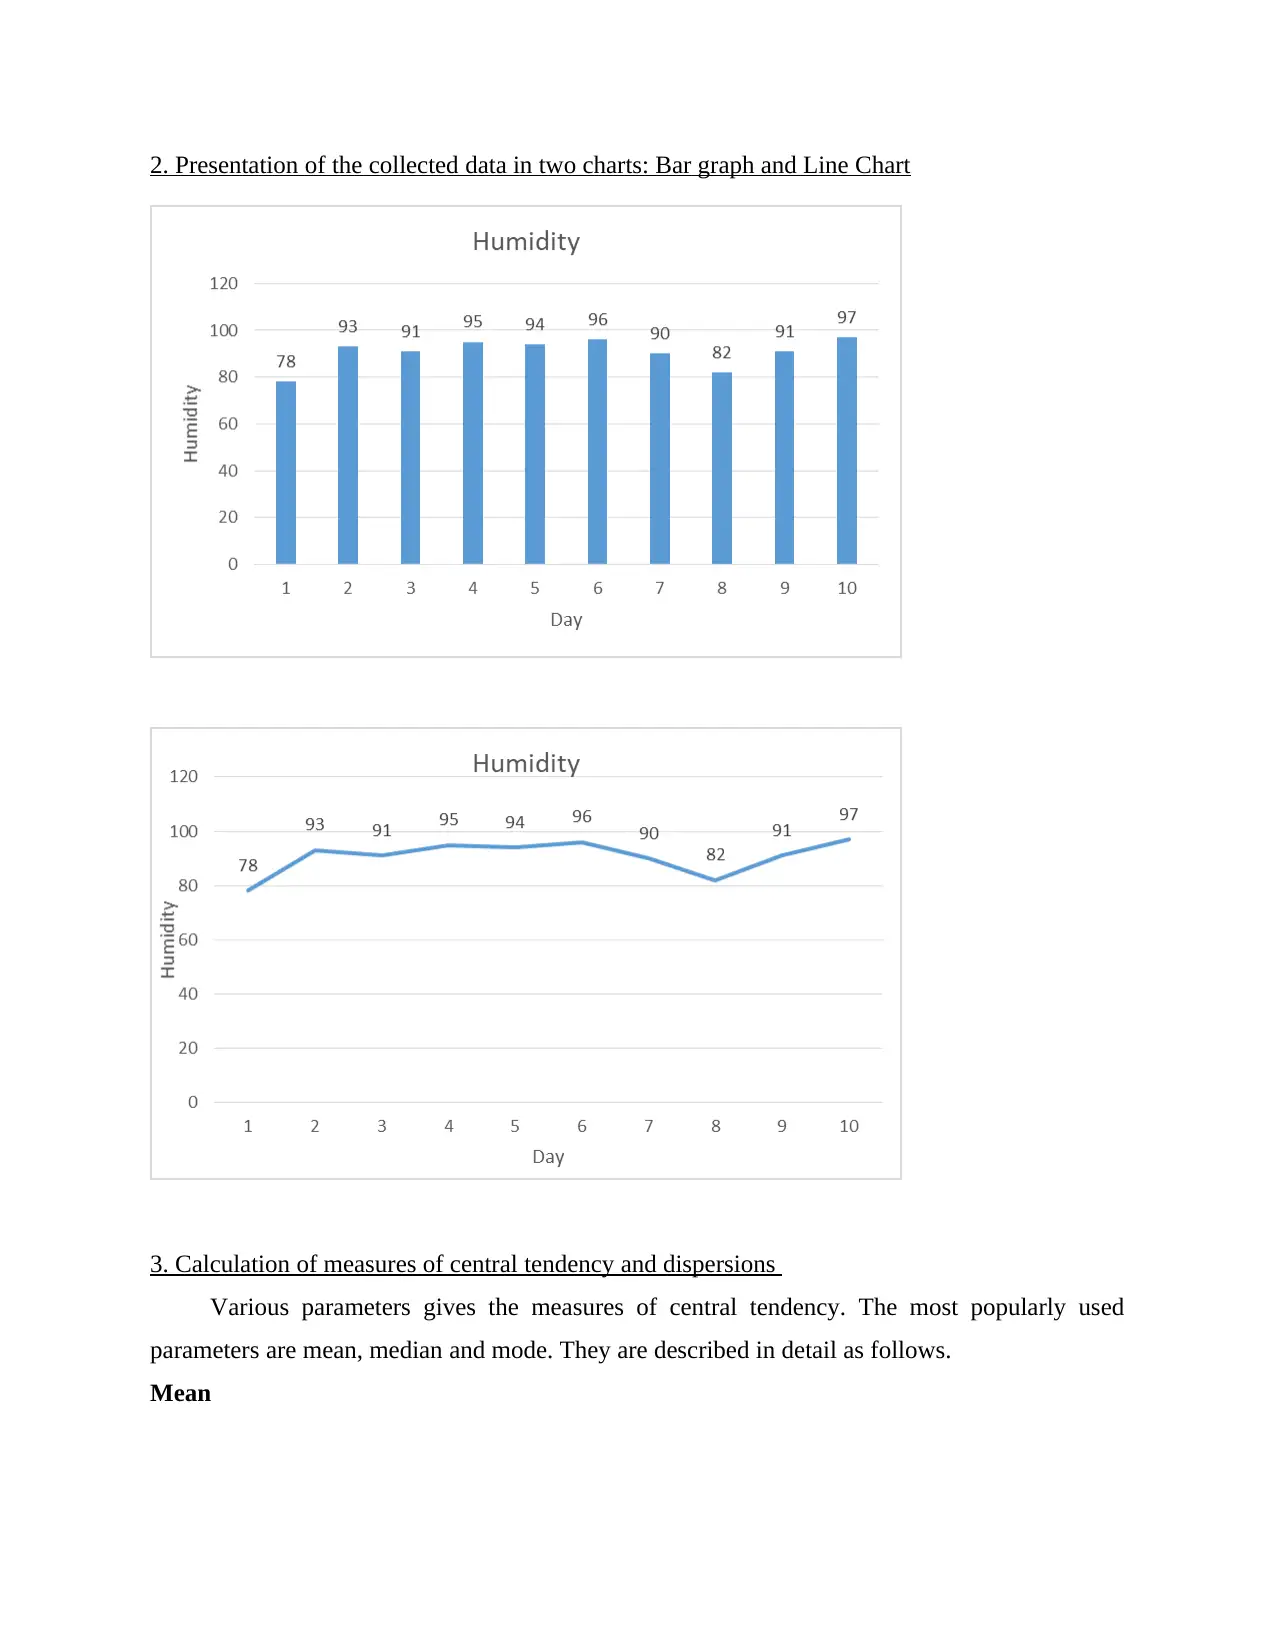
This report provides a comprehensive analysis of humidity data collected for Bristol, United Kingdom, over ten consecutive days. The data is presented in tabular and graphical formats, including bar graphs and line charts. The report calculates and explains various measures of central tendency, such as mean, median, and mode, and measures of dispersion, including range and standard deviation. Furthermore, it analyzes a linear forecasting model (y = mx + c) to predict future humidity values based on current trends. The report concludes by emphasizing the importance of data analysis in research, highlighting its role in simplifying complex data and deriving meaningful insights. Desklib offers more solved assignments and past papers for students.
tabler-icon-diamond-filled.svg

Contribute Materials

Your contribution can guide someone’s learning journey. Share your documents today.
Document Page
Numeracy and Data
Analysis
tabler-icon-diamond-filled.svg

Secure Best Marks with AI Grader

Need help grading? Try our AI Grader for instant feedback on your assignments.
Document Page
Contents
INTRODUCTION...........................................................................................................................3
MAIN BODY...................................................................................................................................3
1. Arranging the collected data of humidity of ten consecutive days for the city Bristol in table
format.....................................................................................................................................3
2. Presentation of the collected data in two charts: Bar graph and Line Chart......................4
3. Calculation of measures of central tendency and dispersions............................................4
4. Linear forecasting model (y=mx + c).................................................................................7
CONCLUSION................................................................................................................................8
REFERENCES..............................................................................................................................10
Document Page
INTRODUCTION
Data analysis refers to the processing of data to find out useful information which will assist
in making informed decisions. It involves functions like collecting the data, getting a sample
from it or cleaning it, transforming or modelling it, utilising logical reasoning, discovering the
trends and illustrating them with graphs and charts. The chosen city for collecting the data for
this report is Bristol, United Kingdom. The report involves collecting the data of humidity of the
city for ten consecutive days and presenting in the format of a table and charts. The report further
involves the calculation and explanation of various measures of central tendency and dispersion
for the collected data. It also includes the analysis of the linear forecasting model for the data of
humidity.
MAIN BODY
1. Arranging the collected data of humidity of ten consecutive days for the city Bristol in table
format
Day Humidity
1 78
2 93
3 91
4 95
5 94
6 96
7 90
8 82
9 91
10 97
55 907
Document Page
2. Presentation of the collected data in two charts: Bar graph and Line Chart
3. Calculation of measures of central tendency and dispersions
Various parameters gives the measures of central tendency. The most popularly used
parameters are mean, median and mode. They are described in detail as follows.
Mean
tabler-icon-diamond-filled.svg

Secure Best Marks with AI Grader

Need help grading? Try our AI Grader for instant feedback on your assignments.
Document Page
It is a popularly utilised measure of central tendency. Mean is the average of whole collected
data. This measure of central tendency is applicable to continuous and also to discrete type of
data (King and Eckersley, 2019).
Steps to calculate mean of the collected data:
Step 1: Calculate the sum of all the observations of the given data collection.
Step 2: Count the total number of observations.
Step 3: Divide the sum calculated in step 1 by the number calculated in step 2, and the result is
mean.
The formula is Sum of observations / Total no of observations = Mean
In the given case, the total number of observations is 10 days and the sum of all observations is
907. Hence the mean will be: 907/10 = 90.7
Median
It normally represents the value in the mid of the given data observations when it is arranged in
ascending or descending order (Ott, 2018).
Steps to calculate median are as follows:
Step 1: Arrange the observations in ascending or descending order.
Step 2: Find out whether the number of observations is odd or even.
Step 3: If the count of observations is even, then the median will be the average of (n/2) and
[(n/2) +1] observation. And if the count of observations as founded in step 2 is odd, then the
median will be [(n+1)/2] observation.
In the given case, the median will be calculated as follows:
The data in the ascending order is 78, 82, 90, 91, 91, 93, 94, 95, 96, and 97.
The count of observations here is 10, which is even.
Hence, the median will be the average of 5th and 6th observation which equals to (91+93)/2 = 92.
Mode
It is the most frequent occurring observation in the collected data. In the given case, every
observation is occurring for single time except for 91, which is occurring 2 times. Hence, the
most frequent observation is 91, the mode for the given data is 91.
Now, the next two parameters are known as measures of dispersion.
Range
Document Page
It represents the difference between the highest and lowest observation in the set of observations.
The formula is Highest observation – Lower observation = Range
In the given case, the range for the given set of observations is 97-78=19.
Standard Deviation
It is the measure of dispersion in statistics which illustrates how the values are spread across the
sample of the data. It can also be called as the degree of variation of data observations from the
mean. It is the square root of the variance (Protopsaltis and Lytos, 2020).
Steps to calculate standard deviation:
Step 1: Calculating the mean of the given data observations.
Step 2: Calculate the squared differences from the average. (Xi mean) 2
Step 3: Calculate the sum of squared differences calculated in the step 2.
Step 4: Divide the sum calculated in step 3 by the total no of observations. The result is the
variance.
Step 5: Take the square root of variance calculated in step 4.
The formula for standard deviation is
Day
Humidit
y Xi - μ (Xi - μ)
2
1 78 -12.7 161.29
2 93 2.3 5.29
3 91 0.3 0.09
4 95 4.3 18.49
5 94 3.3 10.89
6 96 5.3 28.09
7 90 -0.7 0.49
8 82 -8.7 75.69
9 91 0.3 0.09
10 97 6.3 39.69
55 907 340.1
N 10
μ 90.7
Document Page
In the given case, the standard deviation is calculated as follows:
The square root of (340.1/10) = square root of 34.01
= 5.83
4. Linear forecasting model (y=mx + c)
This model forecasts future values on the basis of current linear trends. Three required arguments
exist. The first x is the number that one want to forecast as the new value. There is a known y
that is a dependent array. Known x is the last one that is an independent array (Rubin and Little,
2019).
Calculation of m value
Day Humidity X2
xy
1 78 1 78
2 93 4 186
3 91 9 273
4 95 16 380
5 94 25 470
6 96 36 576
7 90 49 630
8 82 64 656
9 91 81 819
10 97 100 970
55 907 385 5038
N 10
tabler-icon-diamond-filled.svg

Paraphrase This Document

Need a fresh take? Get an instant paraphrase of this document with our AI Paraphraser
Document Page
In the given case, the m value will be calculated as follows:
m= (5038 – 55*907) / (385 -55*55)
= (5038 – 49885) / (385 – 3025)
= 44847 / 2640
= 16.99
Calculation of c value
In the given case, the c value is calculated as follows:
c= (907 – 16.99*55) / 10
= (907 – 934.45) / 10
= - 27.45 / 10
= - 2.75
y = mx + c
y = 16.99*x – 2.75
Forecasting the humidity on day 11,
y = 16.99*11 – 2.75
= 184.14
Forecasting the humidity on day 12,
y = 16.99*12 – 2.75
= 201.13
CONCLUSION
From the above report, it is concluded that data analysis is crucial in research as it makes
analysing a data a lot more simple and accurate. It assist the analysts in interpreting data
straightforwardly so that the there is nothing that researchers left out which could assist them in
deriving insights. The above report briefly explained the various parameters given for measure of
Document Page
central tendency and dispersions. It briefly analysed the linear forecasting model for the given
humidity set of observations.
Document Page
REFERENCES
Books and Journals
King, A.P. and Eckersley, R., 2019. Statistics for biomedical engineers and scientists: How to
visualize and analyze data. Academic Press.
Ott, W.R., 2018. Environmental statistics and data analysis. Routledge.
Protopsaltis, A. and Lytos, A., 2020, August. Data visualization in internet of things: tools,
methodologies, and challenges. In Proceedings of the 15th international conference on
availability, reliability and security (pp. 1-11).
Rubin, D.B. and Little, R.J., 2019. Statistical analysis with missing data. John Wiley & Sons.
SE, M.S.S.M.S. and SE, M.S., standard deviation, SE: standard error.
chevron_up_icon
1 out of 10
circle_padding
hide_on_mobile
zoom_out_icon
logo.png

Your All-in-One AI-Powered Toolkit for Academic Success.

Available 24*7 on WhatsApp / Email

[object Object]