Report on Numeracy and Data Analysis of Humidity in Manchester
VerifiedAdded on 2023/06/15
|9
|1220
|452
Report
AI Summary
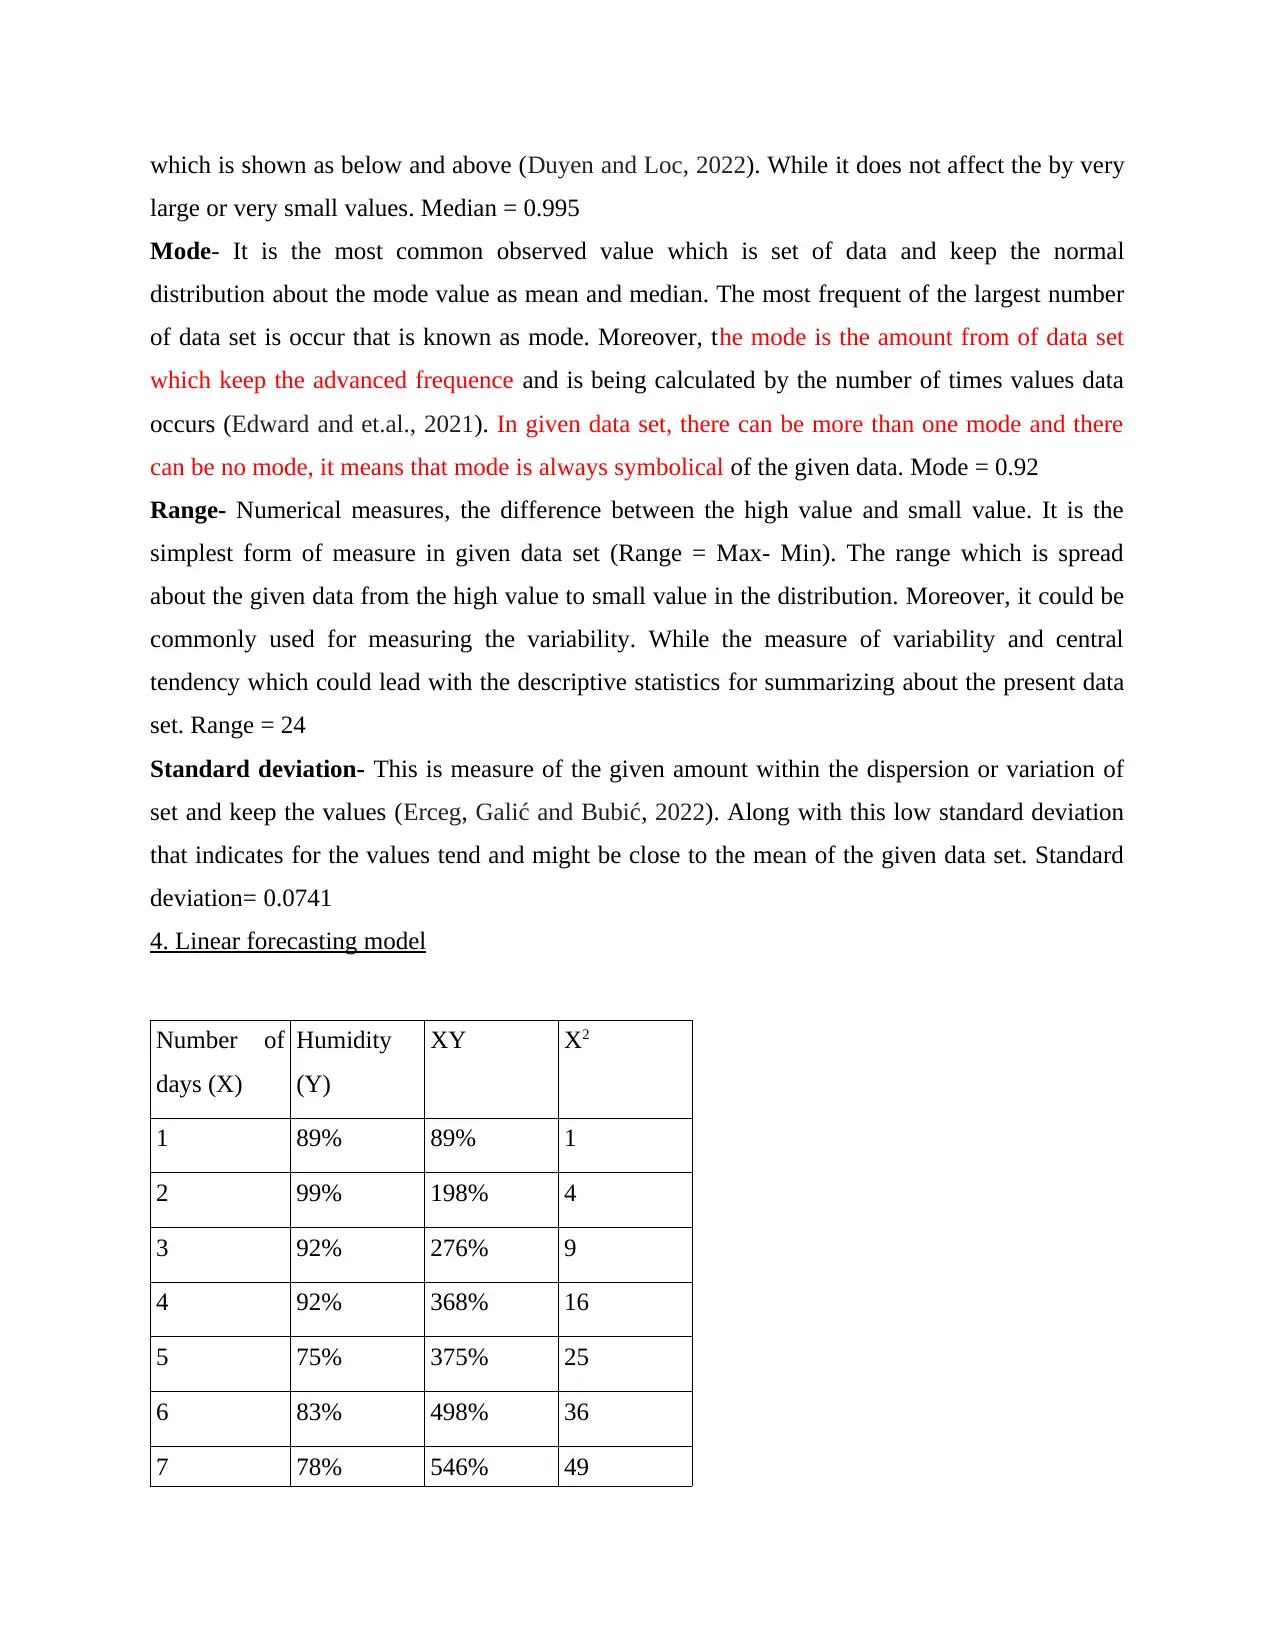
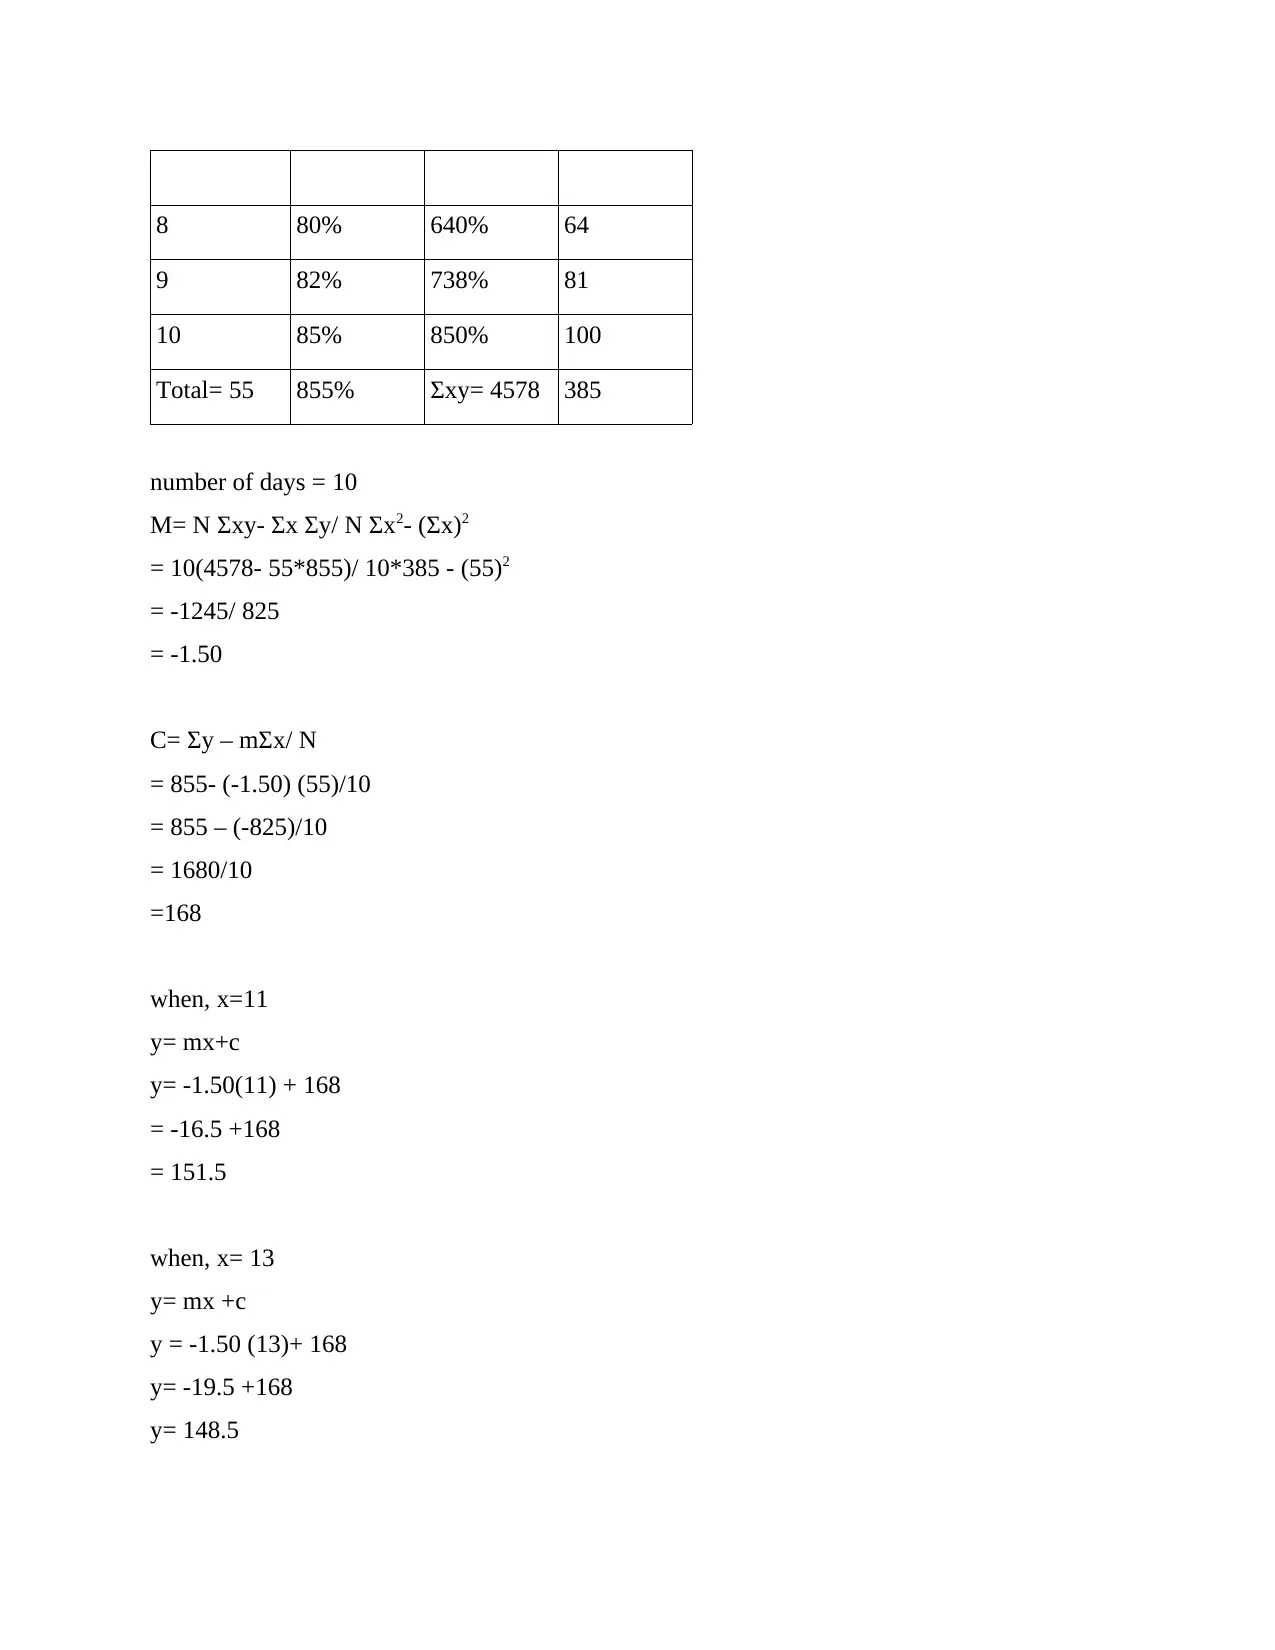
This report presents a numeracy and data analysis of humidity levels in Manchester City. It includes a dataset of daily humidity percentages, a corresponding data chart, and calculations of central tendency measures such as mean, median, mode, and range. The report also demonstrates the application of a linear forecasting model to predict future humidity levels based on the provided data. The analysis provides insights into the typical humidity values and potential future trends in Manchester, utilizing statistical methods to interpret and forecast environmental data. Desklib provides students access to similar past papers and solved assignments.

Numeracy and data analysis
Paraphrase This Document
Need a fresh take? Get an instant paraphrase of this document with our AI Paraphraser

TABLE OF CONTENTS
INTRODUCTION...........................................................................................................................3
MAIN BODY..................................................................................................................................3
1. Humidity in Manchester city...................................................................................................3
2. Data chart for the given humidity............................................................................................3
3. Calculation of central tendency...............................................................................................4
4. Linear forecasting model.........................................................................................................5
CONCLUSION................................................................................................................................7
REFERENCES................................................................................................................................8

INTRODUCTION
Central tendency is the typical value which is probability for the distribution and it is also
known as centre or location of the distribution. This report will explain about the humidity
temperature in Manchester city. Along with, central tendency formula and formulating through
using linear equation.
MAIN BODY
1. Humidity in Manchester city
Number of days Humidity
1 89.00%
2 99.00%
3 92.00%
4 92.00%
5 75.00%
6 83.00%
7 78.00%
8 80.00%
9 82.00%
10 85.00%
2. Data chart for the given humidity.
⊘ This is a preview!⊘
Do you want full access?
Subscribe today to unlock all pages.

Trusted by 1+ million students worldwide

3. Calculation of central tendency
The mean is the average of the number. Which is easily calculated and add up all the member
then divided by how many numbers are given. Mainly, represent the average of the given
collection of data and it is also relevant for both recreate and continuous data (Aunio and et.al.,
2021). Along with this it is also equal with all the value in form of collection data that is divided
by the total number of values.
Mean = sum of all data/ number of data
= 1+2+3+4+5+6+7+8+9+10/10
= 5.5
Median- the middle number of sorted list of given number. Along with this it is also used for
determining an appropriate mean, average, but it could not create the confusion about the actual
mean. While if there is odd number, the median value is middle and the same amount of number
1
2
3
4
5
6
7
8
9
10
0 2 4 6 8 10 12
Number of days
Humidity
1 2 3 4 5 6 7 8 9 10
0
2
4
6
8
10
12
Number of days
Humidity
Paraphrase This Document
Need a fresh take? Get an instant paraphrase of this document with our AI Paraphraser

which is shown as below and above (Duyen and Loc, 2022). While it does not affect the by very
large or very small values. Median = 0.995
Mode- It is the most common observed value which is set of data and keep the normal
distribution about the mode value as mean and median. The most frequent of the largest number
of data set is occur that is known as mode. Moreover, the mode is the amount from of data set
which keep the advanced frequence and is being calculated by the number of times values data
occurs (Edward and et.al., 2021). In given data set, there can be more than one mode and there
can be no mode, it means that mode is always symbolical of the given data. Mode = 0.92
Range- Numerical measures, the difference between the high value and small value. It is the
simplest form of measure in given data set (Range = Max- Min). The range which is spread
about the given data from the high value to small value in the distribution. Moreover, it could be
commonly used for measuring the variability. While the measure of variability and central
tendency which could lead with the descriptive statistics for summarizing about the present data
set. Range = 24
Standard deviation- This is measure of the given amount within the dispersion or variation of
set and keep the values (Erceg, Galić and Bubić, 2022). Along with this low standard deviation
that indicates for the values tend and might be close to the mean of the given data set. Standard
deviation= 0.0741
4. Linear forecasting model
Number of
days (X)
Humidity
(Y)
XY X2
1 89% 89% 1
2 99% 198% 4
3 92% 276% 9
4 92% 368% 16
5 75% 375% 25
6 83% 498% 36
7 78% 546% 49

8 80% 640% 64
9 82% 738% 81
10 85% 850% 100
Total= 55 855% Σxy= 4578 385
number of days = 10
M= N Σxy- Σx Σy/ N Σx2- (Σx)2
= 10(4578- 55*855)/ 10*385 - (55)2
= -1245/ 825
= -1.50
C= Σy – mΣx/ N
= 855- (-1.50) (55)/10
= 855 – (-825)/10
= 1680/10
=168
when, x=11
y= mx+c
y= -1.50(11) + 168
= -16.5 +168
= 151.5
when, x= 13
y= mx +c
y = -1.50 (13)+ 168
y= -19.5 +168
y= 148.5
⊘ This is a preview!⊘
Do you want full access?
Subscribe today to unlock all pages.

Trusted by 1+ million students worldwide

CONCLUSION
From the above report it had been concluded that, central tendency that help for finding out
the humidity level in given city. Moreover, using the graph with the given data set have been
used in this report.
From the above report it had been concluded that, central tendency that help for finding out
the humidity level in given city. Moreover, using the graph with the given data set have been
used in this report.
Paraphrase This Document
Need a fresh take? Get an instant paraphrase of this document with our AI Paraphraser

REFERENCES
Books and Journals
Aunio, P. and et.al., 2021. An early numeracy intervention for first-graders at risk for
mathematical learning difficulties. Early Childhood Research Quarterly. 55,. pp.252-262.
Duyen, N.T.H. and Loc, N.P., 2022. European Journal of Educational Research. European
Journal of Educational Research. 11(1). pp.1-16.
Edward, J.S. and et.al., 2021. The association of health insurance literacy and numeracy with
financial toxicity and hardships among colorectal cancer survivors. Supportive Care in
Cancer. pp.1-8.
Erceg, N., Galić, Z. and Bubić, A., 2022. Normative responding on cognitive bias tasks: Some
evidence for a weak rationality factor that is mostly explained by numeracy and actively
open-minded thinking. Intelligence. 90. p.101619.
Hudson, B., 2022. Teachers as Curriculum Makers for School Mathematics of High Epistemic
Quality. International Perspectives on Knowledge and Quality: Implications for
Innovation in Teacher Education Policy and Practice. p.145.
Recchia, G., Lawrence, A.C. and Freeman, A.L., 2022. Investigating the presentation of
uncertainty in an icon array: A randomized trial. PEC Innovation, 1, p.100003.
Say, R. and et.al., 2022. Formative online multiple-choice tests in nurse education: An
integrative review. Nurse Education in Practice. 58. p.103262.
Schnieders, J.Z.Y. and Schuh, K.L., 2022. Parent-child Interactions in Numeracy Activities:
Parental Scaffolding, Mathematical Talk, and Game Format. Early Childhood Research
Quarterly, 59, pp.44-55.
Sirota, M., Theodoropoulou, A. and Juanchich, M., 2021. Disfluent fonts do not help people to
solve math and non-math problems regardless of their numeracy. Thinking &
Reasoning. 27(1). pp.142-159.
Online
Past Weather in Manchester City Centre, 2022 [Online]. Available Through :
<https://www.timeanddate.com/weather/@7281603/historic>

⊘ This is a preview!⊘
Do you want full access?
Subscribe today to unlock all pages.

Trusted by 1+ million students worldwide
1 out of 9
Related Documents

Your All-in-One AI-Powered Toolkit for Academic Success.
+13062052269
info@desklib.com
Available 24*7 on WhatsApp / Email
Unlock your academic potential
Copyright © 2020–2025 A2Z Services. All Rights Reserved. Developed and managed by ZUCOL.