Data Analysis Report: Analysis and Forecasting of Humidity Levels

Verified

Added on  2023/06/07

|10
|1359
|269
Report
AI Summary
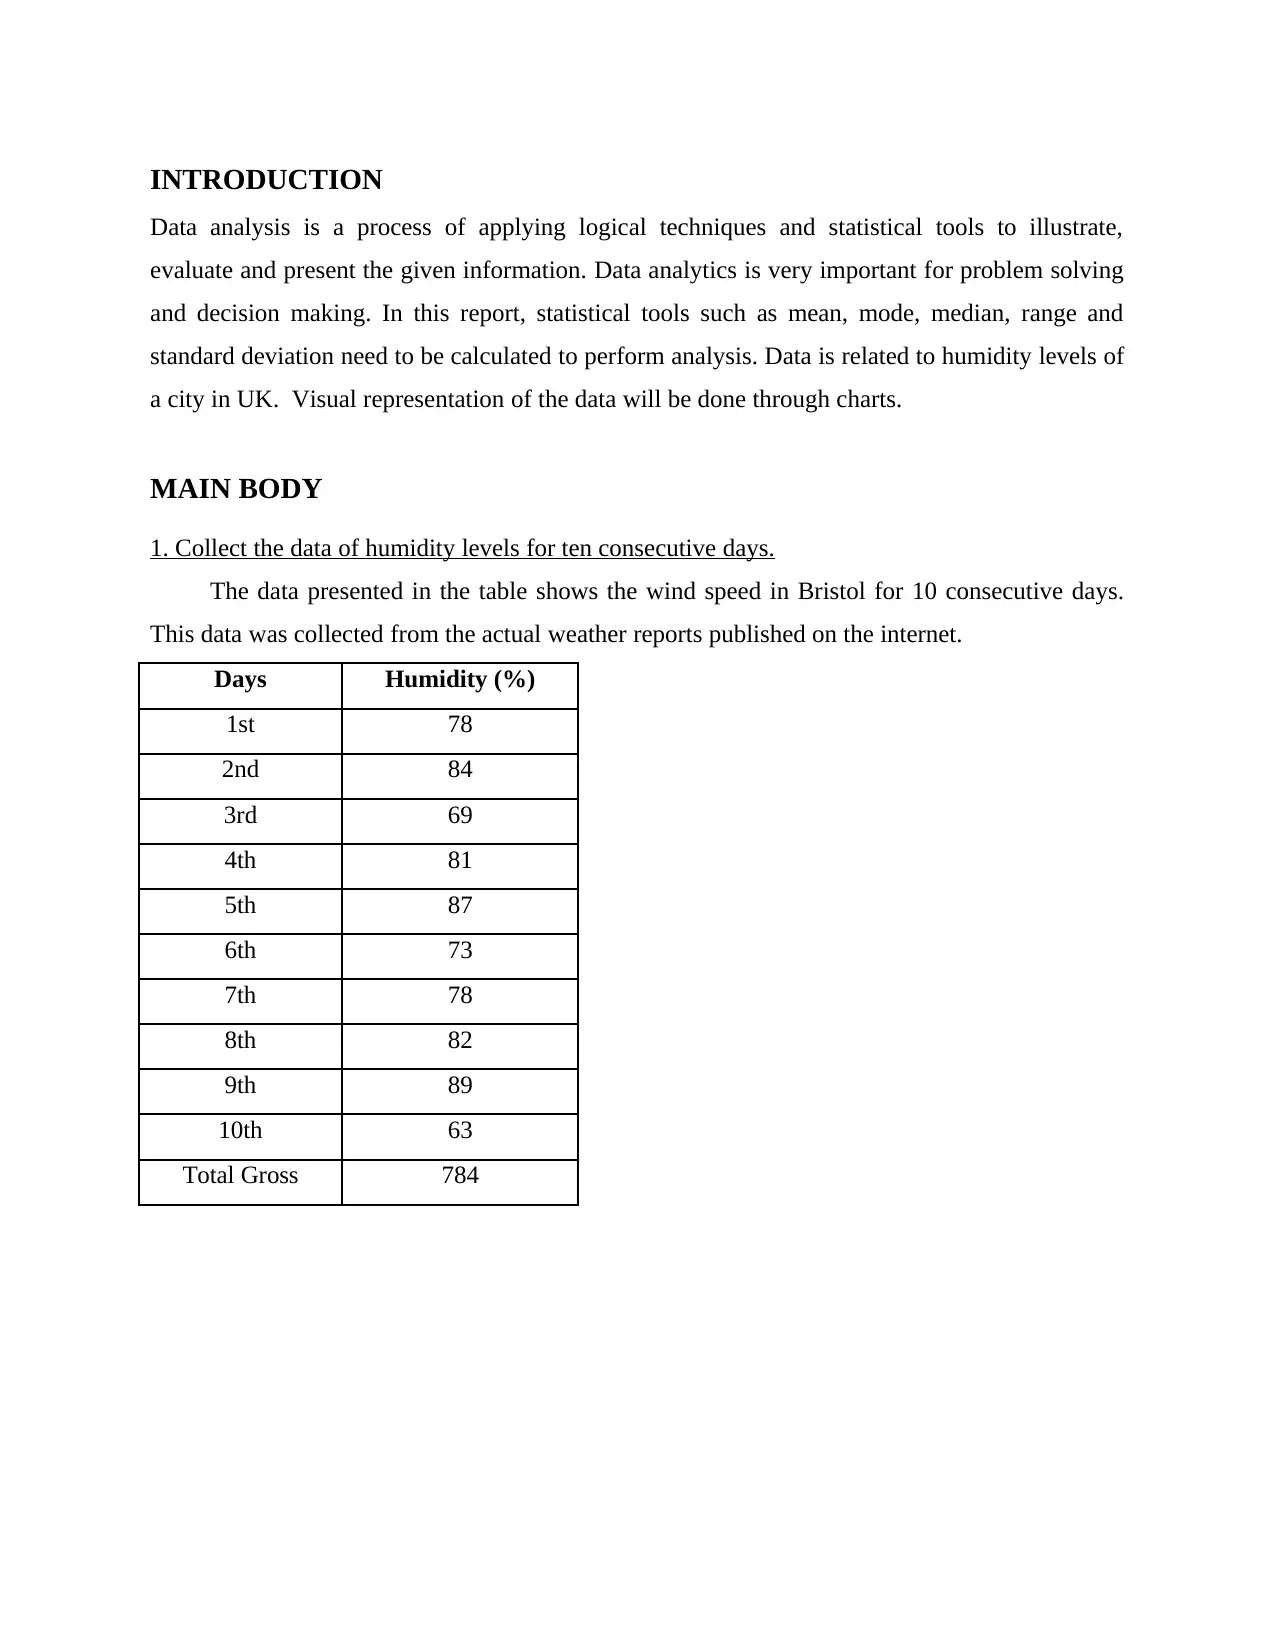
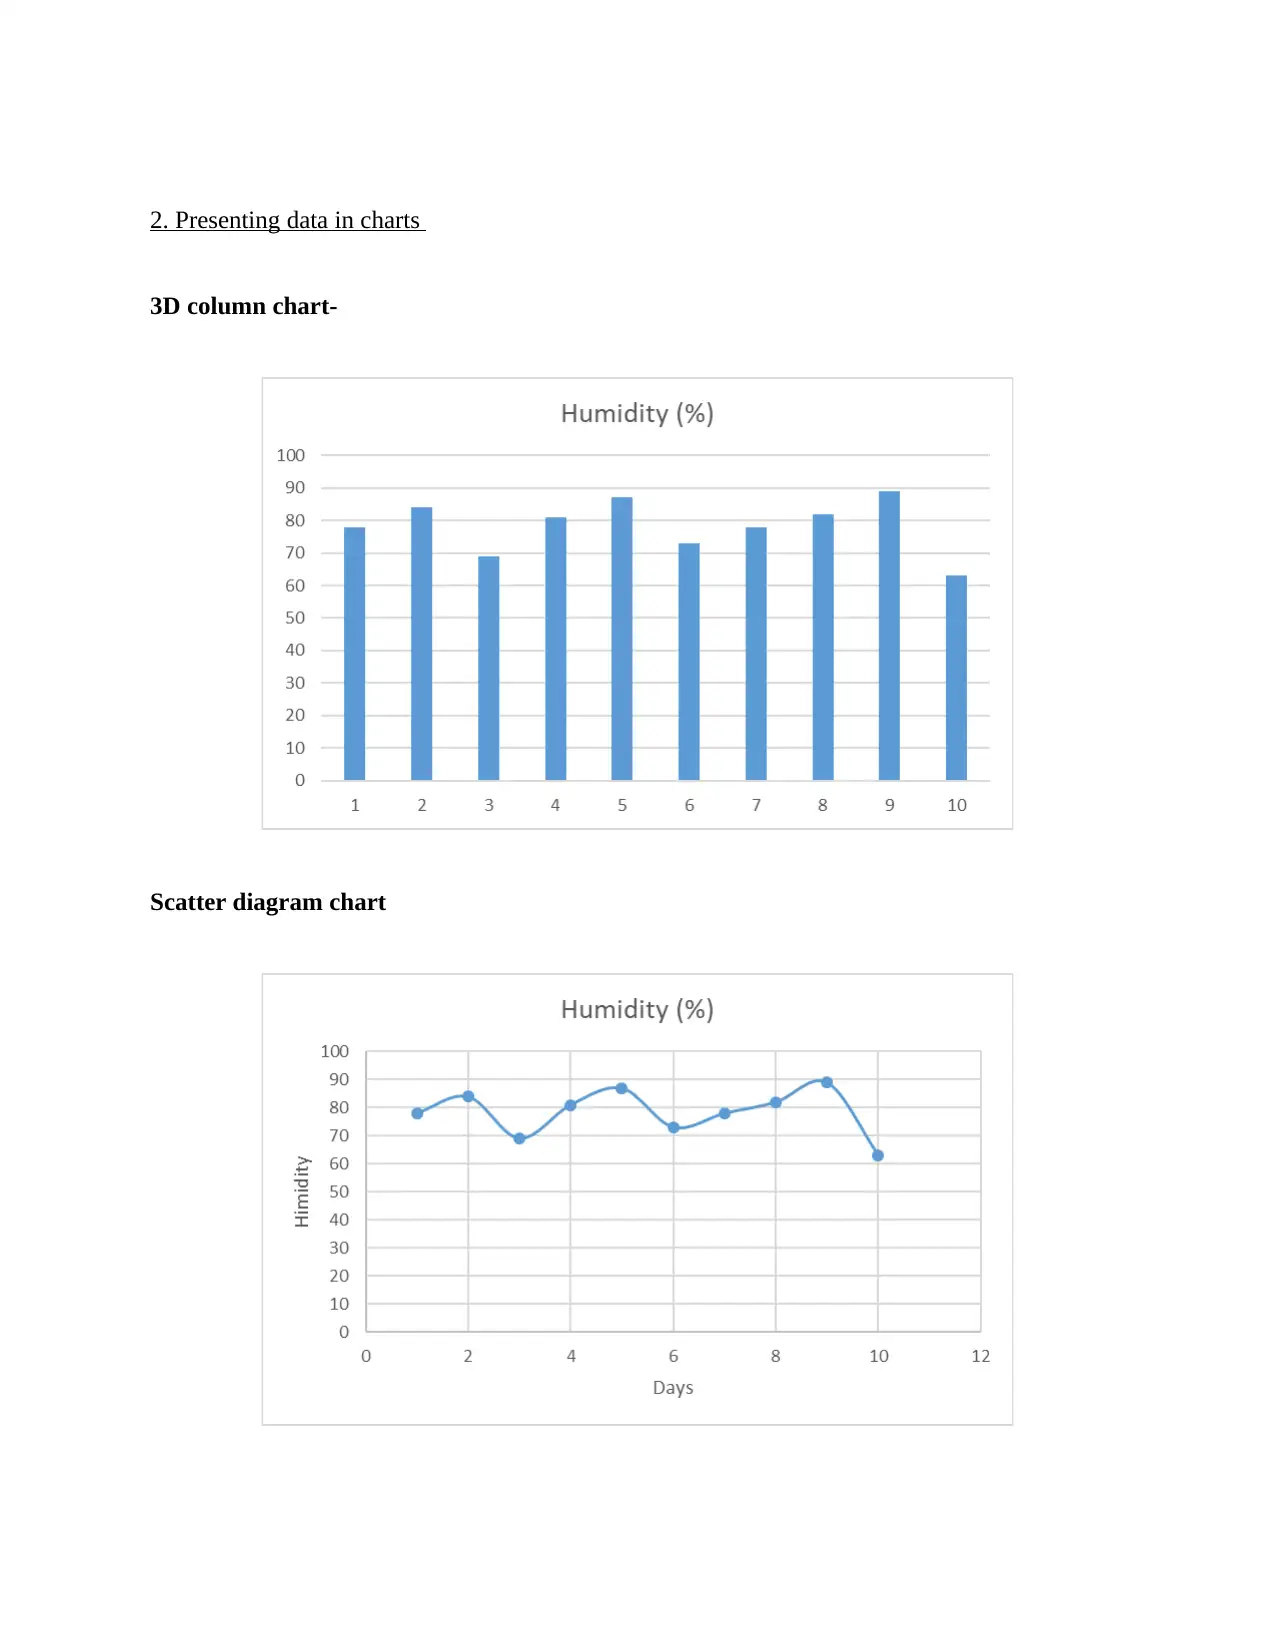
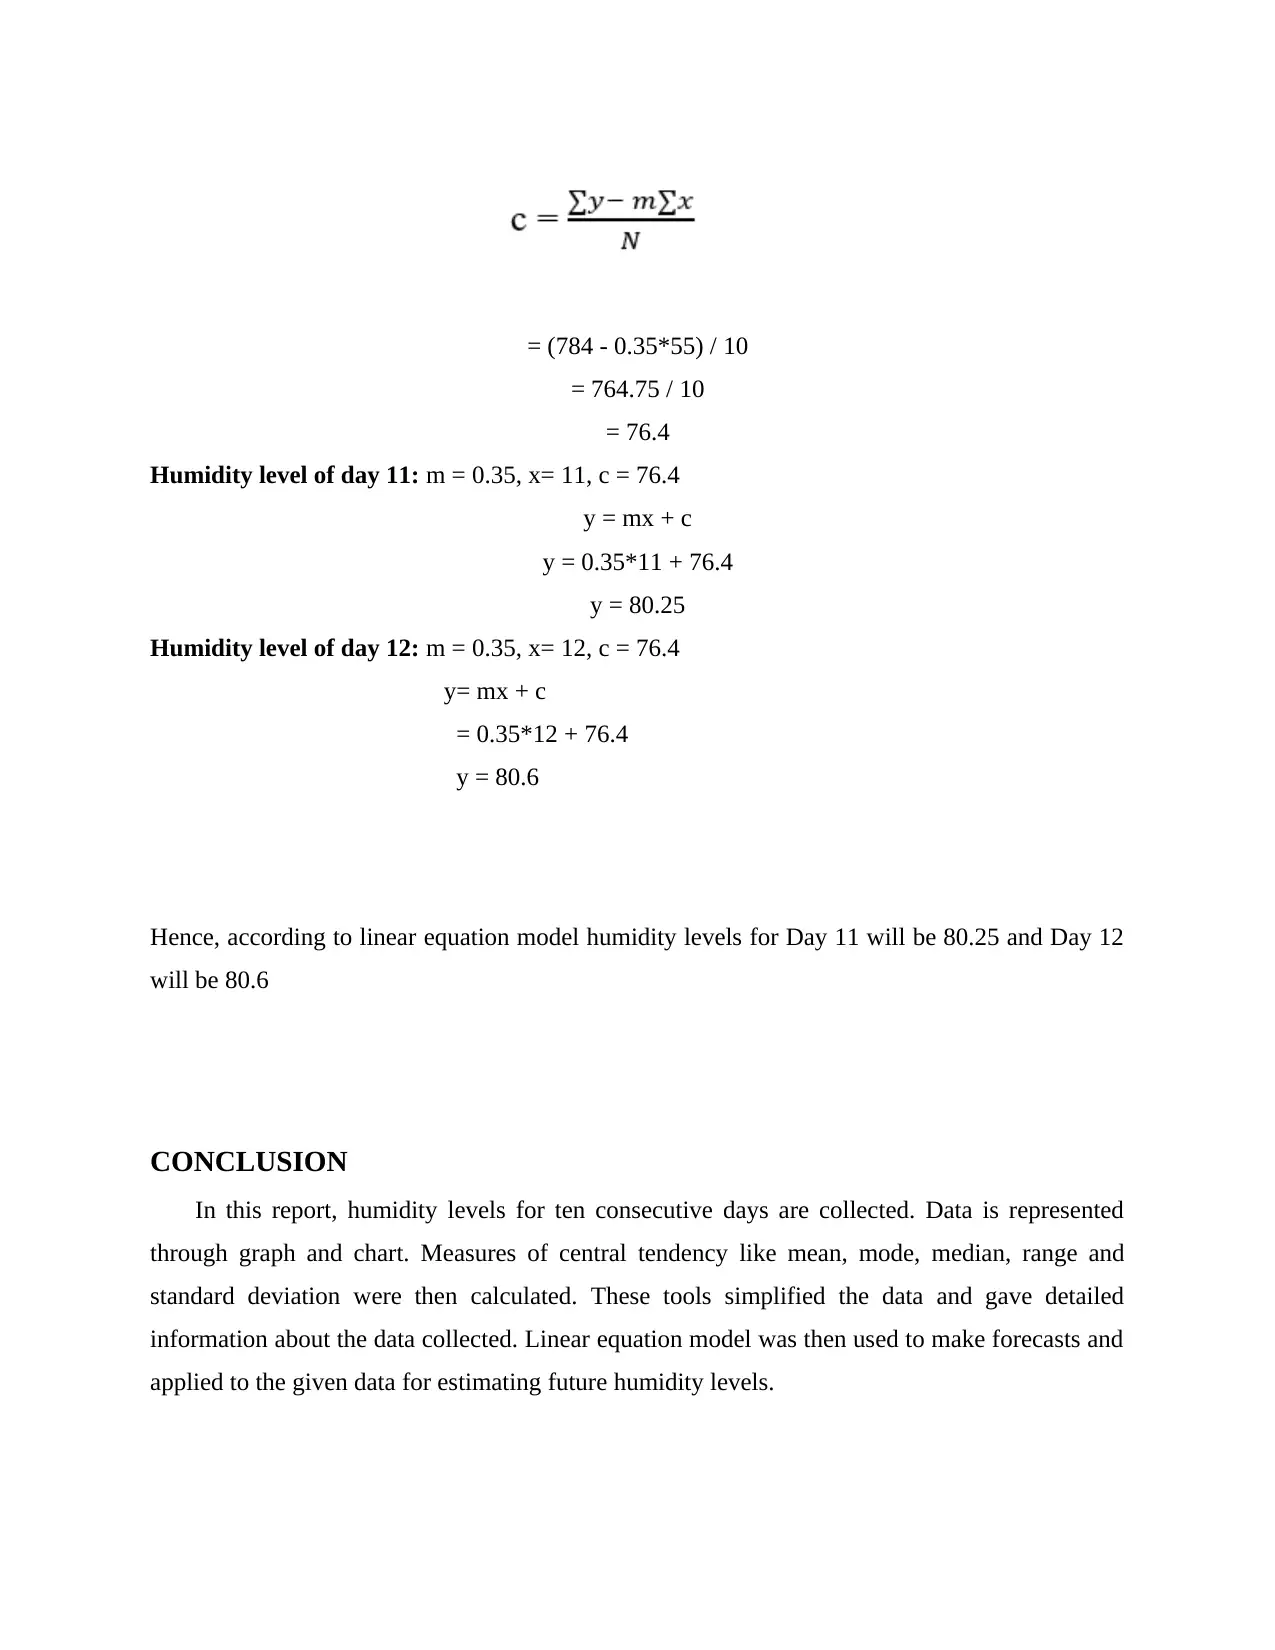
This report presents a data analysis of humidity levels collected over ten consecutive days in Bristol. The analysis begins with data collection and presentation using charts, followed by the calculation of key statistical measures including mean, mode, median, range, and standard deviation. These measures provide insights into the central tendencies and variability of the data. Furthermore, the report employs a linear equation model to forecast future humidity levels, demonstrating how historical data can be used for predictive analysis. The report concludes by summarizing the findings and highlighting the utility of the statistical tools and forecasting methods applied.
Document Page
Data Analysis and
Forecasting
tabler-icon-diamond-filled.svg

Paraphrase This Document

Need a fresh take? Get an instant paraphrase of this document with our AI Paraphraser
Document Page
Contents
Contents...........................................................................................................................................2
INTRODUCTION...........................................................................................................................1
1. Collect the data of humidity levels for ten consecutive days..................................................1
2. Presenting data in charts..........................................................................................................2
3. Calculating mean, mode, median, range and standard deviation:...........................................3
4. Calculating the value of 'm' and 'c' for using linear equation model.......................................6
CONCLUSION................................................................................................................................7
REFERENCES................................................................................................................................8
Document Page
INTRODUCTION
Data analysis is a process of applying logical techniques and statistical tools to illustrate,
evaluate and present the given information. Data analytics is very important for problem solving
and decision making. In this report, statistical tools such as mean, mode, median, range and
standard deviation need to be calculated to perform analysis. Data is related to humidity levels of
a city in UK. Visual representation of the data will be done through charts.
MAIN BODY
1. Collect the data of humidity levels for ten consecutive days.
The data presented in the table shows the wind speed in Bristol for 10 consecutive days.
This data was collected from the actual weather reports published on the internet.
Days Humidity (%)
1st 78
2nd 84
3rd 69
4th 81
5th 87
6th 73
7th 78
8th 82
9th 89
10th 63
Total Gross 784
Document Page
2. Presenting data in charts
3D column chart-
Scatter diagram chart
tabler-icon-diamond-filled.svg

Paraphrase This Document

Need a fresh take? Get an instant paraphrase of this document with our AI Paraphraser
Document Page
3. Calculating mean, mode, median, range and standard deviation:
Mean: It is one of the most common method for data analysis. Also known as averages, mean is
a single number that represents the whole data. In data analytics, it is very useful as it helps in
comparison of data sets.
Steps for calculating mean:
Step 1: Collect the data for analysis
Step 2: Compute the sum of all given data points.
Step 3: Count the number of observation.
Step 4: Divide sum by number of observations.
The formula of Mean: (μ) =

x

N
Key Findings
Number of days: 10
Sum of humidity levels: 784
Mean (μ): 784/10
Thus the mean is 78.4
Mode
Mode is the most occurring data value in a data set. It is useful as it provides insights into almost
any dataset despite their distribution and therefore useful for analysis.
Step 1: Organise data in ascending or descending order.
Step 2: Count the number of occurrence of every unique data point.
Step 4: Choose the value with highest occurrence.
Key Findings
Number of observation =10
Mode = 78
Thus as per the data given in the set about the humidity levels in Manchester, mode is 78%
Document Page
Median
It is a statistical method which divides data into two parts and finds the middle most value in the
data set. This method is preferred over mean if there are large outliers.
Days Humidity (%)
1st 78
2nd 84
3rd 69
4th 81
5th 87
6th 73
7th 78
8th 82
9th 89
10th 63
The number of days = 10
Median will be 5.5th term
Median = (78+81) / 2
Hence, it can be said that median is 79.5
Range
Range helps in determining the extreme values of the dataset.
Steps for finding range:
Step 1: Select the lowest and highest number.
Step 2: Subtract the lowest number from highest number.
Formulae for range = (Largest value smallest value)
Key Findings
Largest value = 89%
Document Page
Smallest value = 63%
Range = [89 – 63] = 26%
Thus the range is 26%
Standard Deviation
Step 1: To calculate standard deviation, we need to first calculate the mean.
Step 2: After that, subtract mean from each observation.
Step 3: Square the resulting values.
Step 4: Find the sum of the squared values.
Step 5: Divide the summation by total number of observations.
Step 6: Finally, take the square root of the result.
Standard deviation (σ) =√∑ (xi – μ) ^ 2 / N
Days Humidity (%) Mean (μ) (x-μ) (x-μ)^2
1st 78 78.4 (78 – 78.4) = -0.4 0.16
2nd 84 78.4 (84 – 78.4) = 5.6 31.36
3rd 69 78.4 (69 – 78.4) = -9.4 88.36
4th 81 78.4 (81 – 78.4) = 2.6 6.76
5th 87 78.4 (87 – 78.4) = 8.6 73.96
6th 73 78.4 (73 – 78.4) = -5.4 29.16
7th 78 78.4 (78 - 78.4) = -0.4 0.16
8th 82 78.4 (82 – 78.4) = 3.6 12.96
9th 89 78.4 (89 – 78.4) = 10.6 112.36
10th 63 78.4 (63 – 78.4) = -15.4 237.16
Total Gross 784 0 592.4
= √592.4/10
= 2.43
Key Findings: By applying the formula of standard deviation the results are 2.43
tabler-icon-diamond-filled.svg

Paraphrase This Document

Need a fresh take? Get an instant paraphrase of this document with our AI Paraphraser
Document Page
4. Calculating the value of 'm' and 'c' for using linear equation model.
Days Humidity (%)
1st 78
2nd 84
3rd 69
4th 81
5th 87
6th 73
7th 78
8th 82
9th 89
10th 63
Linear forecasting formula= (y = mx + c)
Linear prediction model: It is a statistical method which is used to forecast future values using
historical data.
Y= mx + c
here, 'y' is the dependent variable,
'x' is the independent variable,
'c' is constant,
‘m’ is slope.
M = (10*4283) - (55*784) / (10*385 – 3025)
= -290 / 825
= 0.35
Document Page
= (784 - 0.35*55) / 10
= 764.75 / 10
= 76.4
Humidity level of day 11: m = 0.35, x= 11, c = 76.4
y = mx + c
y = 0.35*11 + 76.4
y = 80.25
Humidity level of day 12: m = 0.35, x= 12, c = 76.4
y= mx + c
= 0.35*12 + 76.4
y = 80.6
Hence, according to linear equation model humidity levels for Day 11 will be 80.25 and Day 12
will be 80.6
CONCLUSION
In this report, humidity levels for ten consecutive days are collected. Data is represented
through graph and chart. Measures of central tendency like mean, mode, median, range and
standard deviation were then calculated. These tools simplified the data and gave detailed
information about the data collected. Linear equation model was then used to make forecasts and
applied to the given data for estimating future humidity levels.
Document Page
REFERENCES
Books and journals
Bengfort, B., Bilbro, R. and Ojeda, T., 2018. Applied text analysis with python: Enabling
language-aware data products with machine learning. " O'Reilly Media, Inc.".
Akhter, S., Pauyo, T. and Khan, M., 2019. What is the difference between a systematic review
and a meta-analysis?. Basic Methods Handbook for Clinical Orthopaedic
Research.pp.331-342.
Bokelmann, B. and Lessmann, S., 2019. Spurious patterns in Google Trends data-An analysis of
the effects on tourism demand forecasting in Germany. Tourism management, 75. pp.1-
12.
Wang, K., Qi, X. and Liu, H., 2019. Photovoltaic power forecasting based LSTM-Convolutional
Network. Energy, 189. p.116225.
Javed, S.A. and Cudjoe, D., 2022. A novel grey forecasting of greenhouse gas emissions from
four industries of China and India. Sustainable Production and Consumption, 29.
pp.777-790.
chevron_up_icon
1 out of 10
circle_padding
hide_on_mobile
zoom_out_icon
[object Object]