Numerical Analysis of Manchester Humidity Data with Forecasting

Verified

Added on  2023/01/16

|11
|1358
|30
Report
AI Summary
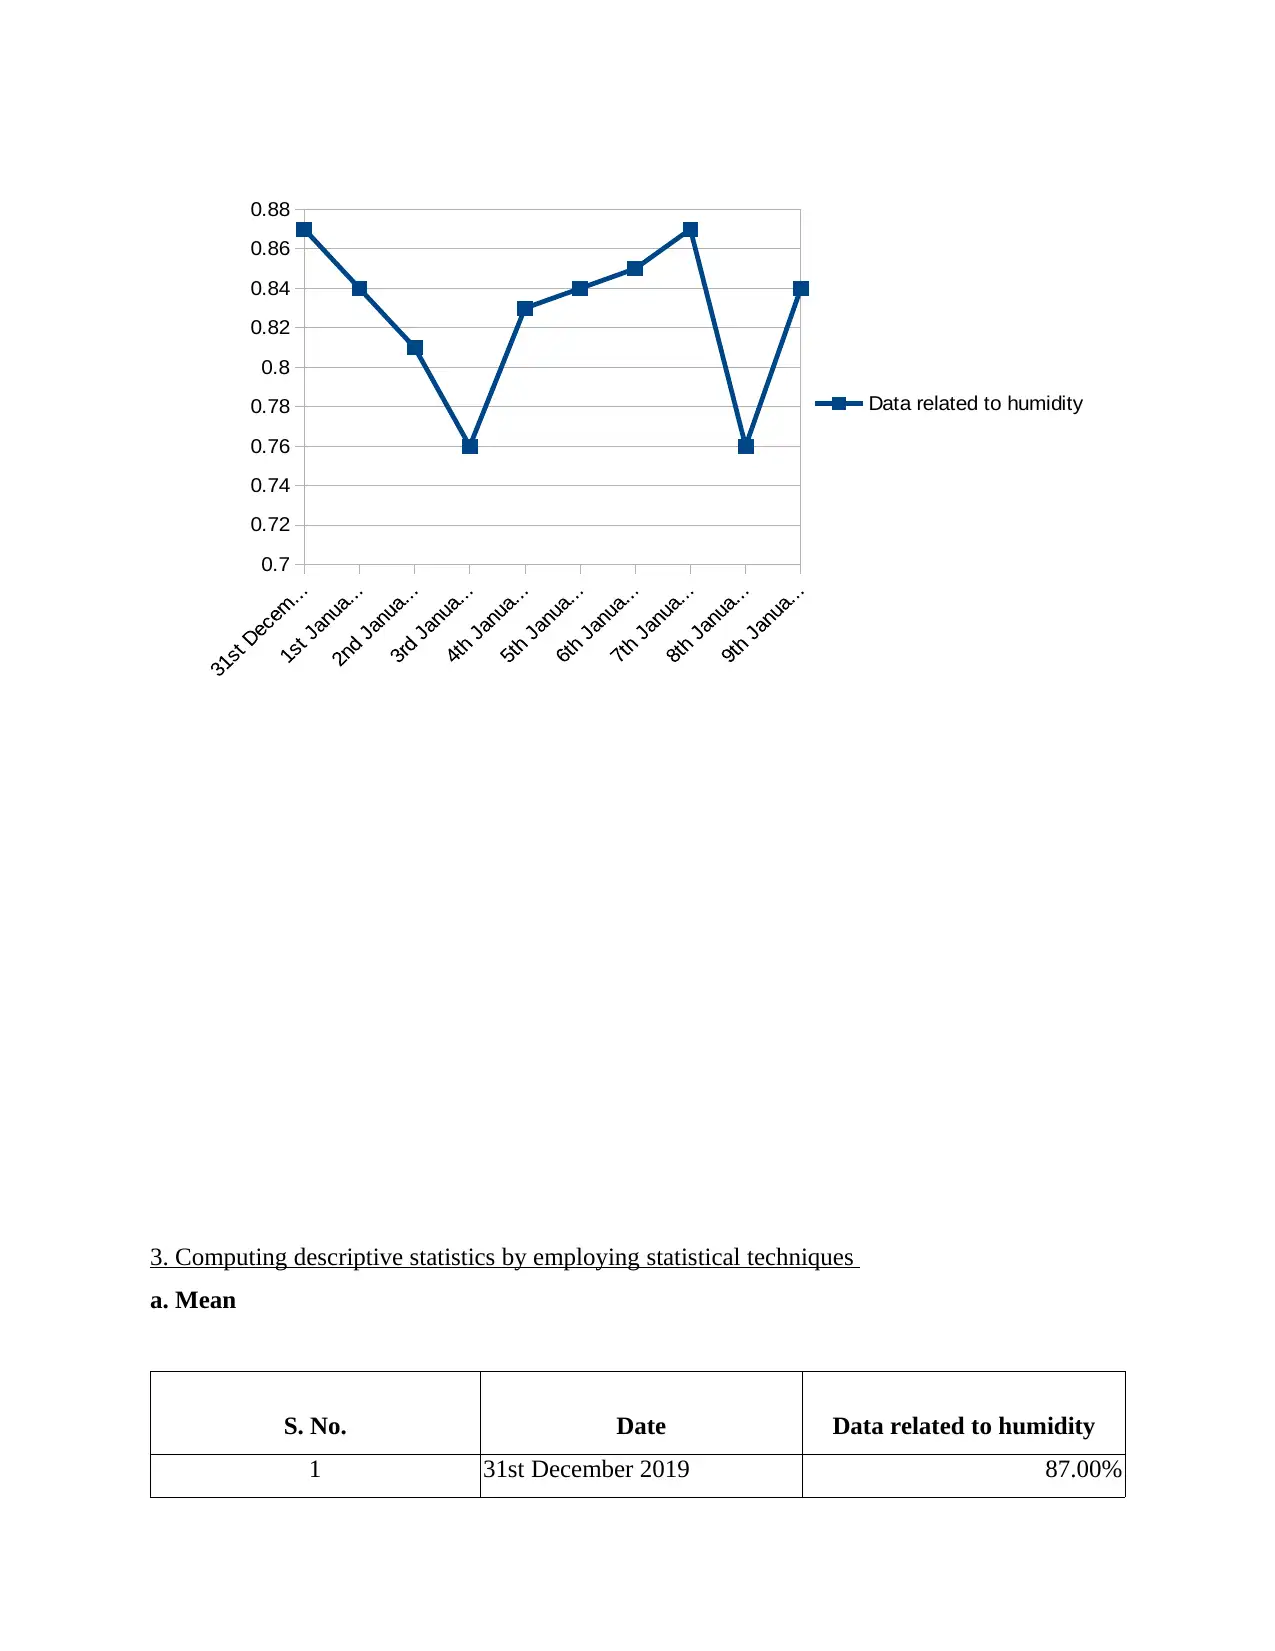
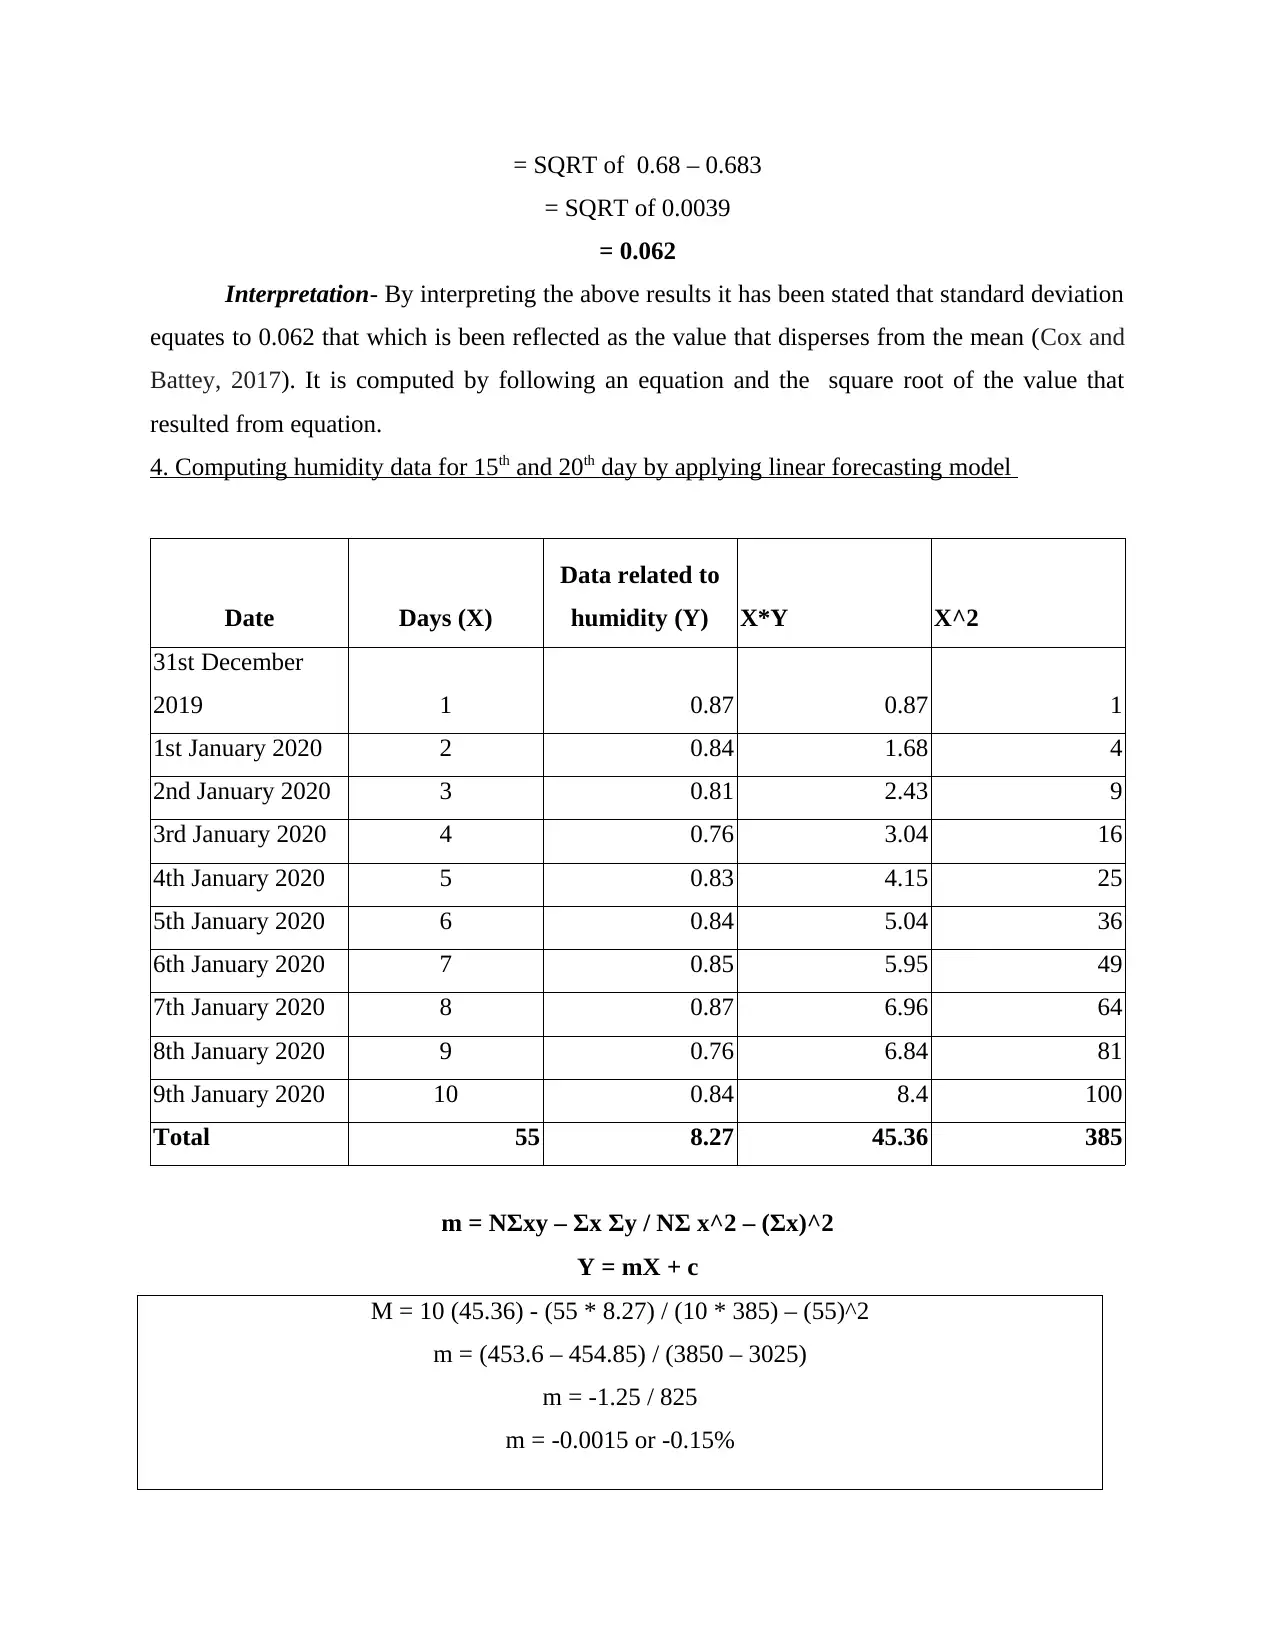
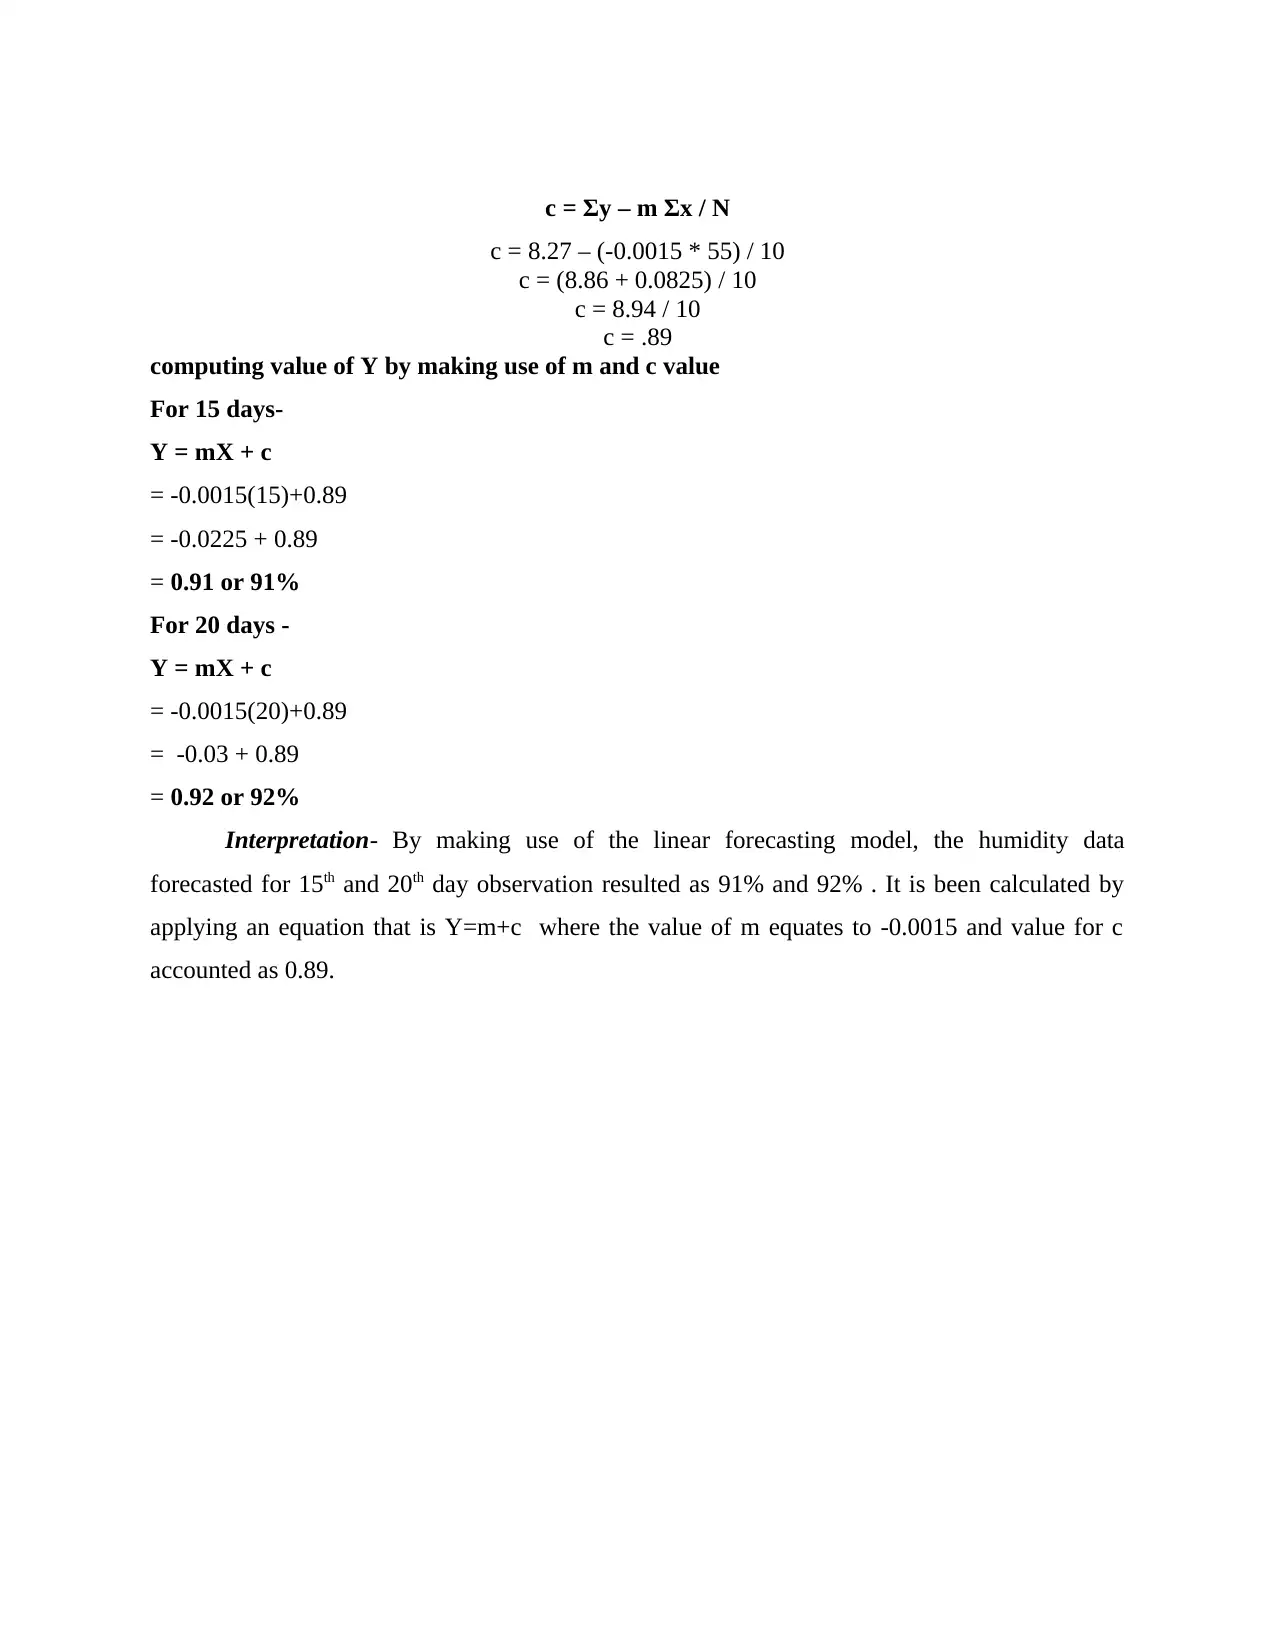
This report presents a detailed analysis of humidity data for Manchester, UK, over a 10-day period. The analysis begins with a table and graphical representations of the humidity data, followed by the computation of descriptive statistics including mean, median, mode, range, and standard deviation. The report also includes interpretations of each statistical measure. Furthermore, a linear forecasting model is applied to predict humidity levels for the 15th and 20th days. The report concludes with a summary of the findings, demonstrating the application of statistical techniques to analyze and forecast environmental data. References to relevant academic sources are also included.
Document Page
Numeracy and Data Analysis
tabler-icon-diamond-filled.svg

Secure Best Marks with AI Grader

Need help grading? Try our AI Grader for instant feedback on your assignments.
Document Page
Table of Contents
1. Humidity data in table form ....................................................................................................3
2. graphs ......................................................................................................................................3
3. Computing descriptive statistics by employing statistical techniques ....................................5
4. Computing humidity data for 15th and 20th day by applying linear forecasting model ........8
REFERENCES..............................................................................................................................11
Document Page
The present study is based on the Manchester, a city of UK present in England.
Furthermore, the study involves past humidity data of the city for the 10 days. Moreover,
descriptive values and forecasting will be presented for the coming days.
1. Humidity data in table form
S. No. Date Data related to humidity
1 31st December 2019 87.00%
2 1st January 2020 84.00%
3 2nd January 2020 81.00%
4 3rd January 2020 76.00%
5 4th January 2020 83.00%
6 5th January 2020 84.00%
7 6th January 2020 85.00%
8 7th January 2020 87.00%
9 8th January 2020 76.00%
10 9th January 2020 84.00%
2. graphs
Column chart
Document Page
Line graph
0.7
0.72
0.74
0.76
0.78
0.8
0.82
0.84
0.86
0.88 87.00%
84.00%
81.00%
76.00%
83.00%
84.00%
85.00%
87.00%
76.00%
84.00%
Data related to
humidity
tabler-icon-diamond-filled.svg

Secure Best Marks with AI Grader

Need help grading? Try our AI Grader for instant feedback on your assignments.
Document Page
3. Computing descriptive statistics by employing statistical techniques
a. Mean
S. No. Date Data related to humidity
1 31st December 2019 87.00%
0.7
0.72
0.74
0.76
0.78
0.8
0.82
0.84
0.86
0.88
Data related to humidity
Document Page
2 1st January 2020 84.00%
3 2nd January 2020 81.00%
4 3rd January 2020 76.00%
5 4th January 2020 83.00%
6 5th January 2020 84.00%
7 6th January 2020 85.00%
8 7th January 2020 87.00%
9 8th January 2020 76.00%
10 9th January 2020 84.00%
Sum of the data 827.00%
Total number of the days 10
Mean 82.70%
Interpretation- The above evaluation shows that the mean value for the humidity data of
Manchester for the 10 consecutive number of days attained as 82.70% (Zook and Pearce, 2018).
It is computed by dividing the sum of the humidity data resulted as 827% with that of the total
number of days that is 10.
b. Median
Step 1- Representing the data in ascending order
S. No. Date Data related to humidity
1 3rd January 2020 76.00%
2 8th January 2020 76.00%
3 2nd January 2020 81.00%
4 4th January 2020 83.00%
5 1st January 2020 84.00%
6 5th January 2020 84.00%
7 9th January 2020 84.00%
8 6th January 2020 85.00%
9 31st December 2019 87.00%
10 7th January 2020 87.00%
Document Page
Median observation (n+1)/2
(10+1)/2
5.5
Median value 5th observation+6th observation/2
(.84 + .84)/2
84.00%
Interpretation- From the above table it has been interpreted that the median value
accounted as 84% for the humidity data of Manchester (Chambers IV, 2018). It is been
computed by arranging the data into an ascending order and thereafter calculating the number of
observation by using the formula that is (n+1)/2 which resulted a value equating to 5.5. After this
average is been done of the 5th and the 6th observation in order to calculate accurate and exact
median value that is 84%.
c. Mode
S. No. Date Data related to humidity
1 3rd January 2020 76.00%
2 8th January 2020 76.00%
3 2nd January 2020 81.00%
4 4th January 2020 83.00%
5 1st January 2020 84.00%
6 5th January 2020 84.00%
7 9th January 2020 84.00%
8 6th January 2020 85.00%
9 31st December 2019 87.00%
10 7th January 2020 87.00%
tabler-icon-diamond-filled.svg

Paraphrase This Document

Need a fresh take? Get an instant paraphrase of this document with our AI Paraphraser
Document Page
Mode 84.00%
Interpretation- The evaluation shows that mode value resulted as 84% which is reflected
as the value that is repeated on a frequent basis among the dataset (Machester humidity data,
2018). Therefore, the value of mode in respect of Manchester humidity data is seen as 84%.
d. Range
Largest value 87.00%
Smallest value 76.00%
Range 11.00%
Interpretation- From an evaluation it has been analysed that the range value ascertained
as 11% or 0.11 which is expressed as the difference between maximum and minimum value.
e. Standard deviation
S. No. Date
Data related to
humidity (X) X^2
1 31st December 2019 0.87 0.76
2 1st January 2020 0.84 0.71
3 2nd January 2020 0.81 0.66
4 3rd January 2020 0.76 0.58
5 4th January 2020 0.83 0.69
6 5th January 2020 0.84 0.71
7 6th January 2020 0.85 0.72
8 7th January 2020 0.87 0.76
9 8th January 2020 0.76 0.58
10 9th January 2020 0.84 0.71
Total 8.27 6.8533
Standard deviation= Square root of ∑x^2 / N – (∑x / n) ^ 2
= SQRT of (6.85 / 10) – (8.27 / 10) ^ 2
Document Page
= SQRT of 0.68 – 0.683
= SQRT of 0.0039
= 0.062
Interpretation- By interpreting the above results it has been stated that standard deviation
equates to 0.062 that which is been reflected as the value that disperses from the mean (Cox and
Battey, 2017). It is computed by following an equation and the square root of the value that
resulted from equation.
4. Computing humidity data for 15th and 20th day by applying linear forecasting model
Date Days (X)
Data related to
humidity (Y) X*Y X^2
31st December
2019 1 0.87 0.87 1
1st January 2020 2 0.84 1.68 4
2nd January 2020 3 0.81 2.43 9
3rd January 2020 4 0.76 3.04 16
4th January 2020 5 0.83 4.15 25
5th January 2020 6 0.84 5.04 36
6th January 2020 7 0.85 5.95 49
7th January 2020 8 0.87 6.96 64
8th January 2020 9 0.76 6.84 81
9th January 2020 10 0.84 8.4 100
Total 55 8.27 45.36 385
m = NΣxy – Σx Σy / NΣ x^2 – (Σx)^2
Y = mX + c
M = 10 (45.36) - (55 * 8.27) / (10 * 385) – (55)^2
m = (453.6 – 454.85) / (3850 – 3025)
m = -1.25 / 825
m = -0.0015 or -0.15%
Document Page
c = Σy – m Σx / N
c = 8.27 – (-0.0015 * 55) / 10
c = (8.86 + 0.0825) / 10
c = 8.94 / 10
c = .89
computing value of Y by making use of m and c value
For 15 days-
Y = mX + c
= -0.0015(15)+0.89
= -0.0225 + 0.89
= 0.91 or 91%
For 20 days -
Y = mX + c
= -0.0015(20)+0.89
= -0.03 + 0.89
= 0.92 or 92%
Interpretation- By making use of the linear forecasting model, the humidity data
forecasted for 15th and 20th day observation resulted as 91% and 92% . It is been calculated by
applying an equation that is Y=m+c where the value of m equates to -0.0015 and value for c
accounted as 0.89.
tabler-icon-diamond-filled.svg

Secure Best Marks with AI Grader

Need help grading? Try our AI Grader for instant feedback on your assignments.
Document Page
REFERENCES
Books and journals
Chambers IV, E., 2018. Consensus methods for descriptive analysis. Descriptive analysis in
sensory evaluation. pp.213-236.
Cox, D. R. and Battey, H. S., 2017. Large numbers of explanatory variables, a semi-descriptive
analysis. Proceedings of the National Academy of Sciences. 114(32). pp.8592-8595.
Zook, K. L. and Pearce, J. H., 2018. Quantitative descriptive analysis. In Applied Sensory Analy
of Foods (pp. 43-71). Routledge.
Online
Machester humidity data. 2018. [Online]. Available through:
<https://www.timeanddate.com/weather/uk/manchester/historic>
chevron_up_icon
1 out of 11
circle_padding
hide_on_mobile
zoom_out_icon
logo.png

Your All-in-One AI-Powered Toolkit for Academic Success.

Available 24*7 on WhatsApp / Email

[object Object]