Data Analysis Report: London Humidity Levels and Forecasting
VerifiedAdded on 2023/01/16
|10
|1435
|88
Report
AI Summary
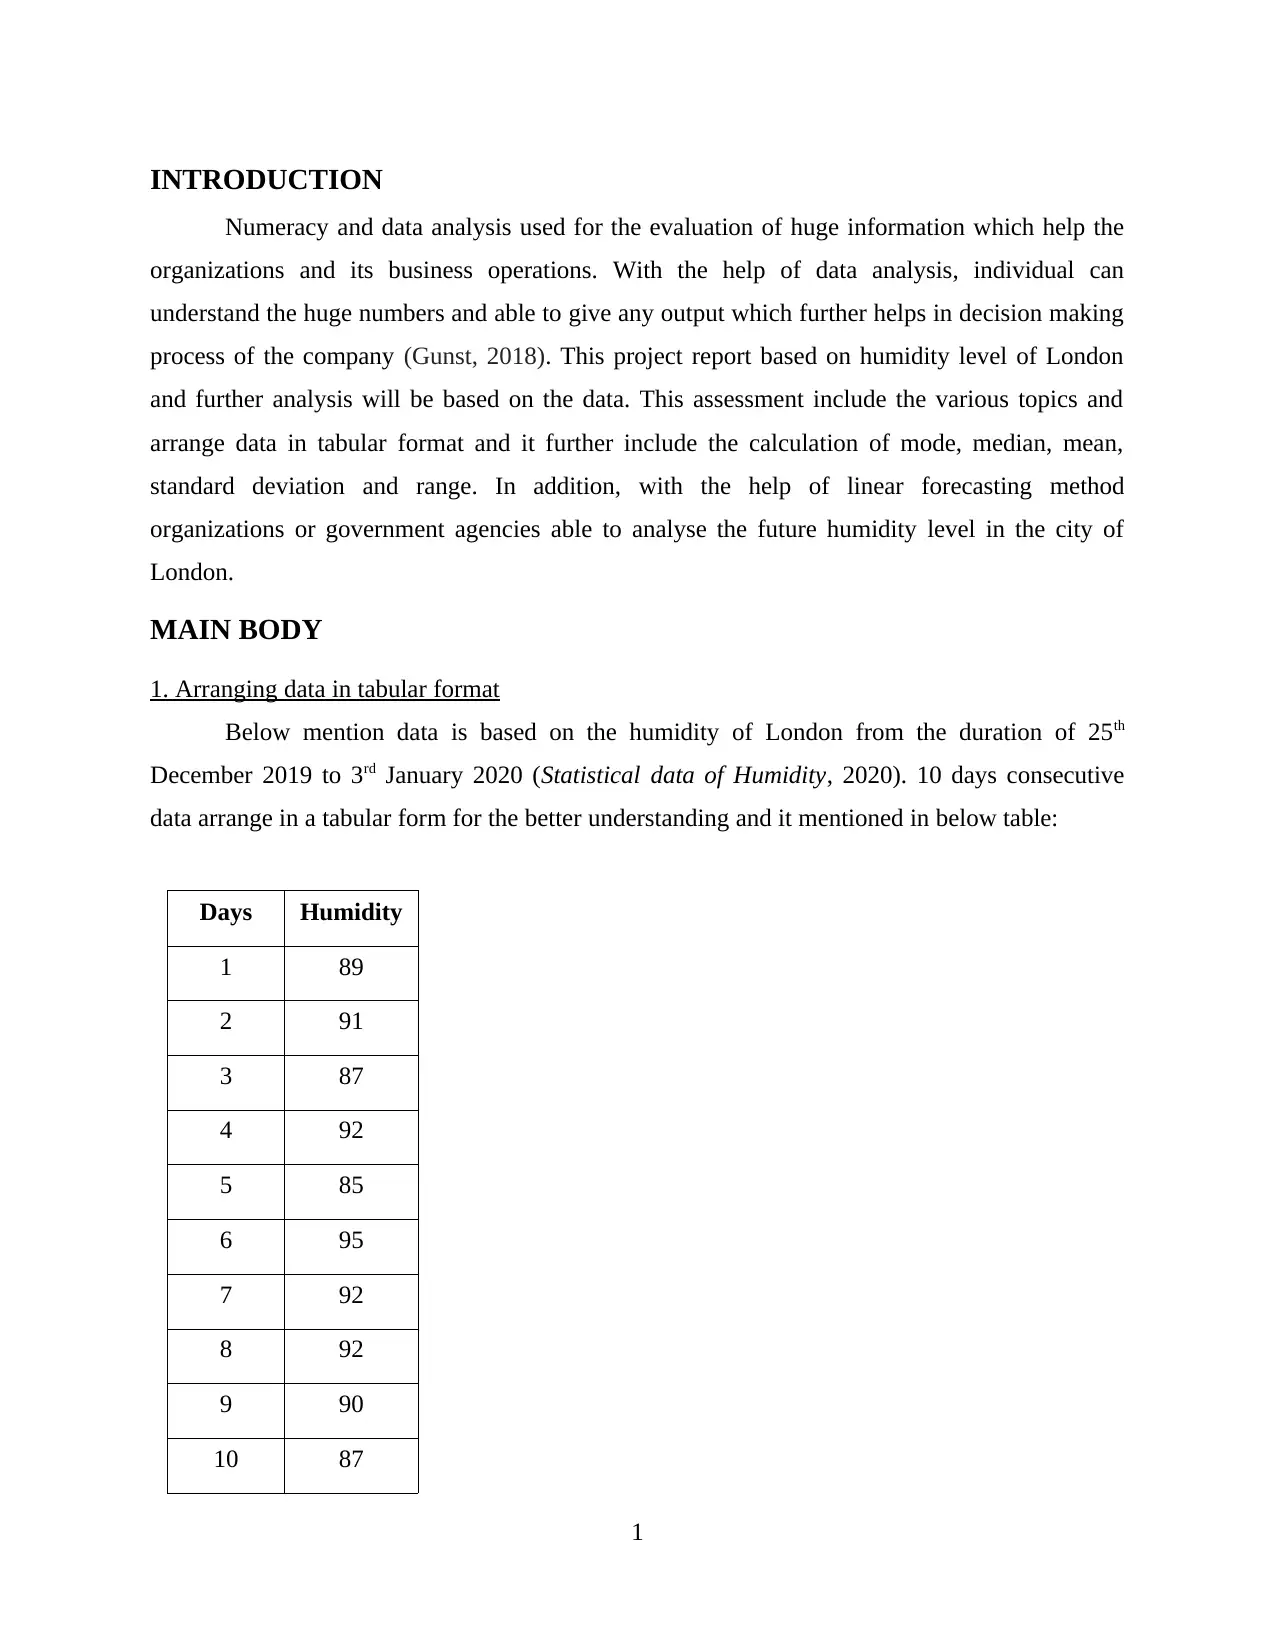
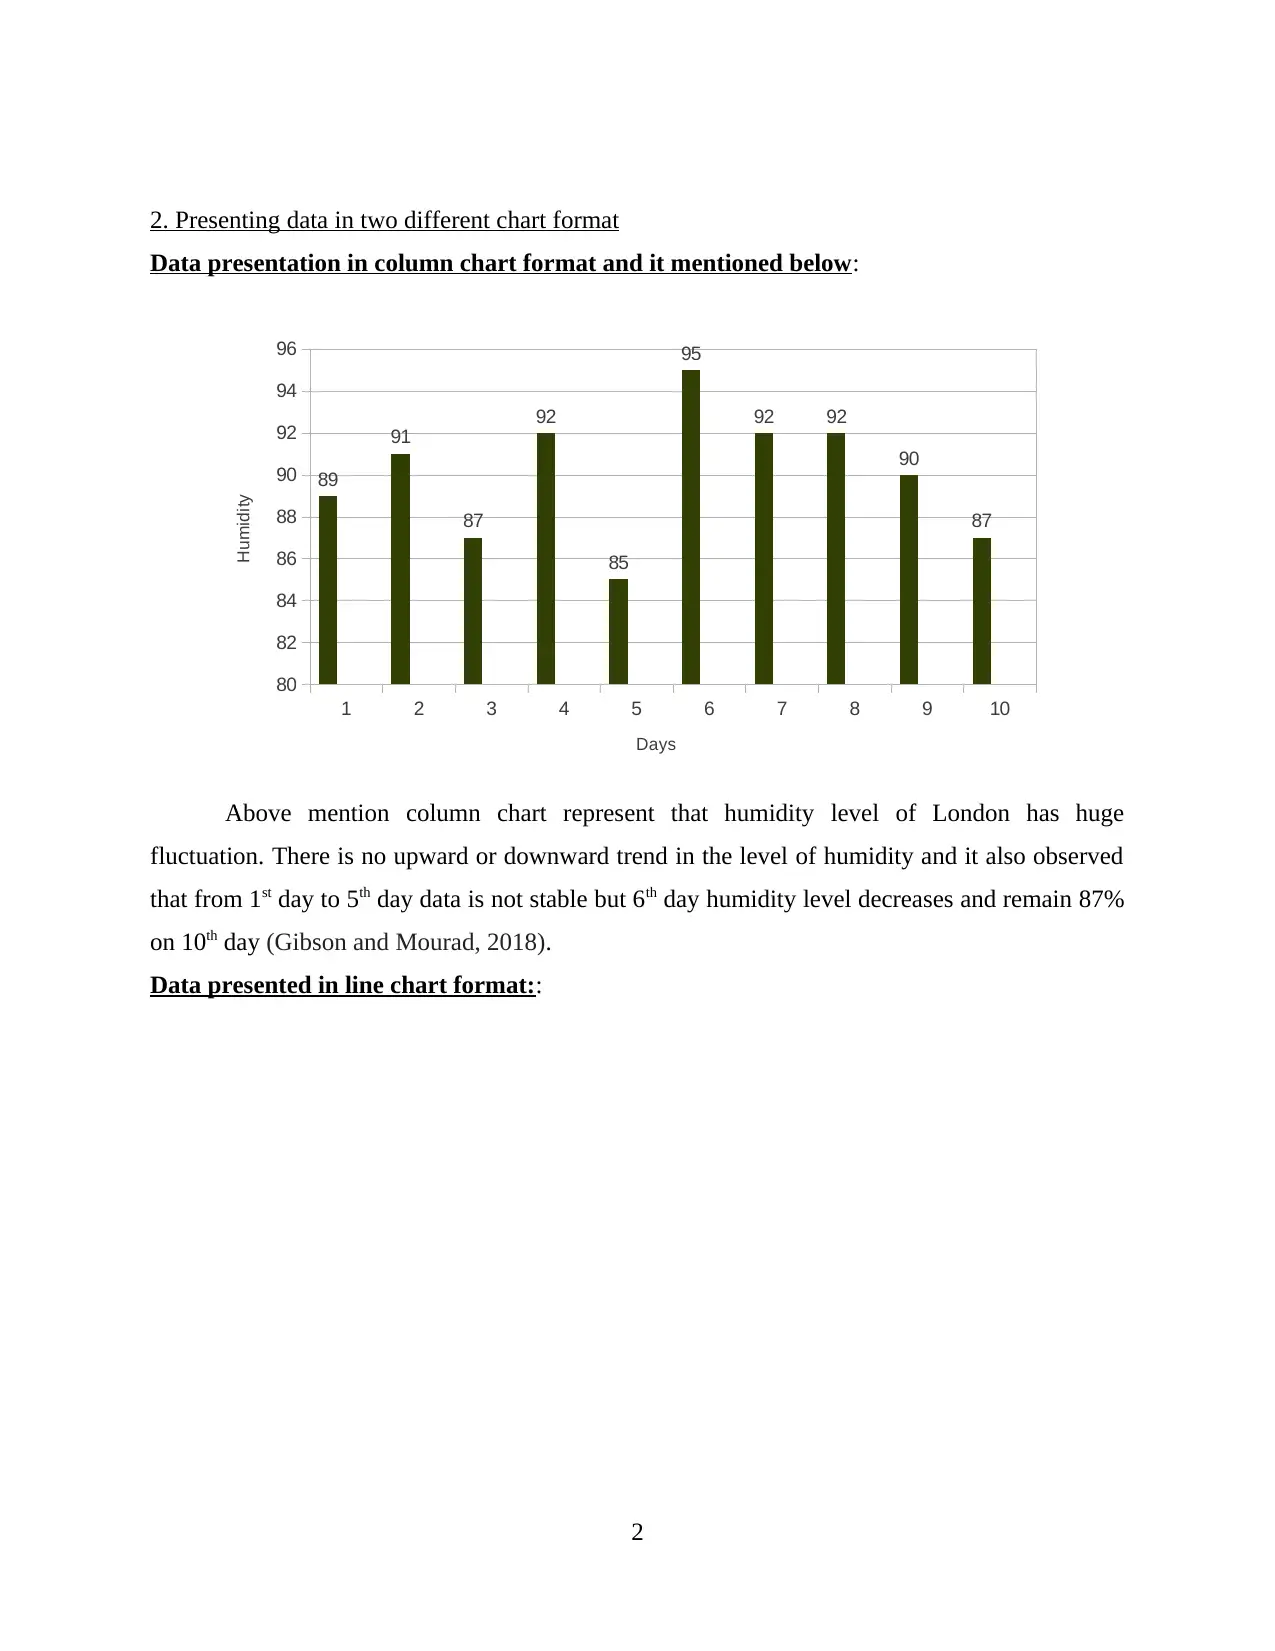
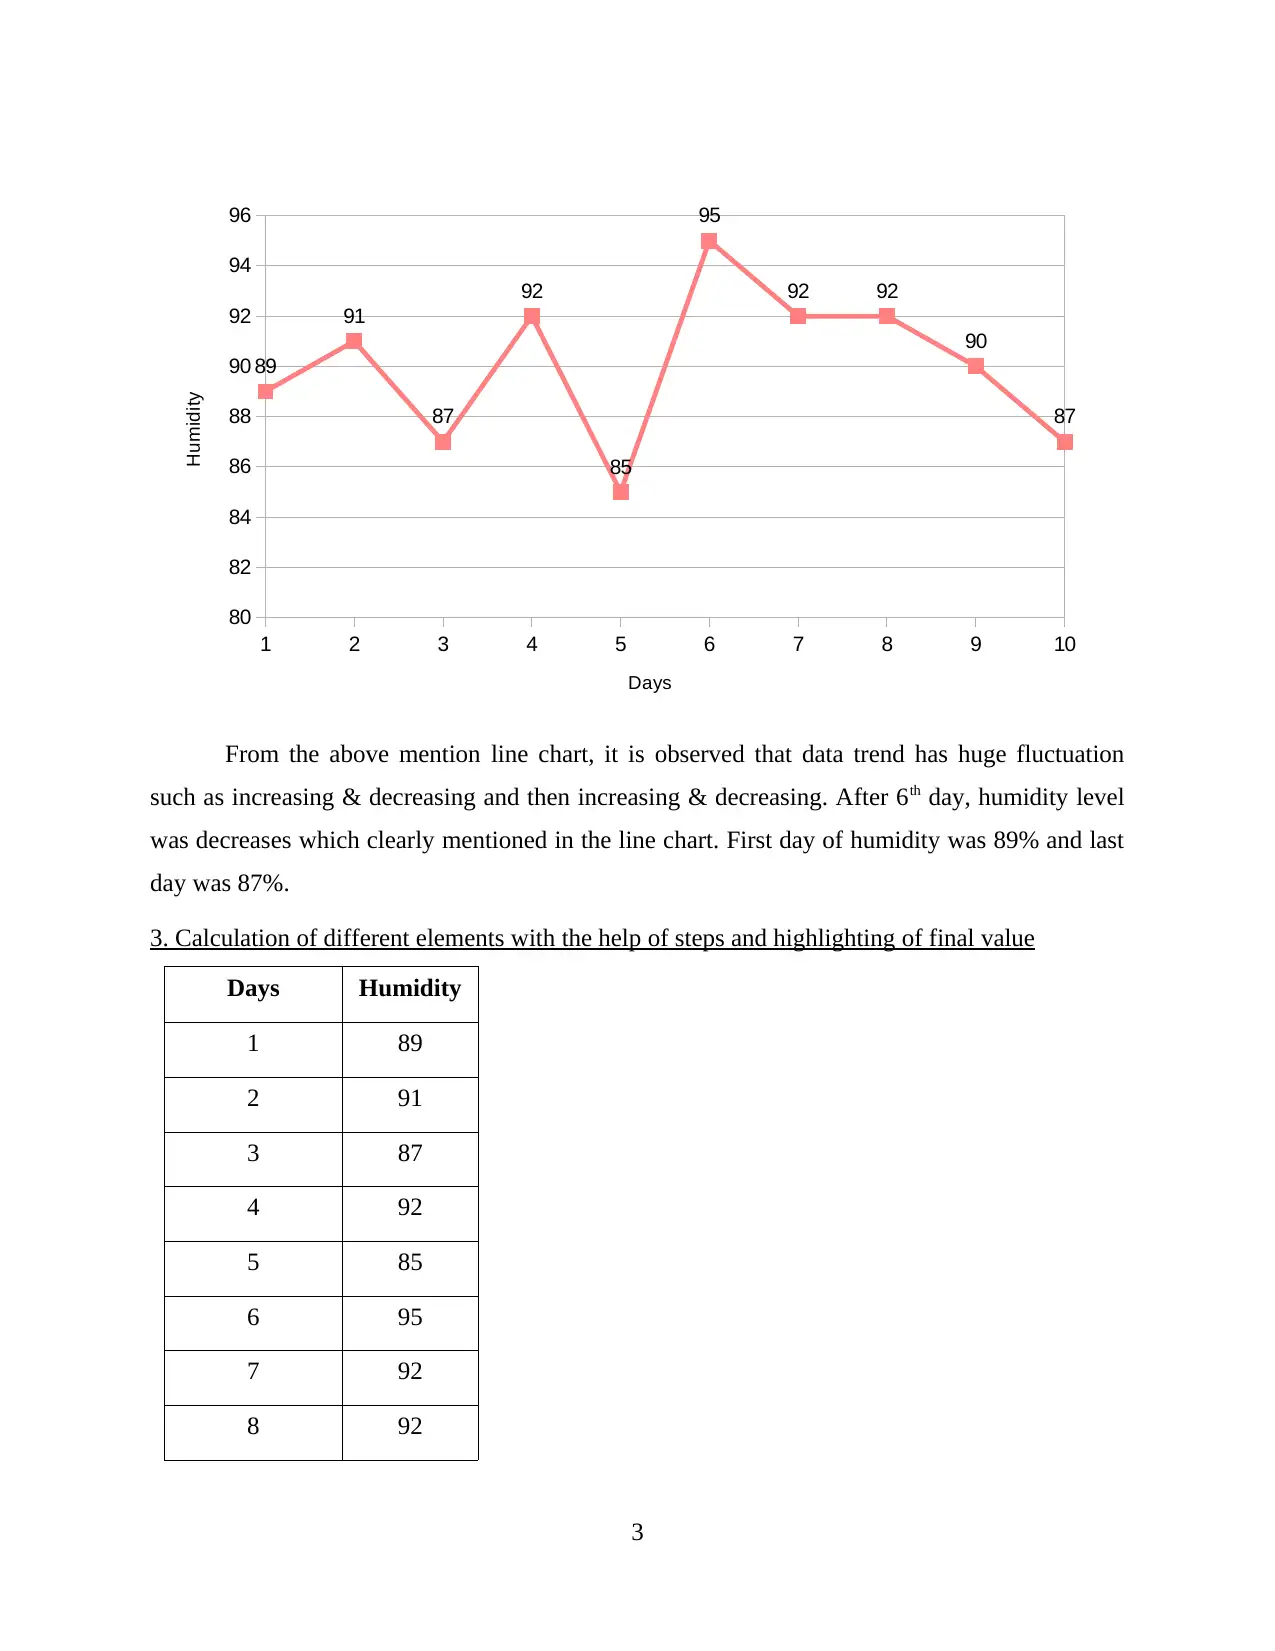
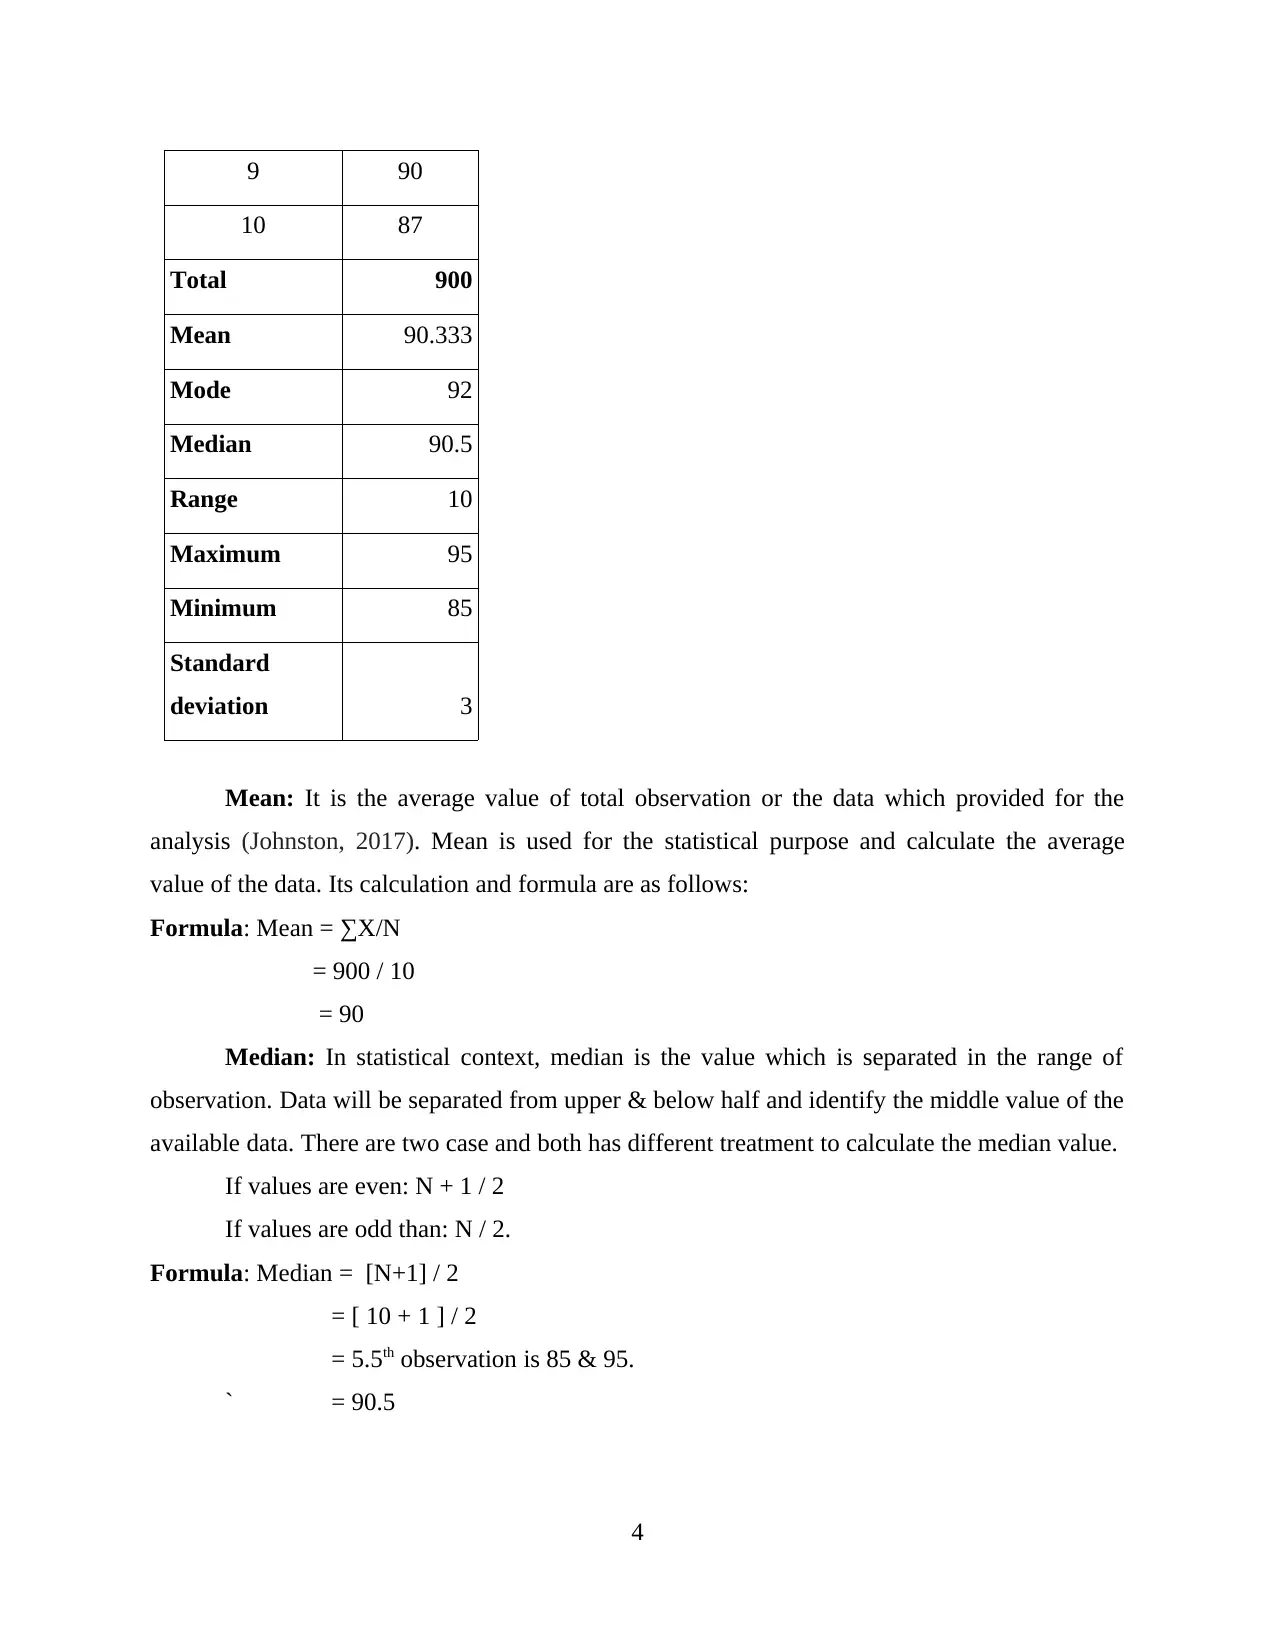
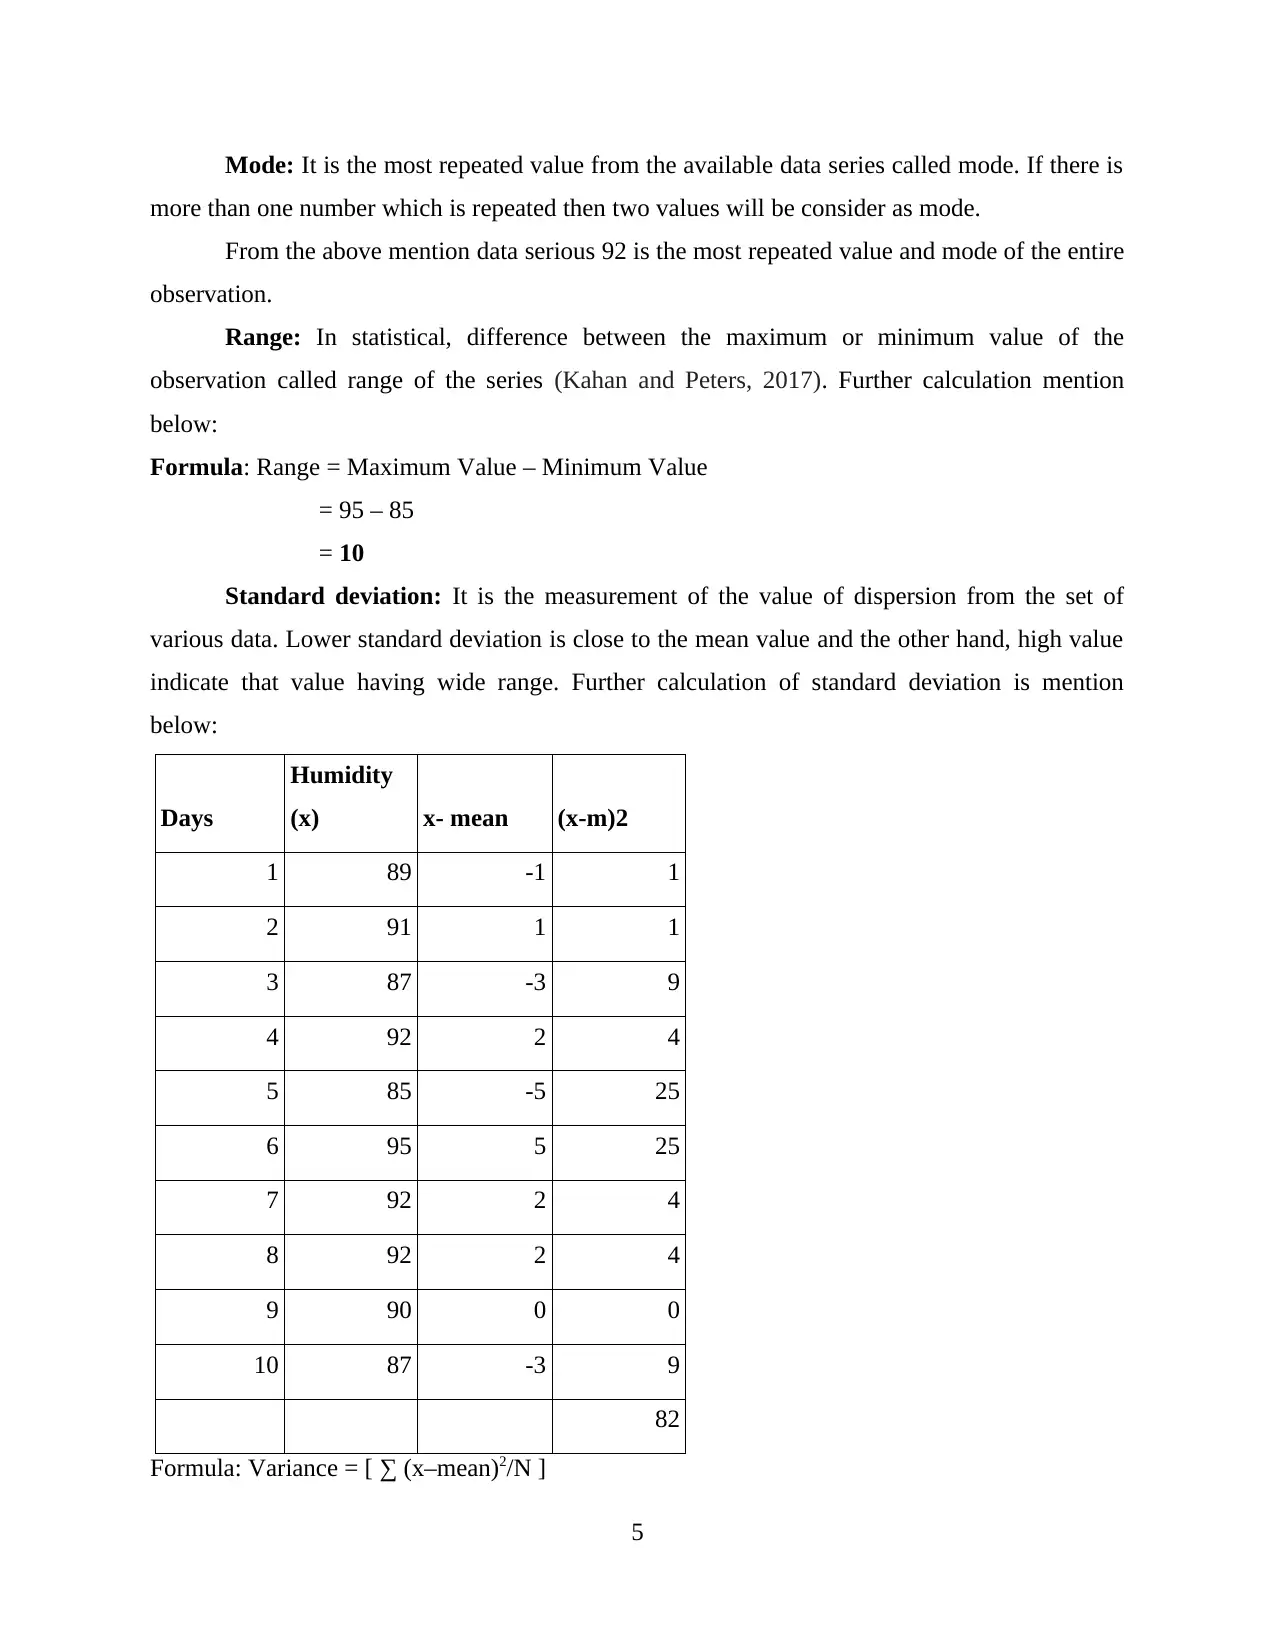
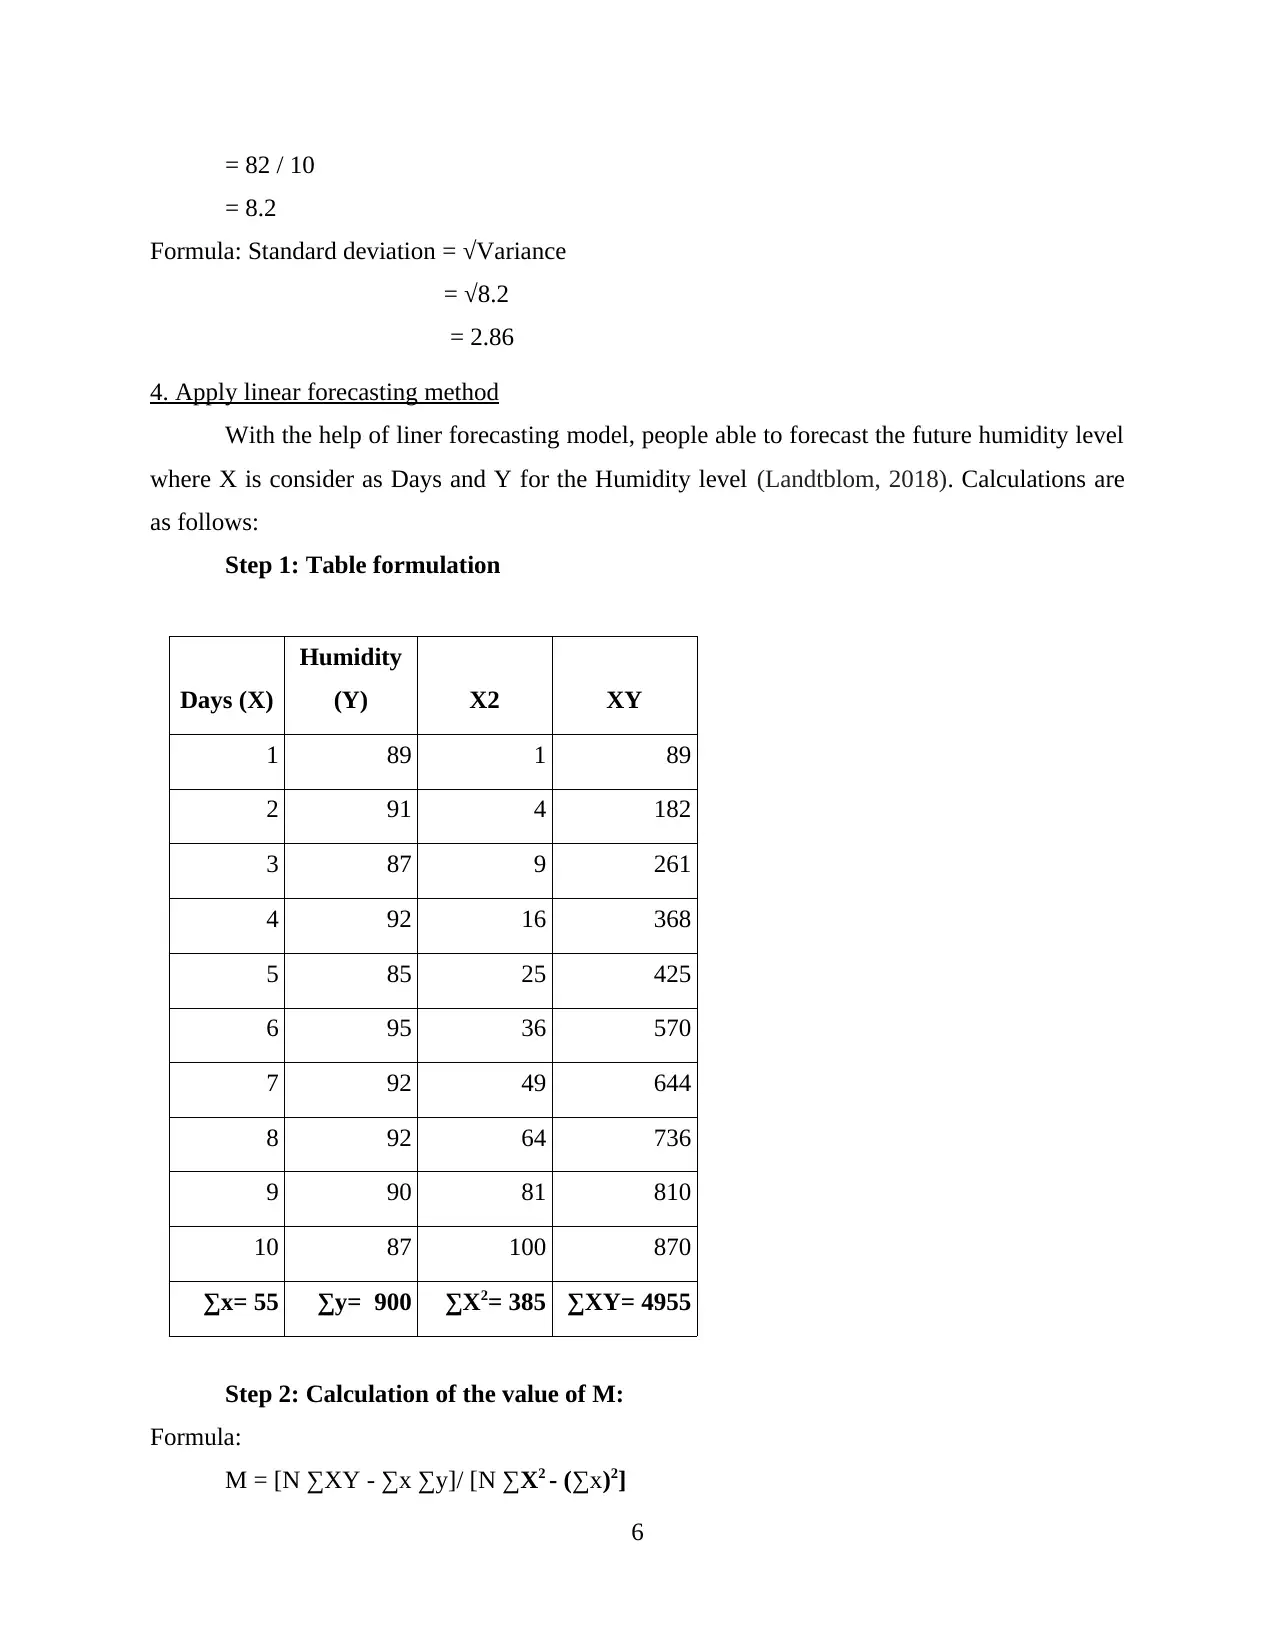
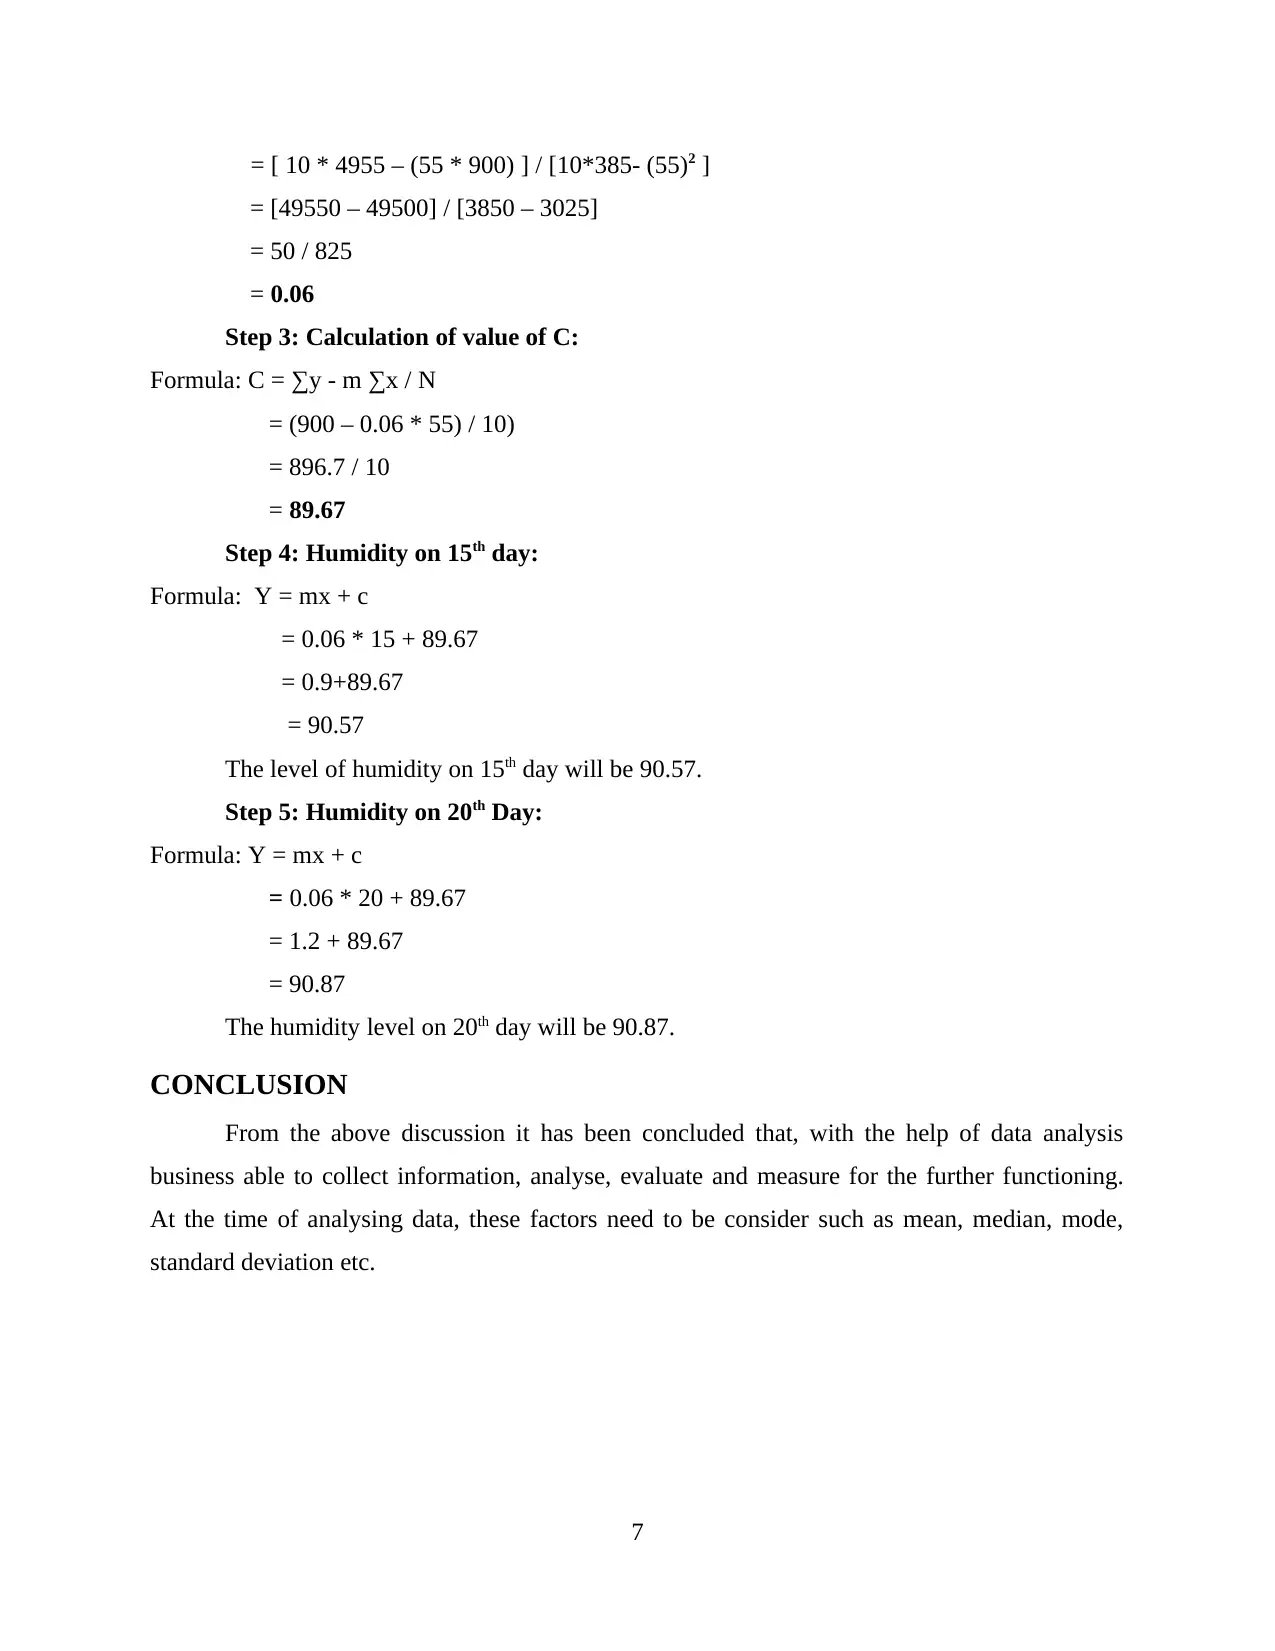
This report provides a comprehensive analysis of London's humidity levels from December 2019 to January 2020. The analysis begins with arranging the data in a tabular format, followed by presenting the data using column and line charts to visualize trends and fluctuations. Furthermore, the rep...
Read More
Contribute Materials
Your contribution can guide someone’s learning journey. Share your
documents today.

Numeracy and
Data Analysis
Data Analysis
Secure Best Marks with AI Grader
Need help grading? Try our AI Grader for instant feedback on your assignments.

Table of Contents
INTRODUCTION...........................................................................................................................1
MAIN BODY...................................................................................................................................1
1. Arranging data in tabular format..............................................................................................1
2. Presenting data in two different chart format..........................................................................1
3. Calculation of different elements with the help of steps and highlighting of final value........3
4. Apply linear forecasting method..............................................................................................5
CONCLUSION................................................................................................................................6
REFERENCES................................................................................................................................7

INTRODUCTION
Numeracy and data analysis used for the evaluation of huge information which help the
organizations and its business operations. With the help of data analysis, individual can
understand the huge numbers and able to give any output which further helps in decision making
process of the company (Gunst, 2018). This project report based on humidity level of London
and further analysis will be based on the data. This assessment include the various topics and
arrange data in tabular format and it further include the calculation of mode, median, mean,
standard deviation and range. In addition, with the help of linear forecasting method
organizations or government agencies able to analyse the future humidity level in the city of
London.
MAIN BODY
1. Arranging data in tabular format
Below mention data is based on the humidity of London from the duration of 25th
December 2019 to 3rd January 2020 (Statistical data of Humidity, 2020). 10 days consecutive
data arrange in a tabular form for the better understanding and it mentioned in below table:
Days Humidity
1 89
2 91
3 87
4 92
5 85
6 95
7 92
8 92
9 90
10 87
1

2. Presenting data in two different chart format
Data presentation in column chart format and it mentioned below:
1 2 3 4 5 6 7 8 9 10
80
82
84
86
88
90
92
94
96
89
91
87
92
85
95
92 92
90
87
Days
Humidity
Above mention column chart represent that humidity level of London has huge
fluctuation. There is no upward or downward trend in the level of humidity and it also observed
that from 1st day to 5th day data is not stable but 6th day humidity level decreases and remain 87%
on 10th day (Gibson and Mourad, 2018).
Data presented in line chart format::
2
Secure Best Marks with AI Grader
Need help grading? Try our AI Grader for instant feedback on your assignments.

1 2 3 4 5 6 7 8 9 10
80
82
84
86
88
90
92
94
96
89
91
87
92
85
95
92 92
90
87
Days
Humidity
From the above mention line chart, it is observed that data trend has huge fluctuation
such as increasing & decreasing and then increasing & decreasing. After 6th day, humidity level
was decreases which clearly mentioned in the line chart. First day of humidity was 89% and last
day was 87%.
3. Calculation of different elements with the help of steps and highlighting of final value
Days Humidity
1 89
2 91
3 87
4 92
5 85
6 95
7 92
8 92
3

9 90
10 87
Total 900
Mean 90.333
Mode 92
Median 90.5
Range 10
Maximum 95
Minimum 85
Standard
deviation 3
Mean: It is the average value of total observation or the data which provided for the
analysis (Johnston, 2017). Mean is used for the statistical purpose and calculate the average
value of the data. Its calculation and formula are as follows:
Formula: Mean = ∑X/N
= 900 / 10
= 90
Median: In statistical context, median is the value which is separated in the range of
observation. Data will be separated from upper & below half and identify the middle value of the
available data. There are two case and both has different treatment to calculate the median value.
If values are even: N + 1 / 2
If values are odd than: N / 2.
Formula: Median = [N+1] / 2
= [ 10 + 1 ] / 2
= 5.5th observation is 85 & 95.
` = 90.5
4

Mode: It is the most repeated value from the available data series called mode. If there is
more than one number which is repeated then two values will be consider as mode.
From the above mention data serious 92 is the most repeated value and mode of the entire
observation.
Range: In statistical, difference between the maximum or minimum value of the
observation called range of the series (Kahan and Peters, 2017). Further calculation mention
below:
Formula: Range = Maximum Value – Minimum Value
= 95 – 85
= 10
Standard deviation: It is the measurement of the value of dispersion from the set of
various data. Lower standard deviation is close to the mean value and the other hand, high value
indicate that value having wide range. Further calculation of standard deviation is mention
below:
Days
Humidity
(x) x- mean (x-m)2
1 89 -1 1
2 91 1 1
3 87 -3 9
4 92 2 4
5 85 -5 25
6 95 5 25
7 92 2 4
8 92 2 4
9 90 0 0
10 87 -3 9
82
Formula: Variance = [ ∑ (x–mean)2/N ]
5
Paraphrase This Document
Need a fresh take? Get an instant paraphrase of this document with our AI Paraphraser

= 82 / 10
= 8.2
Formula: Standard deviation = √Variance
= √8.2
= 2.86
4. Apply linear forecasting method
With the help of liner forecasting model, people able to forecast the future humidity level
where X is consider as Days and Y for the Humidity level (Landtblom, 2018). Calculations are
as follows:
Step 1: Table formulation
Days (X)
Humidity
(Y) X2 XY
1 89 1 89
2 91 4 182
3 87 9 261
4 92 16 368
5 85 25 425
6 95 36 570
7 92 49 644
8 92 64 736
9 90 81 810
10 87 100 870
∑x= 55 ∑y= 900 ∑X2= 385 ∑XY= 4955
Step 2: Calculation of the value of M:
Formula:
M = [N ∑XY - ∑x ∑y]/ [N ∑X2 - (∑x)2]
6

= [ 10 * 4955 – (55 * 900) ] / [10*385- (55)2 ]
= [49550 – 49500] / [3850 – 3025]
= 50 / 825
= 0.06
Step 3: Calculation of value of C:
Formula: C = ∑y - m ∑x / N
= (900 – 0.06 * 55) / 10)
= 896.7 / 10
= 89.67
Step 4: Humidity on 15th day:
Formula: Y = mx + c
= 0.06 * 15 + 89.67
= 0.9+89.67
= 90.57
The level of humidity on 15th day will be 90.57.
Step 5: Humidity on 20th Day:
Formula: Y = mx + c
= 0.06 * 20 + 89.67
= 1.2 + 89.67
= 90.87
The humidity level on 20th day will be 90.87.
CONCLUSION
From the above discussion it has been concluded that, with the help of data analysis
business able to collect information, analyse, evaluate and measure for the further functioning.
At the time of analysing data, these factors need to be consider such as mean, median, mode,
standard deviation etc.
7

REFERENCES
Books and Journals:
Gunst, R. F., 2018. Regression analysis and its application: a data-oriented approach.
Routledge.
Johnston, M. P., 2017. Secondary data analysis: A method of which the time has
come. Qualitative and quantitative methods in libraries. 3(3). pp.619-626.
Kahan, D. M. and Peters, E., 2017. Rumors of the'Nonreplication'of the'Motivated Numeracy
Effect'Are Greatly Exaggerated.
Landtblom, K. K., 2018. Prospective Teachers’ Conceptions of the Concepts Mean, Median and
Mode. In Students' and Teachers' Values, Attitudes, Feelings and Beliefs in
Mathematics Classrooms (pp. 43-52). Springer, Cham.
Online
Statistical data of Humidity. 2020. [Online]. Available through:
<https://www.timeanddate.com/weather/uk/london/historicc>
8
1 out of 10
Related Documents

Your All-in-One AI-Powered Toolkit for Academic Success.
+13062052269
info@desklib.com
Available 24*7 on WhatsApp / Email
Unlock your academic potential
© 2024 | Zucol Services PVT LTD | All rights reserved.