Reservoir Geomechanics: Modelling & Hydraulic Fracture Analysis
VerifiedAdded on 2023/06/13
|69
|14122
|83
Report
AI Summary
This report focuses on the geomechanical parameters essential for simulating hydraulic reservoirs, highlighting the limitations of using scalar quantities for rock mechanics representation. It addresses the common assumptions made in traditional methodologies, such as constant overall stress and simplified laboratory loading conditions. The study uses Petrel and Visage software to create a model for monitoring geomechanical properties, enabling informed decision-making. Key achievements include analyzing unconventional reservoir geomechanical properties and planning effective hydraulic fracturing for field development. The modelling process involves simulating stress and updating rock compressibility and porosity, offering a more accurate representation of reservoir behavior. The report also reviews petroleum reserves, production, and consumption trends, emphasizing the importance of consistent methodologies in data analysis. Ultimately, the study provides insights into optimizing reservoir simulation and hydraulic fracturing techniques.

Geomechanics 1
HYDRAULIC RESERVOIR GEOMECHANICS
Student’s Name
Institution
City
Date
HYDRAULIC RESERVOIR GEOMECHANICS
Student’s Name
Institution
City
Date
Paraphrase This Document
Need a fresh take? Get an instant paraphrase of this document with our AI Paraphraser
Geomechanics 2
Abstract
This only focuses on the rock mechanics parameter in the whole simulation of the reservoir
which is a scalar quantity making it unfit for proper representation of the actual mechanics of
rocks of the reservoir in the study. Numerous assumptions are made in this kind of methodology.
The overall stress is taken to be constant with the conditions of loading inside the reservoir
required to be similar as proposed in the laboratory that has simple loading applied in a core
sample. One major problem is the process of running the simulation of the reservoir that is able
to update the compressibility of the rock as well as its porosity after every step; after the analysis
of stress program calculating the field displacement, strain and stress parameters. This paper
comes into use Petrel and Visage software to produce a model that could be monitored noting the
geomechanical properties of the modelled reservoir. These properties could then be analyzed and
appropriate decisions, as well as actions, are made.
Keywords: Geomechanical properties, Petrel software, Visage software, hydraulic fracture.
Geomechanics 3
Table of Contents
A. Introduction.........................................................................................................................................4
B. Literature review.................................................................................................................................7
C. Project Achievements........................................................................................................................20
D. Modelling Process.............................................................................................................................21
E. Simulation Case.................................................................................................................................35
F. Results and Discussion.......................................................................................................................42
G. Conclusion and Recommendation.....................................................................................................59
H. References.........................................................................................................................................62
⊘ This is a preview!⊘
Do you want full access?
Subscribe today to unlock all pages.
Trusted by 1+ million students worldwide

Geomechanics 4
A. Project Achievements
Project Achievements
The project had the following achievements;
1. Produce an analysis of the unconventional reservoir estimation of the geomechanical
properties.
2. Produce an effective and efficient hydraulic fracturing for the planning of field
development.
Learning Achievements
The following are the personal achievements that are to be learnt from this project;
1. Designing and modelling with the use of Petrel and Visage software.
2. Coupling simulations between Petrel and Visage.
Paraphrase This Document
Need a fresh take? Get an instant paraphrase of this document with our AI Paraphraser
Geomechanics 5
B. Introduction
The first appearance of geomechanics was in the gas and oil industry at the point when engineers
were planning the performance of successful hydraulic fracturing. The process of hydraulic
fracturing occurs when injected fluid with lots of pressure creates ample fore that would exceed
the surrounding rock tensile stress in the wellbore. After such an occurrence, the rock would fail
and this would lead to fractures that travel all-round the rock area with minimal resistance.
Hence, the simulation engineers had to make a full understanding of the stress formation. These
engineers had to make an estimation of required pressure that can fracture the rock with a
predetermined direction of the fracture (Tearpock & Bischke, 2003).
The current reservoir simulations try simulating these geomechanical effects with only the use of
rock compressibility just to make changes in the rock porosity. This only focuses on the rock
mechanics parameter in the whole simulation of the reservoir. This only being a scalar quantity,
makes it unfit for proper representation of the actual mechanics of rocks of the reservoir in the
study. Numerous assumptions are made in this kind of methodology. The overall stress is taken
to be constant with the conditions of loading inside the reservoir required to be similar as
proposed in the laboratory that has simple loading applied in a core sample (Lorenz & Cooper,
2017). The laboratory loading is has done to obtain calculated compressibility of the reservoir
rock. Basically, the problem is solved by the creation of the problem forming a 1D problem
hence the rock only undergoes vertical deformation with each column of the grid-blocks would
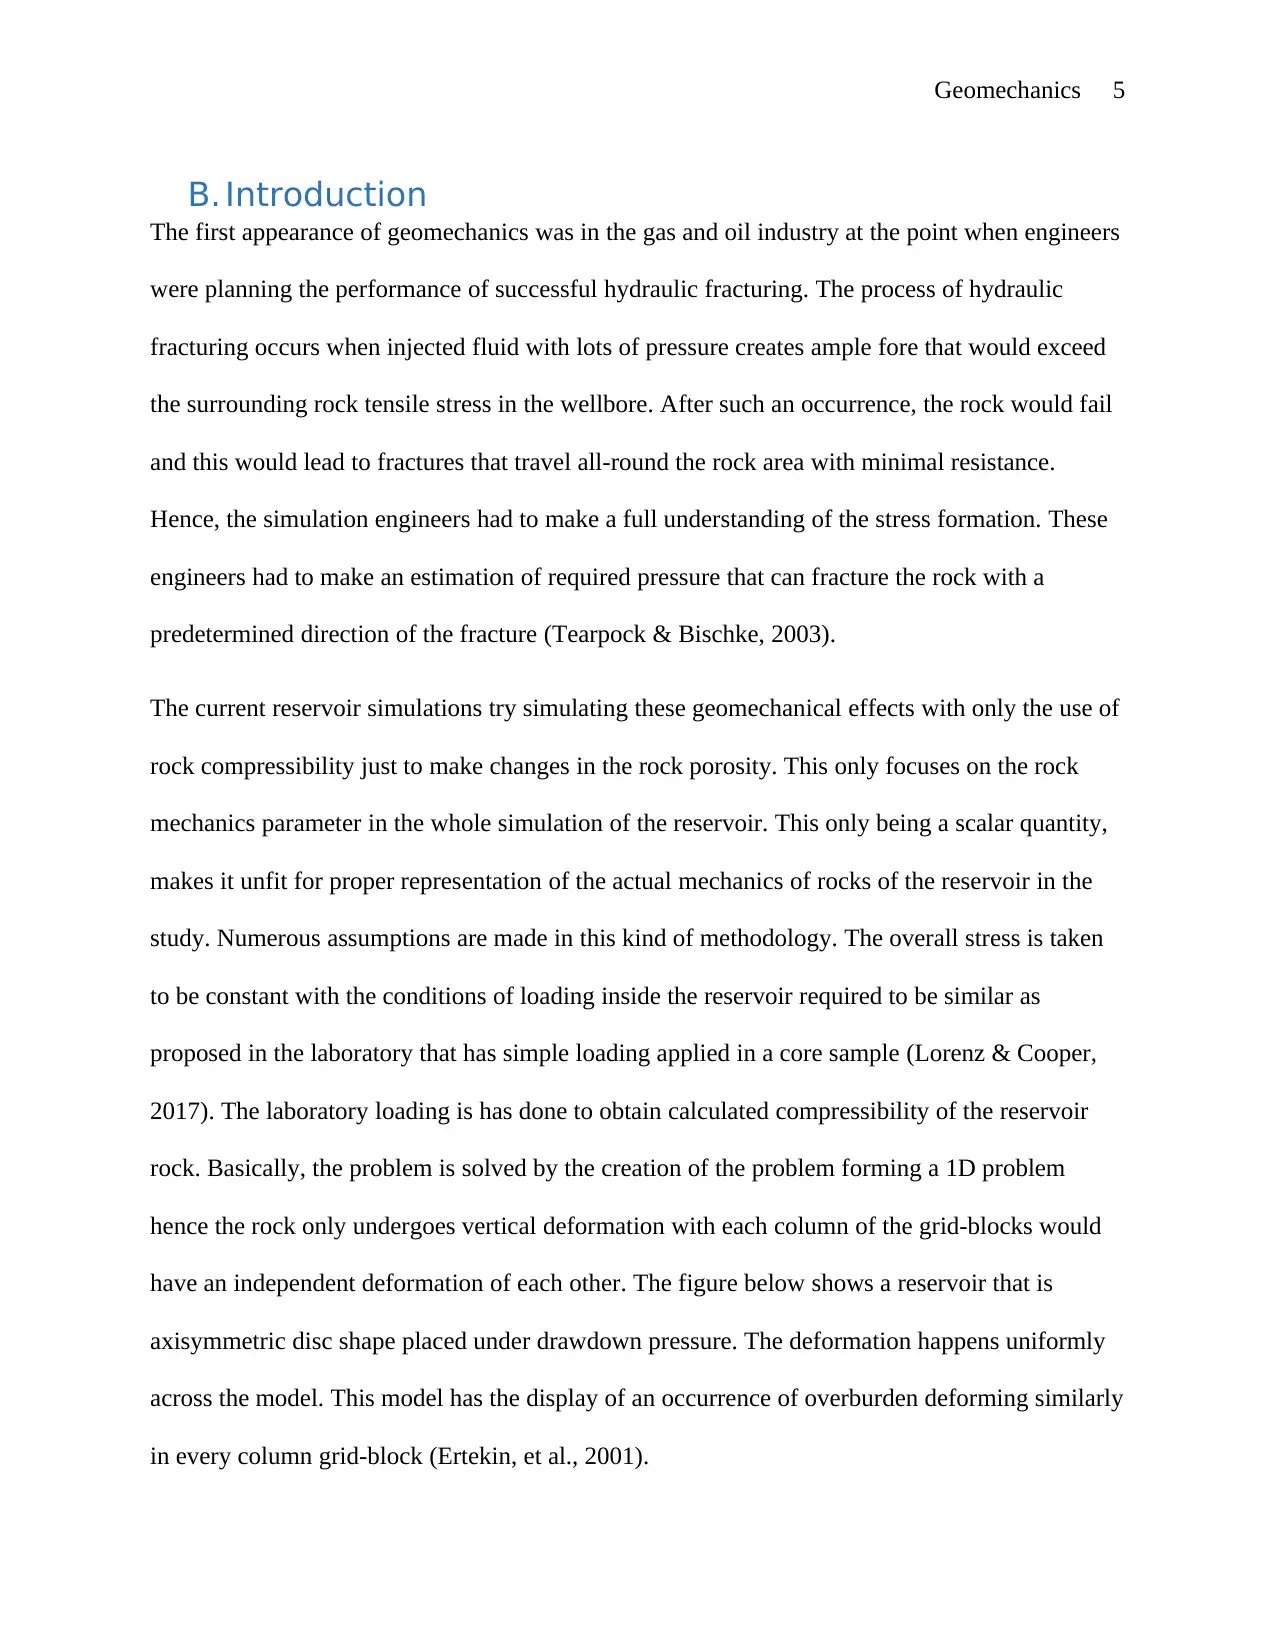
have an independent deformation of each other. The figure below shows a reservoir that is
axisymmetric disc shape placed under drawdown pressure. The deformation happens uniformly
across the model. This model has the display of an occurrence of overburden deforming similarly
in every column grid-block (Ertekin, et al., 2001).
B. Introduction
The first appearance of geomechanics was in the gas and oil industry at the point when engineers
were planning the performance of successful hydraulic fracturing. The process of hydraulic
fracturing occurs when injected fluid with lots of pressure creates ample fore that would exceed
the surrounding rock tensile stress in the wellbore. After such an occurrence, the rock would fail
and this would lead to fractures that travel all-round the rock area with minimal resistance.
Hence, the simulation engineers had to make a full understanding of the stress formation. These
engineers had to make an estimation of required pressure that can fracture the rock with a
predetermined direction of the fracture (Tearpock & Bischke, 2003).
The current reservoir simulations try simulating these geomechanical effects with only the use of
rock compressibility just to make changes in the rock porosity. This only focuses on the rock
mechanics parameter in the whole simulation of the reservoir. This only being a scalar quantity,
makes it unfit for proper representation of the actual mechanics of rocks of the reservoir in the
study. Numerous assumptions are made in this kind of methodology. The overall stress is taken
to be constant with the conditions of loading inside the reservoir required to be similar as
proposed in the laboratory that has simple loading applied in a core sample (Lorenz & Cooper,
2017). The laboratory loading is has done to obtain calculated compressibility of the reservoir
rock. Basically, the problem is solved by the creation of the problem forming a 1D problem
hence the rock only undergoes vertical deformation with each column of the grid-blocks would
have an independent deformation of each other. The figure below shows a reservoir that is
axisymmetric disc shape placed under drawdown pressure. The deformation happens uniformly
across the model. This model has the display of an occurrence of overburden deforming similarly
in every column grid-block (Ertekin, et al., 2001).
Geomechanics 6
(Kabashkin, et al., 2018)
A uniaxial test in a reservoir can be performed to obtain the rock geomechanical properties the
test simply consists of the application of load that is vertical to the core sample for the purpose of
monitoring the rock deformation as well as the instance of rock failure (Luo & Agraniotis, 2017).
The results of the test in this experiment can produce uniaxial compressive reservoir strength,
Poison’s ratio and Young Modulus. The surrounding rock on the core sample would not be
considered in making the rock compressibility that was obtained by calculation in the lab through
rough estimation of the actual rock compressibility (Li, 2017).
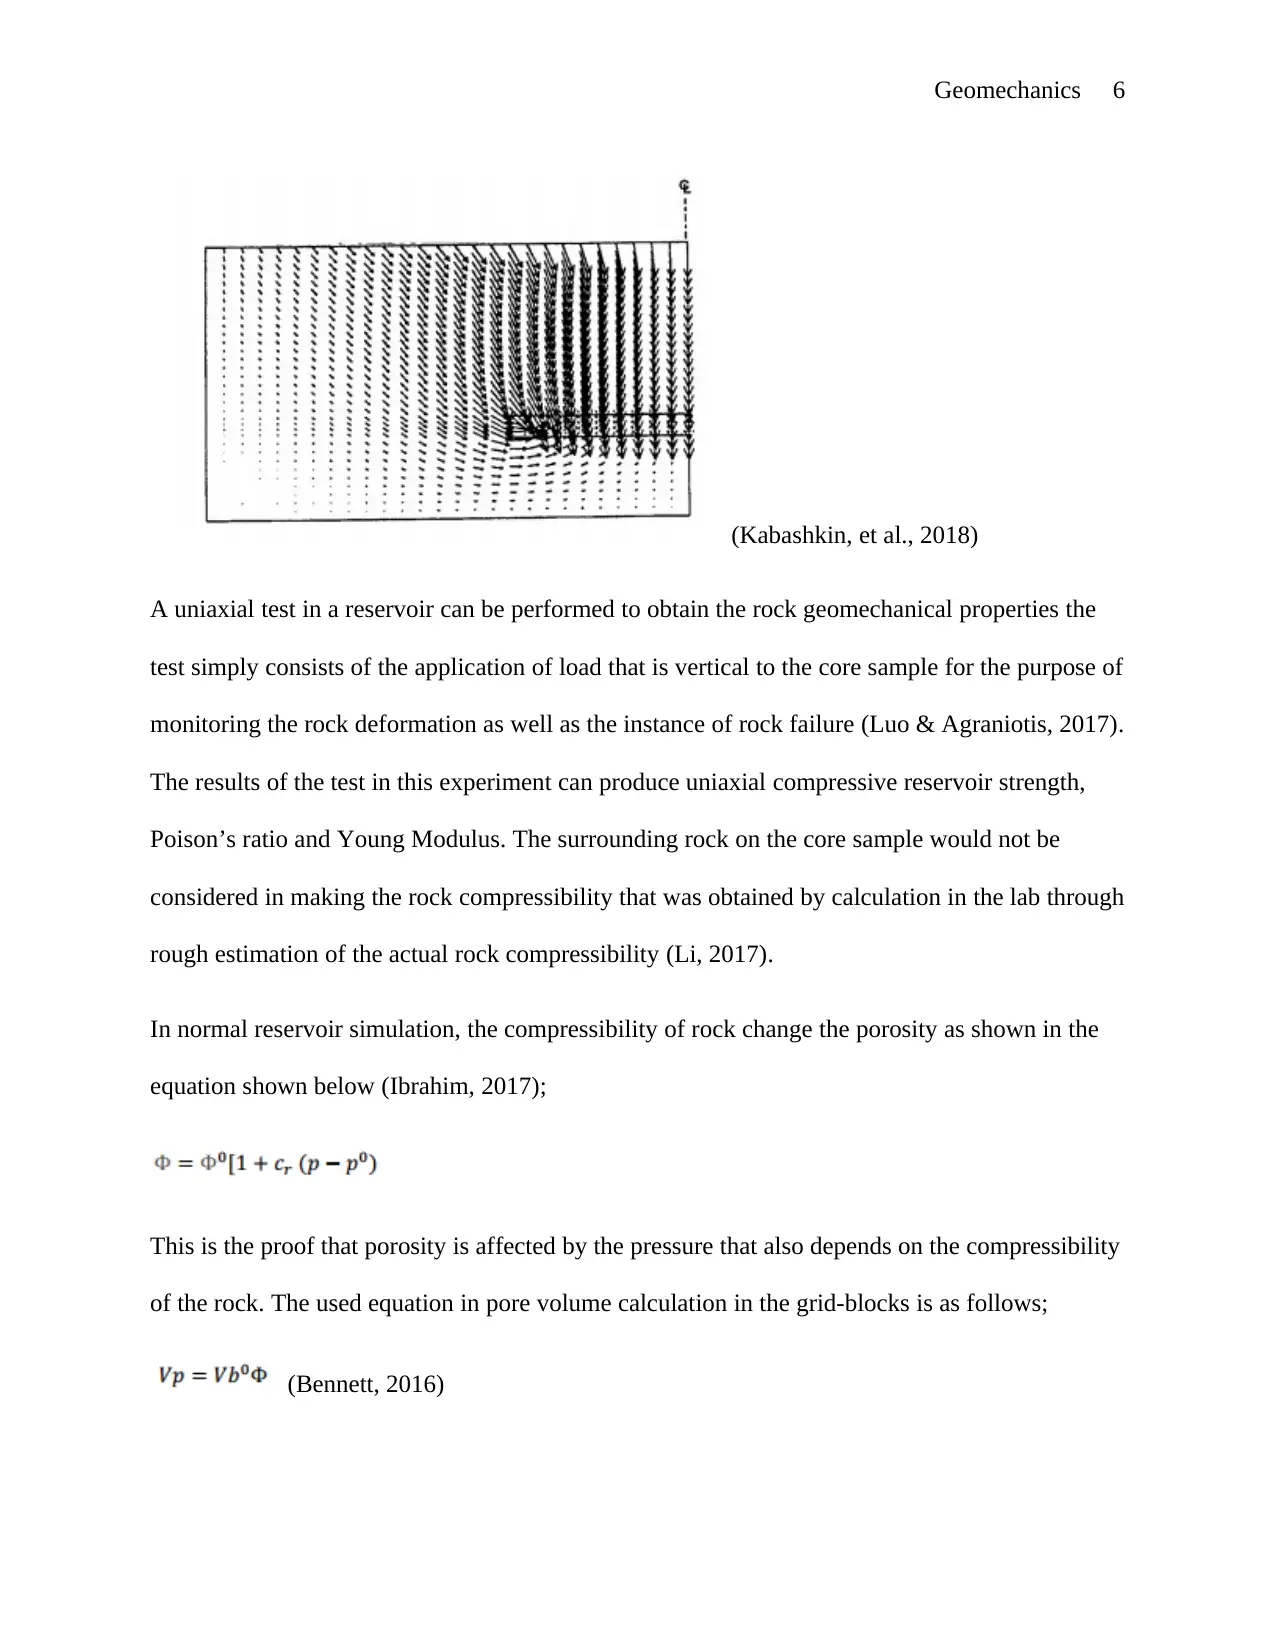
In normal reservoir simulation, the compressibility of rock change the porosity as shown in the
equation shown below (Ibrahim, 2017);
This is the proof that porosity is affected by the pressure that also depends on the compressibility
of the rock. The used equation in pore volume calculation in the grid-blocks is as follows;
(Bennett, 2016)
(Kabashkin, et al., 2018)
A uniaxial test in a reservoir can be performed to obtain the rock geomechanical properties the
test simply consists of the application of load that is vertical to the core sample for the purpose of
monitoring the rock deformation as well as the instance of rock failure (Luo & Agraniotis, 2017).
The results of the test in this experiment can produce uniaxial compressive reservoir strength,
Poison’s ratio and Young Modulus. The surrounding rock on the core sample would not be
considered in making the rock compressibility that was obtained by calculation in the lab through
rough estimation of the actual rock compressibility (Li, 2017).
In normal reservoir simulation, the compressibility of rock change the porosity as shown in the
equation shown below (Ibrahim, 2017);
This is the proof that porosity is affected by the pressure that also depends on the compressibility
of the rock. The used equation in pore volume calculation in the grid-blocks is as follows;
(Bennett, 2016)
⊘ This is a preview!⊘
Do you want full access?
Subscribe today to unlock all pages.
Trusted by 1+ million students worldwide
Geomechanics 7
The equation is shown previously was incorrect as the pore volume has an actual deformation
that comes from applied stress, variations in pore pressure as well as changes in temperature to
some extension. The deformation occurs due to Terzaghi’s Principle of the stress that is
effective. The true equation has to look as shown below (Makhlouf & Aliofkhazraei, 2015);
The true value of porosity is also obtained as shown below;
(Hodge, 2017)
At this point, the porosity, as well as the pore volume, have been made stress functions. The
formed relationship is therefore represented as shown below;
As most of the models of reservoirs miss allowing pore volume change in the process of running
simulation, pseudo porosity is the created to reevaluate the right values as shown below;
(Shurtleff & Aoyagi, 2017)
The main problem is the process of running the simulation of the reservoir that is able to update
the compressibility of the rock as well as its porosity after every step; after the analysis of stress
program calculating the field displacement, strain and stress parameters. For this to be
performed, one needs a software platform that has two software engines that are able to run the
simulation of the reservoir. As well as the analysis of stress simultaneously. However, the
change in porosity should be as a result of the new rock compressibility and stresses obtained by
the stress analyzer (Zheng, 2017).
Paraphrase This Document
Need a fresh take? Get an instant paraphrase of this document with our AI Paraphraser
Geomechanics 8
This paper, therefore, has its focus on the newly developed coupling software called reservoir
geomechanics a module in Petrel platform. The platform has ECLIPSE as the reservoir simulator
required for analyzing stress with a coupling program that can link the two software together.
These two main reasons were the purpose of development of The Reservoir Geomechanics
module that is a Petrel software coupling Eclipse and Visage (Speight, 2016).
C. Literature review
Petroleum is made up of natural gas and oil. Petroleum is formed by fossil fuel which develops
from naturally decayed animal and plant remains. The mixtures constitute of hundreds of various
molecules of hydrocarbon that may exist as crude oil or natural gas.
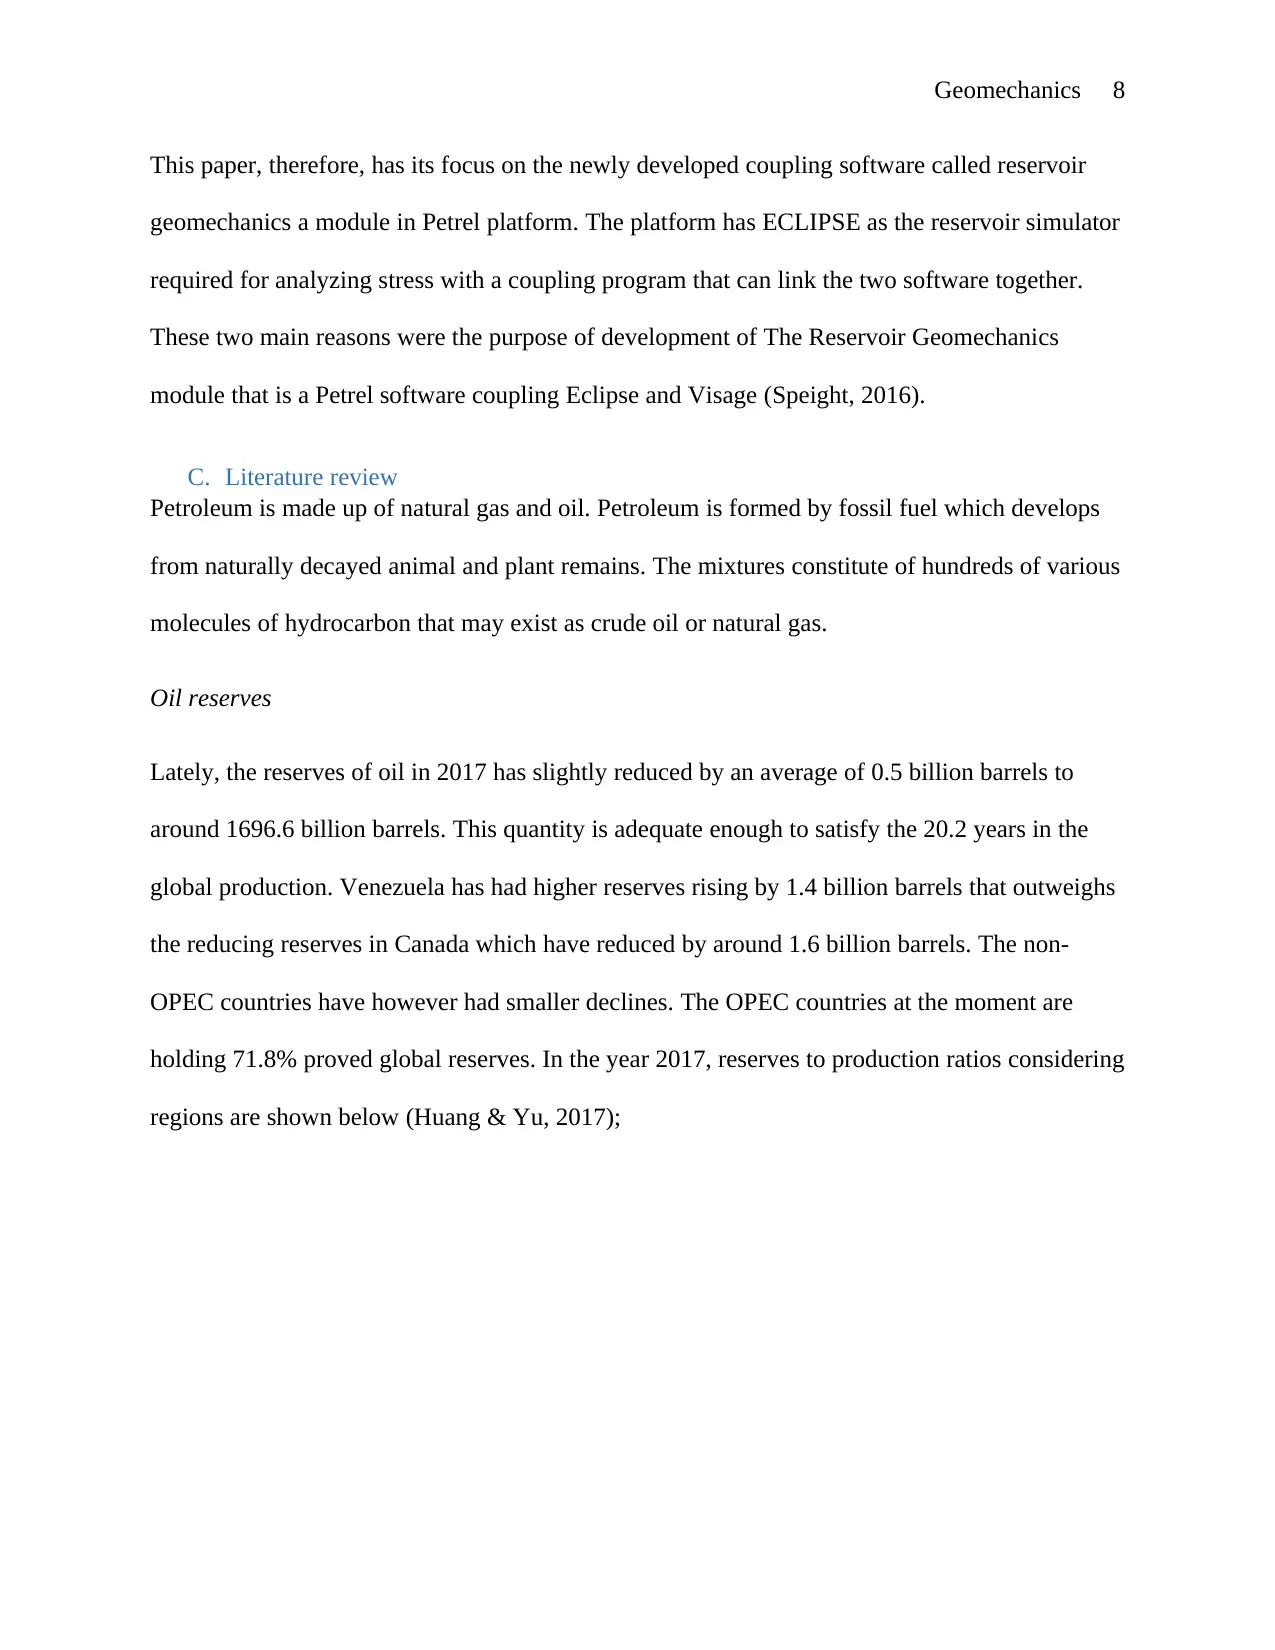
Oil reserves
Lately, the reserves of oil in 2017 has slightly reduced by an average of 0.5 billion barrels to
around 1696.6 billion barrels. This quantity is adequate enough to satisfy the 20.2 years in the
global production. Venezuela has had higher reserves rising by 1.4 billion barrels that outweighs
the reducing reserves in Canada which have reduced by around 1.6 billion barrels. The non-
OPEC countries have however had smaller declines. The OPEC countries at the moment are
holding 71.8% proved global reserves. In the year 2017, reserves to production ratios considering
regions are shown below (Huang & Yu, 2017);
This paper, therefore, has its focus on the newly developed coupling software called reservoir
geomechanics a module in Petrel platform. The platform has ECLIPSE as the reservoir simulator
required for analyzing stress with a coupling program that can link the two software together.
These two main reasons were the purpose of development of The Reservoir Geomechanics
module that is a Petrel software coupling Eclipse and Visage (Speight, 2016).
C. Literature review
Petroleum is made up of natural gas and oil. Petroleum is formed by fossil fuel which develops
from naturally decayed animal and plant remains. The mixtures constitute of hundreds of various
molecules of hydrocarbon that may exist as crude oil or natural gas.
Oil reserves
Lately, the reserves of oil in 2017 has slightly reduced by an average of 0.5 billion barrels to
around 1696.6 billion barrels. This quantity is adequate enough to satisfy the 20.2 years in the
global production. Venezuela has had higher reserves rising by 1.4 billion barrels that outweighs
the reducing reserves in Canada which have reduced by around 1.6 billion barrels. The non-
OPEC countries have however had smaller declines. The OPEC countries at the moment are
holding 71.8% proved global reserves. In the year 2017, reserves to production ratios considering
regions are shown below (Huang & Yu, 2017);
Geomechanics 9
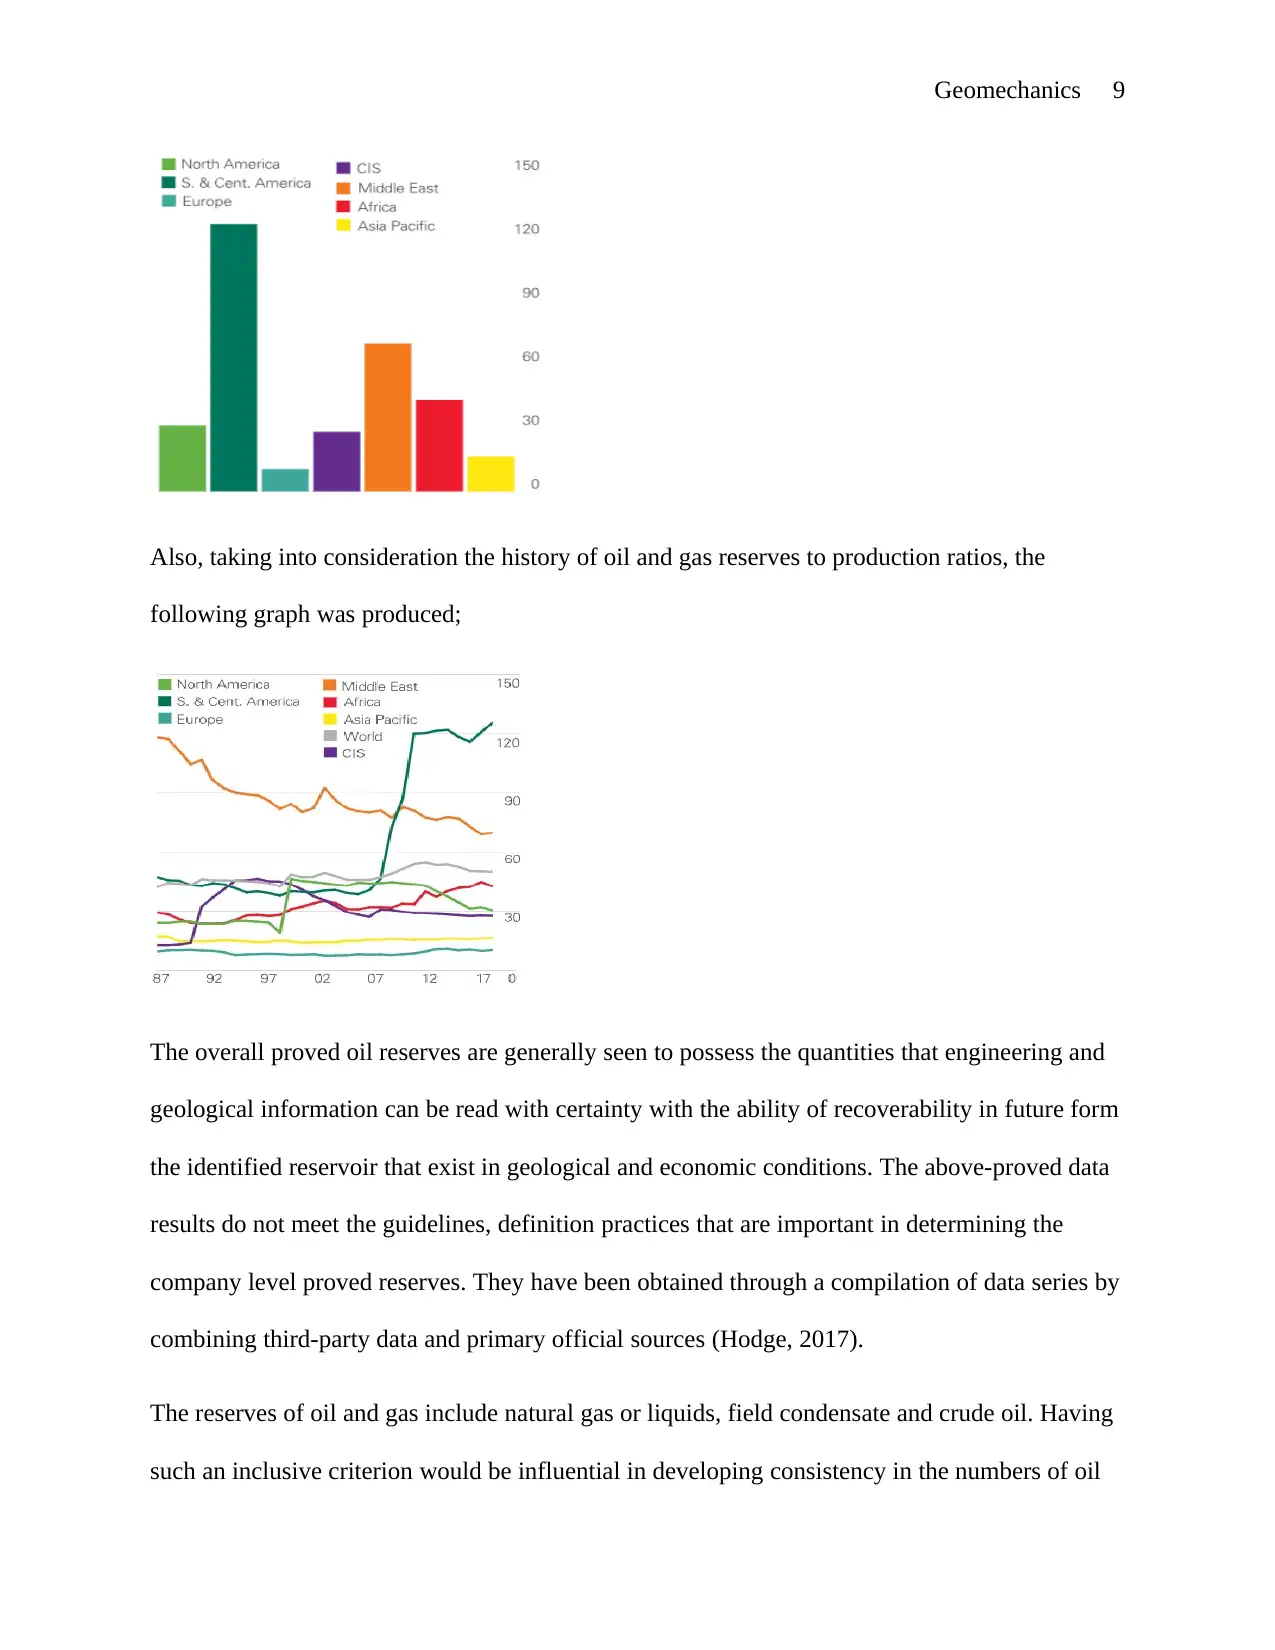
Also, taking into consideration the history of oil and gas reserves to production ratios, the
following graph was produced;
The overall proved oil reserves are generally seen to possess the quantities that engineering and
geological information can be read with certainty with the ability of recoverability in future form
the identified reservoir that exist in geological and economic conditions. The above-proved data
results do not meet the guidelines, definition practices that are important in determining the
company level proved reserves. They have been obtained through a compilation of data series by
combining third-party data and primary official sources (Hodge, 2017).
The reserves of oil and gas include natural gas or liquids, field condensate and crude oil. Having
such an inclusive criterion would be influential in developing consistency in the numbers of oil
⊘ This is a preview!⊘
Do you want full access?
Subscribe today to unlock all pages.
Trusted by 1+ million students worldwide
Geomechanics 10
production that has the categories of the oil. Fuels with liquid hydrocarbon from sources of non-
hydrocarbon which include ethanol obtained from corn as well as synthetic oil or sugar got from
natural gas which is not part of production or reserves series. Though there is an effort to coming
up with reserve consistent series with the use of common definition, the reality is that various
countries make use of diverse methodologies with the data varying the reliability levels.
Therefore, there has to be cautious when attempting an accurate comparison between the time
series analyses or nations (Herwanger & Koutsabeloulis, 2011).
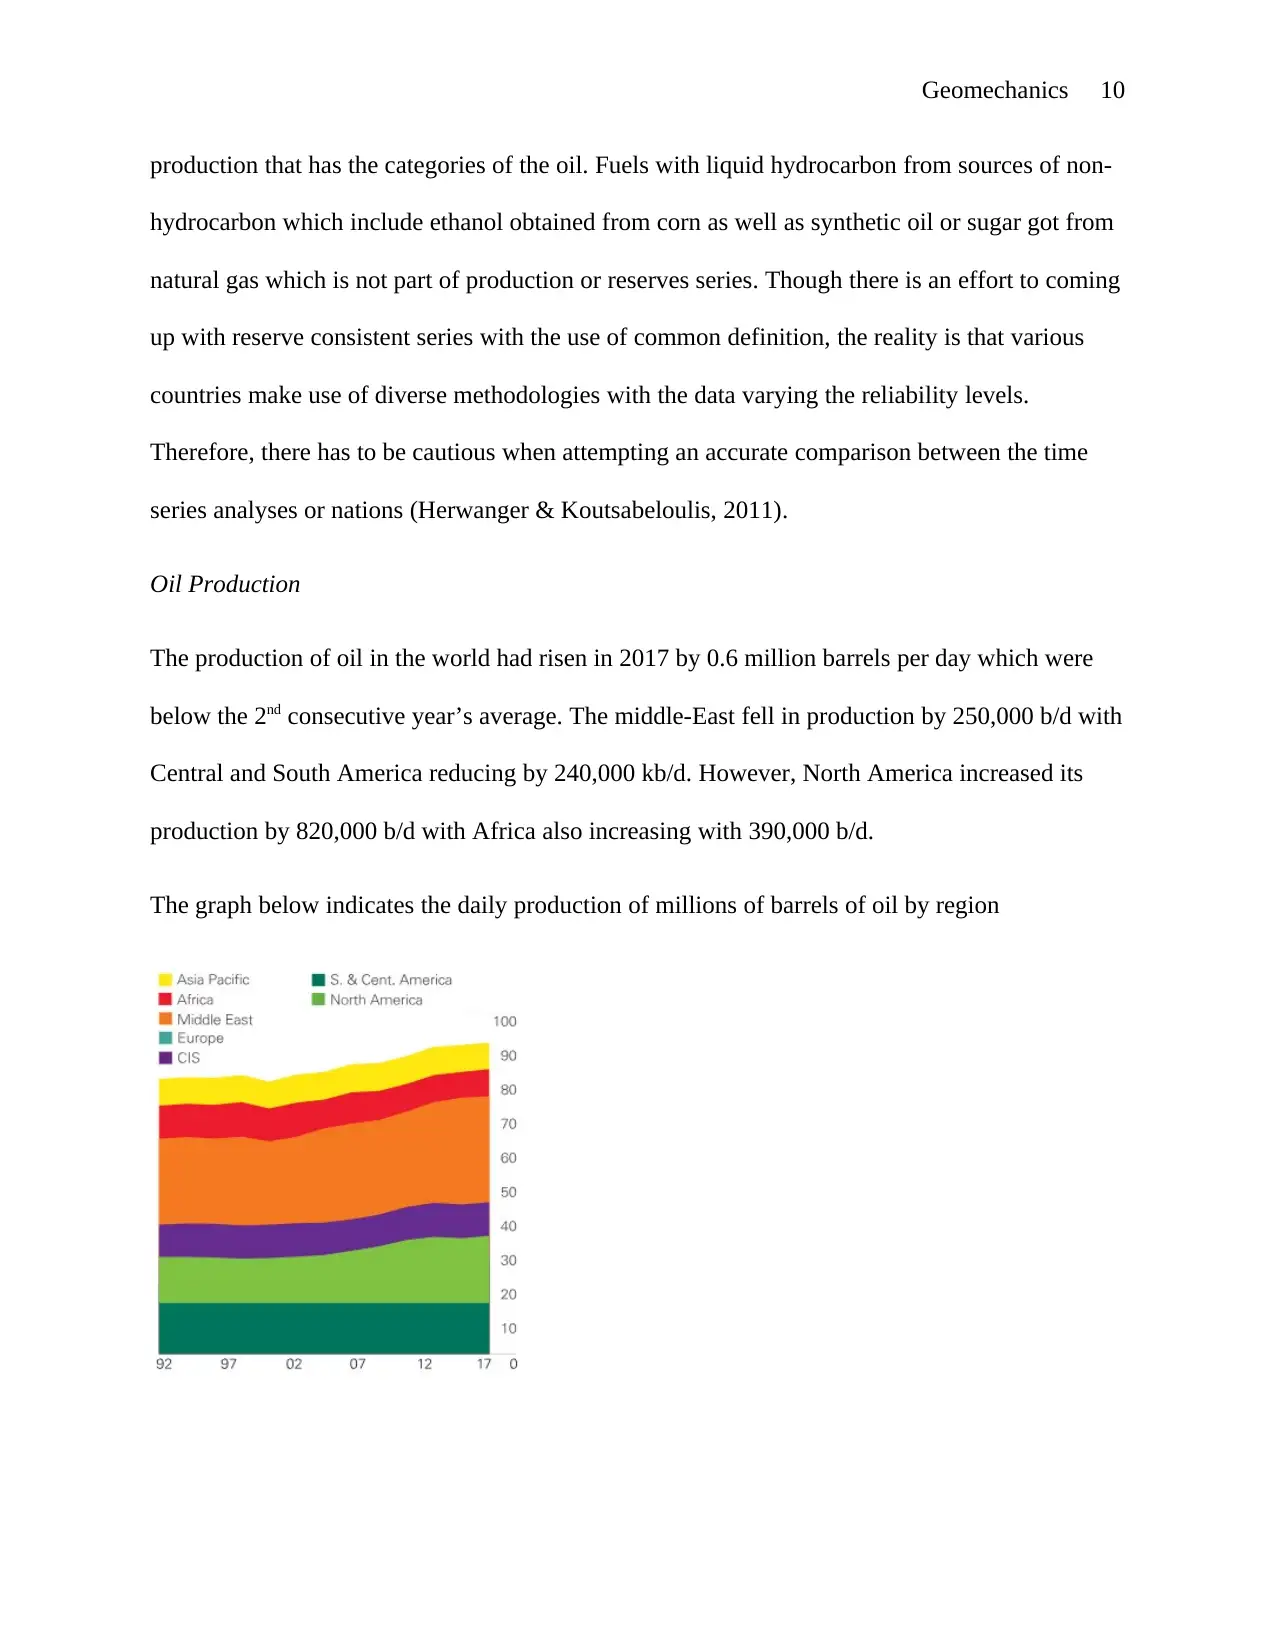
Oil Production
The production of oil in the world had risen in 2017 by 0.6 million barrels per day which were
below the 2nd consecutive year’s average. The middle-East fell in production by 250,000 b/d with
Central and South America reducing by 240,000 kb/d. However, North America increased its
production by 820,000 b/d with Africa also increasing with 390,000 b/d.
The graph below indicates the daily production of millions of barrels of oil by region
production that has the categories of the oil. Fuels with liquid hydrocarbon from sources of non-
hydrocarbon which include ethanol obtained from corn as well as synthetic oil or sugar got from
natural gas which is not part of production or reserves series. Though there is an effort to coming
up with reserve consistent series with the use of common definition, the reality is that various
countries make use of diverse methodologies with the data varying the reliability levels.
Therefore, there has to be cautious when attempting an accurate comparison between the time
series analyses or nations (Herwanger & Koutsabeloulis, 2011).
Oil Production
The production of oil in the world had risen in 2017 by 0.6 million barrels per day which were
below the 2nd consecutive year’s average. The middle-East fell in production by 250,000 b/d with
Central and South America reducing by 240,000 kb/d. However, North America increased its
production by 820,000 b/d with Africa also increasing with 390,000 b/d.
The graph below indicates the daily production of millions of barrels of oil by region
Paraphrase This Document
Need a fresh take? Get an instant paraphrase of this document with our AI Paraphraser
Geomechanics 11
The data on oil production includes tight oil, crude oil as well as oil sands. These produced data
also excludes liquid fuel obtained from other sources which include natural gas and coal
derivatives as well as biomass (Engineers, 1980).
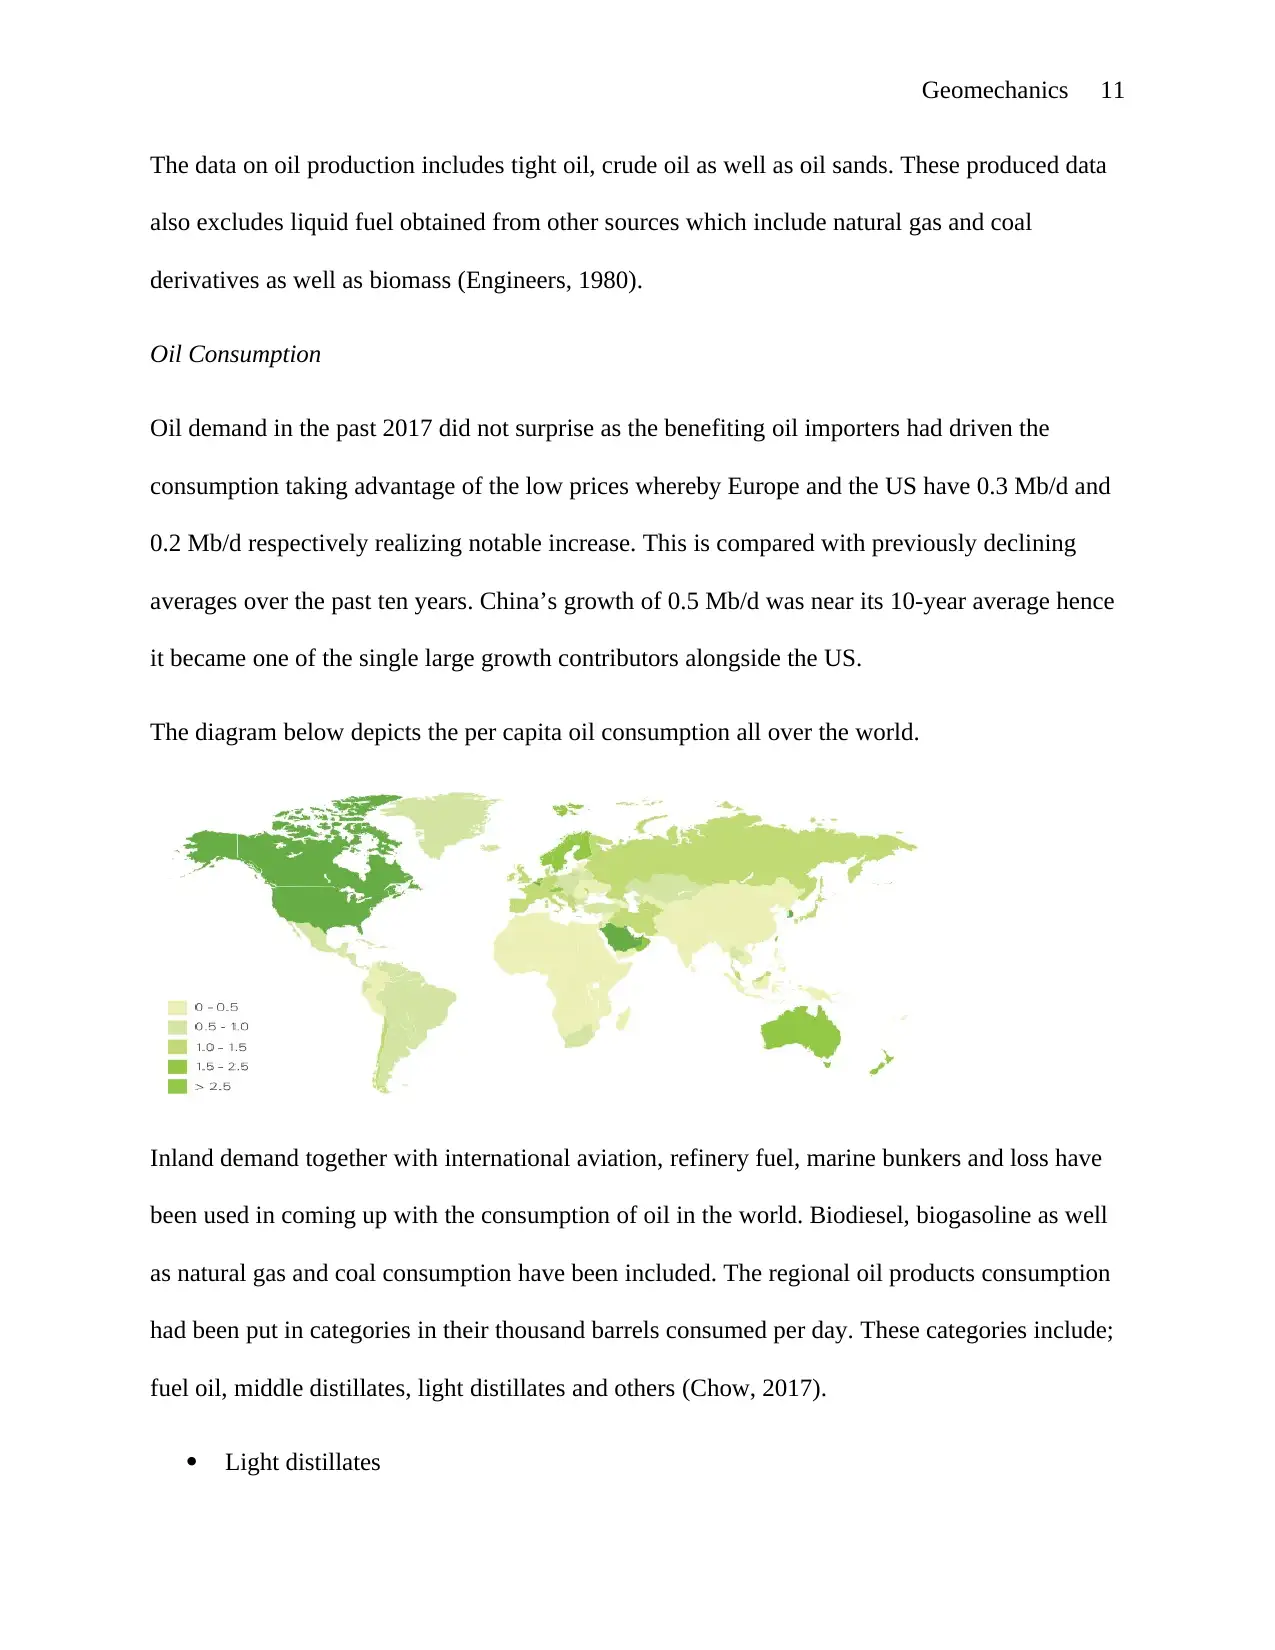
Oil Consumption
Oil demand in the past 2017 did not surprise as the benefiting oil importers had driven the
consumption taking advantage of the low prices whereby Europe and the US have 0.3 Mb/d and
0.2 Mb/d respectively realizing notable increase. This is compared with previously declining
averages over the past ten years. China’s growth of 0.5 Mb/d was near its 10-year average hence
it became one of the single large growth contributors alongside the US.
The diagram below depicts the per capita oil consumption all over the world.
Inland demand together with international aviation, refinery fuel, marine bunkers and loss have
been used in coming up with the consumption of oil in the world. Biodiesel, biogasoline as well
as natural gas and coal consumption have been included. The regional oil products consumption
had been put in categories in their thousand barrels consumed per day. These categories include;
fuel oil, middle distillates, light distillates and others (Chow, 2017).
Light distillates
The data on oil production includes tight oil, crude oil as well as oil sands. These produced data
also excludes liquid fuel obtained from other sources which include natural gas and coal
derivatives as well as biomass (Engineers, 1980).
Oil Consumption
Oil demand in the past 2017 did not surprise as the benefiting oil importers had driven the
consumption taking advantage of the low prices whereby Europe and the US have 0.3 Mb/d and
0.2 Mb/d respectively realizing notable increase. This is compared with previously declining
averages over the past ten years. China’s growth of 0.5 Mb/d was near its 10-year average hence
it became one of the single large growth contributors alongside the US.
The diagram below depicts the per capita oil consumption all over the world.
Inland demand together with international aviation, refinery fuel, marine bunkers and loss have
been used in coming up with the consumption of oil in the world. Biodiesel, biogasoline as well
as natural gas and coal consumption have been included. The regional oil products consumption
had been put in categories in their thousand barrels consumed per day. These categories include;
fuel oil, middle distillates, light distillates and others (Chow, 2017).
Light distillates
Geomechanics 12
These consist of motor gasoline, aviation gasoline and light distillate feedstock.
Fuel oil
These include crude oil being used directly as a source of fuel and marine bunkers.
Middle distillates
These type of distillates include heating kerosene, jet, diesel and gas oil bunkers.
Others
The others category includes liquefied petroleum gas, refinery gas, petroleum coke,
solvents, wax, bitumen, lubricants, refinery loss and fuel as well as the refined products.
Location of finding Petroleum
The natural gas and oil which is a source of power in the world can be found in pores between
the rock layers that are deep in the earth. There are offshore wells that have deeply drilled
tunnels thousands of distance from the water and goes more distances when the seabed is
reached. This oil will then be transported for refining and distillation into the base or fuel
chemical products (British Hydrodynamics Research Association, 1984).
There are many countries that mine petroleum with most of these nations producing both natural
gas and oil. Few produce natural gas. Numerous factors have also been affecting the production
of oil. These factors include; international or national politics, civil unrest, oil prices, quotas
adherence, technology development, new discoveries or technology applications.
Additionally, many more gas and oil reservoirs are still left for discovery and production. The
future discoveries are to be made in more remote areas and in deeper basins of the earth.
Technologies can then be advanced to determine the smaller reservoirs that are in existing gas
and oil areas.
⊘ This is a preview!⊘
Do you want full access?
Subscribe today to unlock all pages.
Trusted by 1+ million students worldwide
1 out of 69


Your All-in-One AI-Powered Toolkit for Academic Success.
+13062052269
info@desklib.com
Available 24*7 on WhatsApp / Email
![[object Object]](/_next/static/media/star-bottom.7253800d.svg)
Unlock your academic potential
Copyright © 2020–2026 A2Z Services. All Rights Reserved. Developed and managed by ZUCOL.