Hydrological Data Imputation Project: ENRP20001, Term-3, 2019
VerifiedAdded on 2023/03/31
|19
|4174
|90
Project
AI Summary
This project delves into the critical process of hydrological data imputation, essential for accurate environmental analysis and forecasting. The research examines the challenges posed by missing data in hydrological datasets, such as those related to the water cycle, and their impact on predictive models. The project investigates various imputation methods, including regression models and the use of tools like R language, to fill data gaps and enhance the reliability of statistical analyses. A detailed literature review explores existing techniques, and the project identifies the benefits for stakeholders and potential constraints. The project aims to improve the accuracy of hydrological predictions, helping to inform decisions related to water management, flood mitigation, and climate change impacts. The project also discusses the methodologies, tools, and techniques used in data collection and analysis, including the National Stormwater Calculator, EGRET, NOAA Weather and Climate Toolkit, and Global Precipitation Measurement Education Tools.

Hydrological data imputation
1
1
Paraphrase This Document
Need a fresh take? Get an instant paraphrase of this document with our AI Paraphraser
Table of Contents
Project Objectives......................................................................................................................4
Introduction and Background.....................................................................................................4
Literature review:.......................................................................................................................5
Research problem.......................................................................................................................9
Resources required...................................................................................................................10
Stakeholder and their benefit...................................................................................................11
Constraint.................................................................................................................................13
Conclusion................................................................................................................................13
References................................................................................................................................15
2
Abstract
In the following project a detailed research about the data imputation process in the
hydrological dataset is done. Various aspects related to the hydrological data imputation
process is discussed in the following research paper. The tools and technologies used in the
imputation process id provided in the content. A thorough discussion about the imputation
process and techniques is provided in the paper with proper details. The constraints and the
issues related to the process is also provided in the paper.
3
⊘ This is a preview!⊘
Do you want full access?
Subscribe today to unlock all pages.
Trusted by 1+ million students worldwide
Project Objectives
The objectives of this research are as follows:
To find the challenges in filling of missing data of the hydrological information
To find the effect of missing data in the hydrological predictions and their impacts
To find new predictive models for better efficiency of the filled in data in the context
of the information
To find the benefits of the imputationmethods and the benefits of the stakeholder.
Introduction and Background
Hydrological data is the data collected for properly monitoring the motion, distribution and
flow of the entire water cycle in the universe. Hydrological dataset is a collection of data that
describes the various aspects related to the water cycle and circulation(Remesan and Mathew,
2016). The hydrological is collected for analysing the entire process of the water circulation
in the universe and the effects of the process on the other natural processes of the universe as
well. The hydrological data helps to understand the entire process of the water flow including
the complete loop of water falling from the skies and flowing through different cycles and
going back to the skies through evaporating process. The hydrological data can be thus
helpful to do the necessary forecasts about rain, other natural predictions, and understanding
the water cycle better. Hydrological datasets are used for analysing the statistical factors
related to the water cycle and predicting the possible water circulations in the
future(Hanasakiet al., 2018).
It is observed that there is always some missing data in the process of collecting these
hydrological data. These missing data could cause difficulties in the proper analysis of the
4
Paraphrase This Document
Need a fresh take? Get an instant paraphrase of this document with our AI Paraphraser
water circulation and other related studies with the water circulation and can hamper the
process of delivering the right future predictions and forecasting about the process.Thus there
is a need of proper imputation of the missing required data in the hydrological data for
successfully produce proper results of the process.
Data imputation helps the statistical analyst to develop a better and right statistical model
which can produce the right results of the process of the analysis. There are various types of
software available such as R and Python that can help fixing these missing data in the
hydrological datasets. The imputation process helps to increase the accuracy of the results of
these statistical analyses. Thus it is a very important thing to do proper imputation to the
hydrological data in order to deliver proper results of the analysis.
Data imputation can be quite complicated and tedious in its operation. But it is quite
important for the analysts to do a proper imputation of the hydrological data in the dataset to
fill the gaps in the information in order to improve and rectify the problems.Thus it is very
important for the analysts take proper measures using different software, tools and techniques
to do a proper imputation of the hydrological data. The imputation of the hydrological data
should be done very responsibility so that there could be no chance of errorsin the process
which can hinder the process of right and proper analysis of the water circulation. It is
important for the analysts to impute proper and appropriate data required for the proper
analysis of the process. An improper data imputation can cause serious problems in the
analysis process and thus can fail to provide the right future predictions of the water
circulation and forecasting about the important natural aspects related to it(Gao et al., 2018).
Literature review:
Imputation is performed more formally whenever more than a trivial function of data is
amiss. It is wise to understand missing data imputation and for an easier imputation to be
5
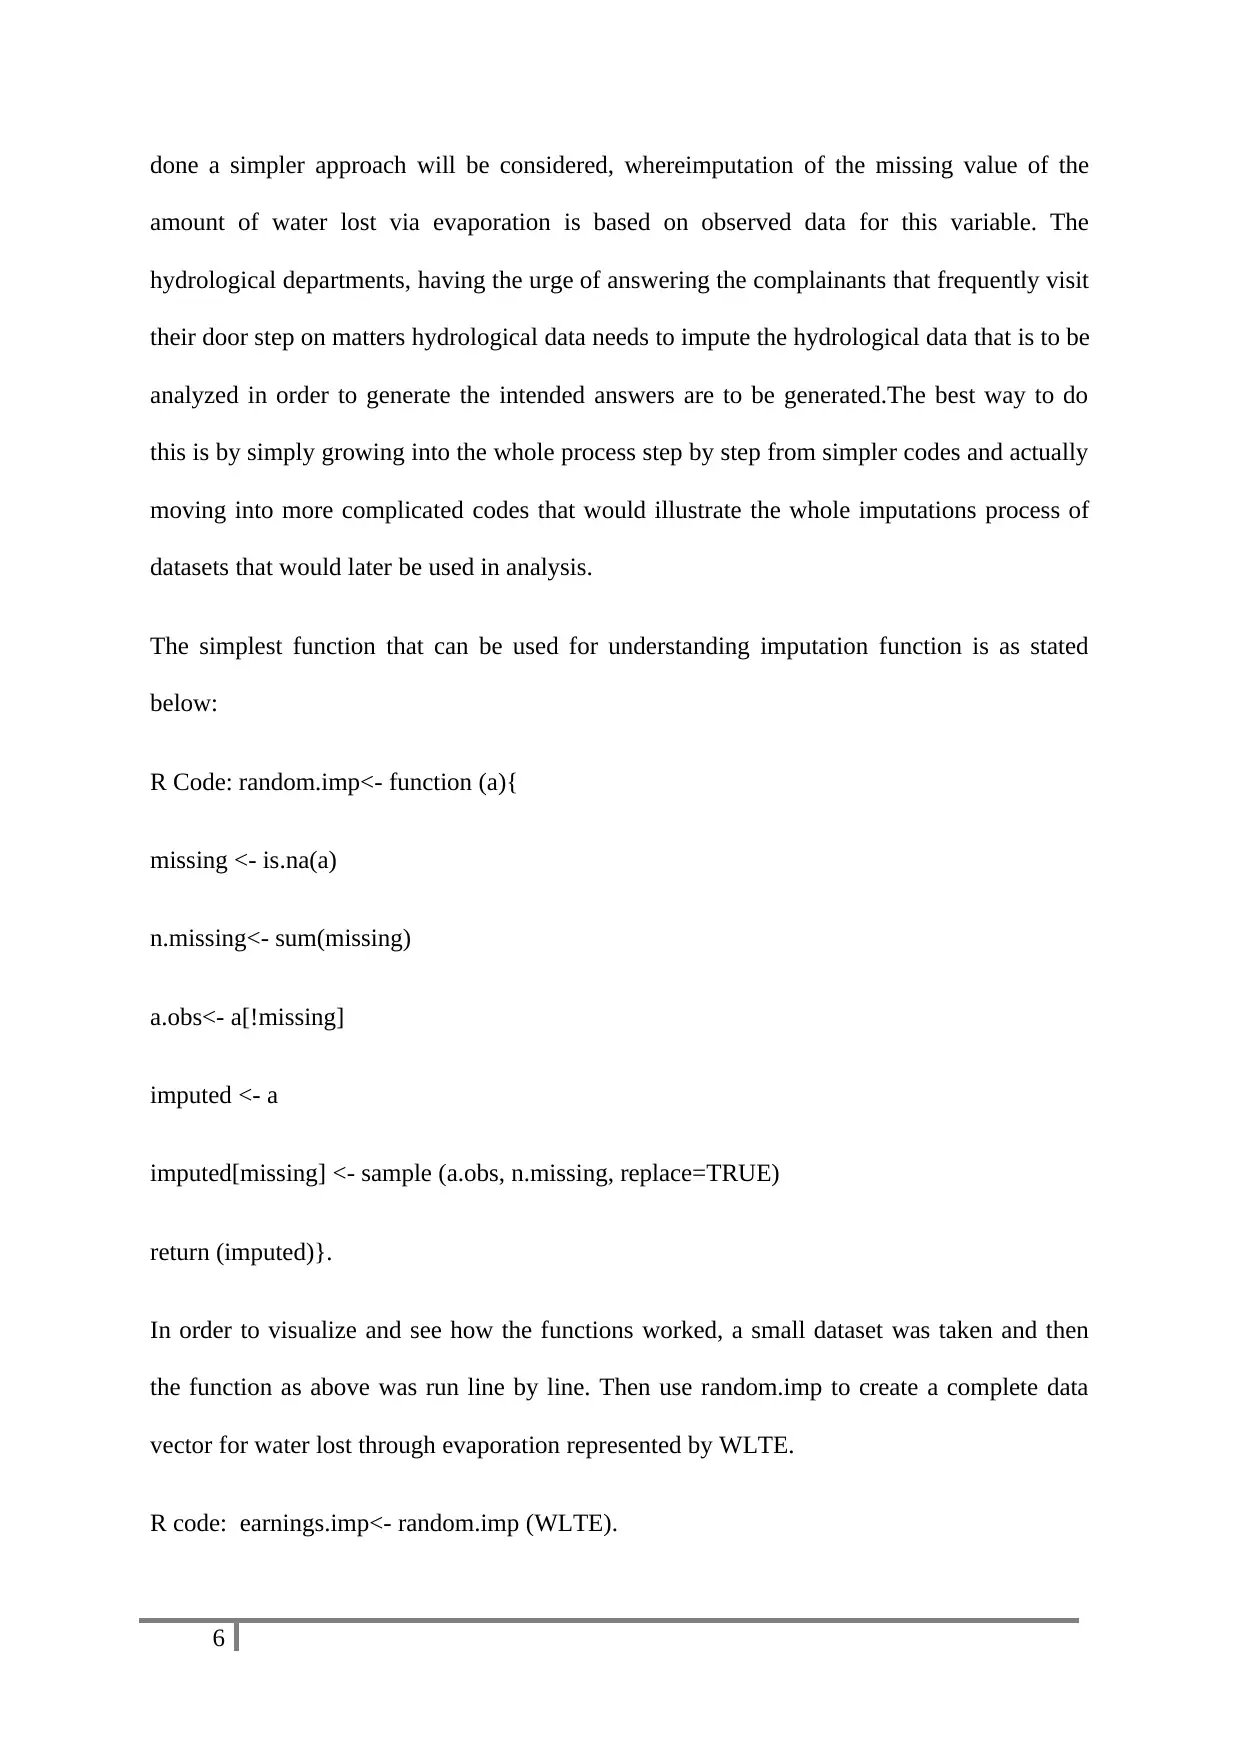
done a simpler approach will be considered, whereimputation of the missing value of the
amount of water lost via evaporation is based on observed data for this variable. The
hydrological departments, having the urge of answering the complainants that frequently visit
their door step on matters hydrological data needs to impute the hydrological data that is to be
analyzed in order to generate the intended answers are to be generated.The best way to do
this is by simply growing into the whole process step by step from simpler codes and actually
moving into more complicated codes that would illustrate the whole imputations process of
datasets that would later be used in analysis.
The simplest function that can be used for understanding imputation function is as stated
below:
R Code: random.imp<- function (a){
missing <- is.na(a)
n.missing<- sum(missing)
a.obs<- a[!missing]
imputed <- a
imputed[missing] <- sample (a.obs, n.missing, replace=TRUE)
return (imputed)}.
In order to visualize and see how the functions worked, a small dataset was taken and then
the function as above was run line by line. Then use random.imp to create a complete data
vector for water lost through evaporation represented by WLTE.
R code: earnings.imp<- random.imp (WLTE).
6
⊘ This is a preview!⊘
Do you want full access?
Subscribe today to unlock all pages.
Trusted by 1+ million students worldwide
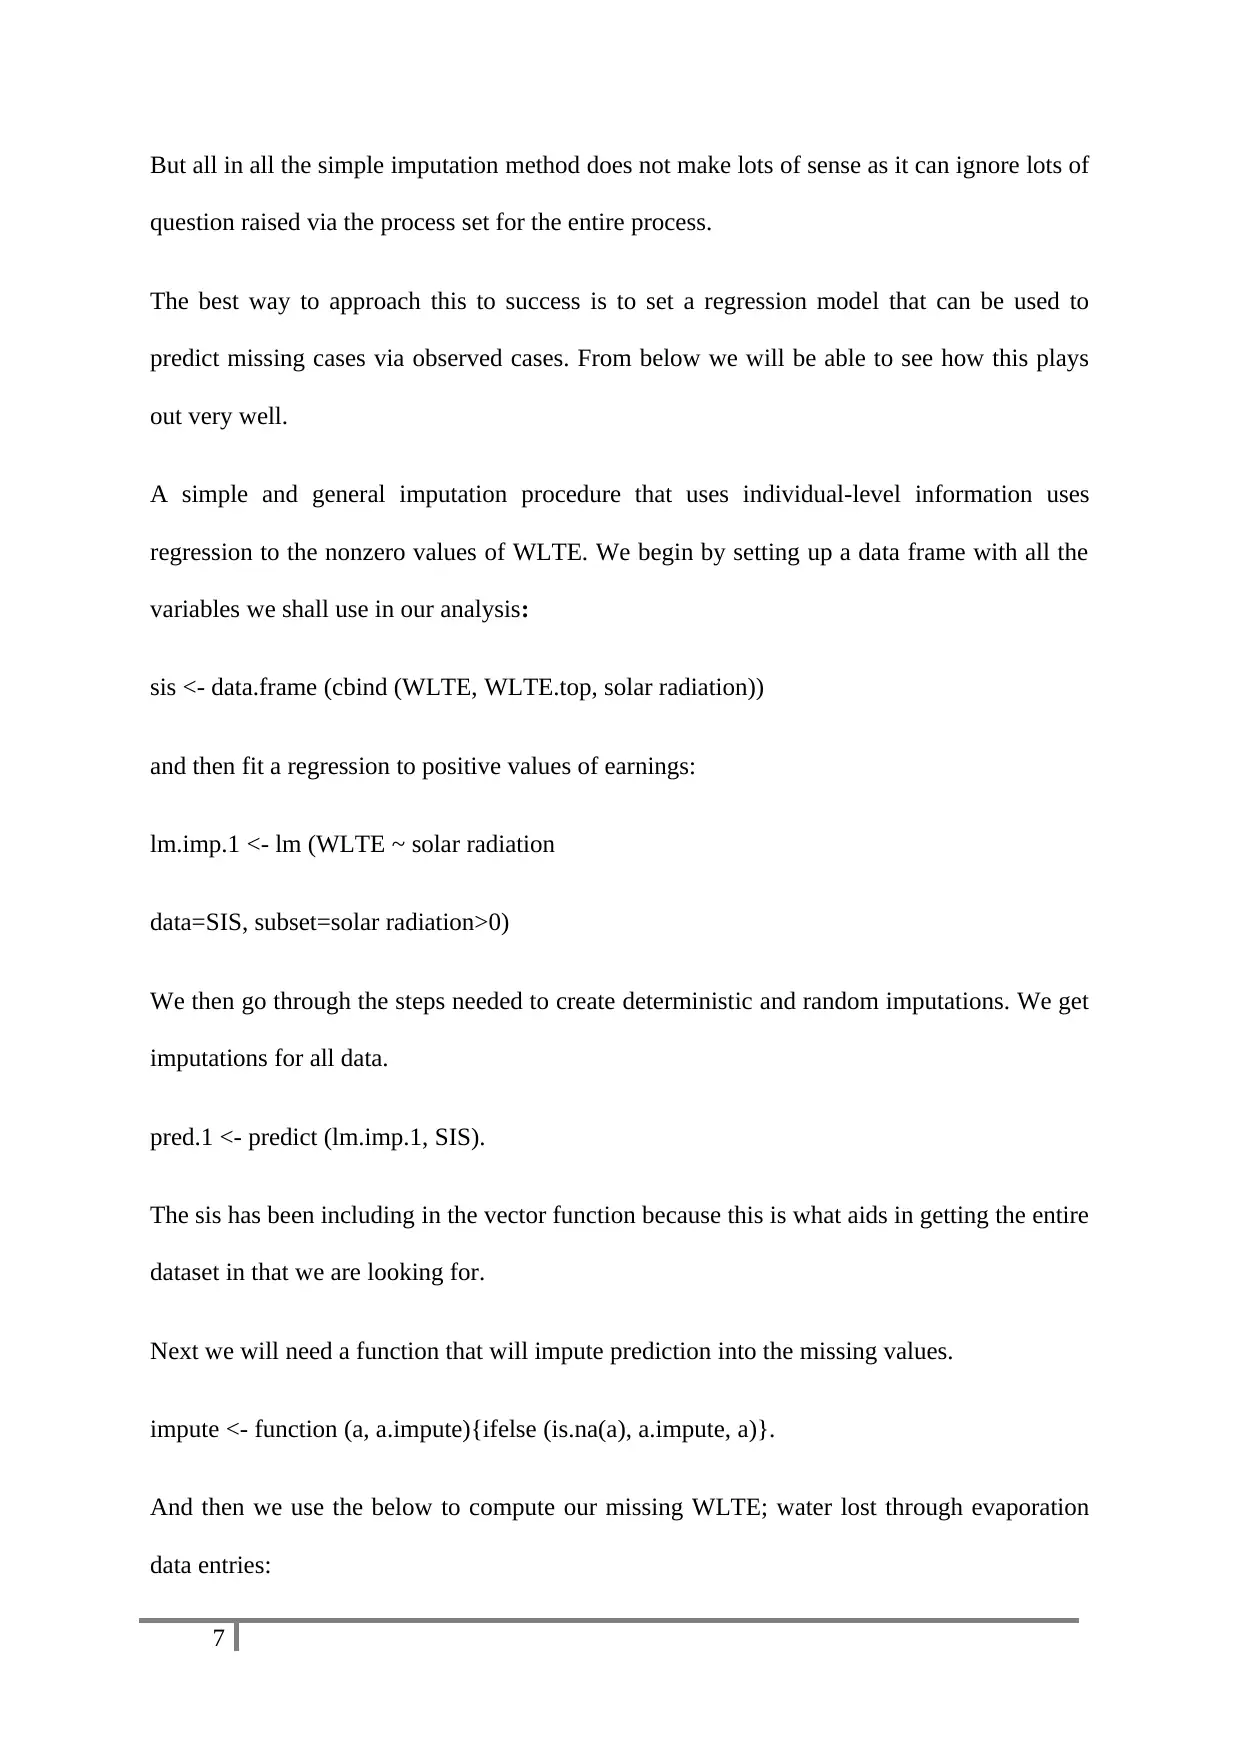
But all in all the simple imputation method does not make lots of sense as it can ignore lots of
question raised via the process set for the entire process.
The best way to approach this to success is to set a regression model that can be used to
predict missing cases via observed cases. From below we will be able to see how this plays
out very well.
A simple and general imputation procedure that uses individual-level information uses
regression to the nonzero values of WLTE. We begin by setting up a data frame with all the
variables we shall use in our analysis:
sis <- data.frame (cbind (WLTE, WLTE.top, solar radiation))
and then fit a regression to positive values of earnings:
lm.imp.1 <- lm (WLTE ~ solar radiation
data=SIS, subset=solar radiation>0)
We then go through the steps needed to create deterministic and random imputations. We get
imputations for all data.
pred.1 <- predict (lm.imp.1, SIS).
The sis has been including in the vector function because this is what aids in getting the entire
dataset in that we are looking for.
Next we will need a function that will impute prediction into the missing values.
impute <- function (a, a.impute){ifelse (is.na(a), a.impute, a)}.
And then we use the below to compute our missing WLTE; water lost through evaporation
data entries:
7
Paraphrase This Document
Need a fresh take? Get an instant paraphrase of this document with our AI Paraphraser
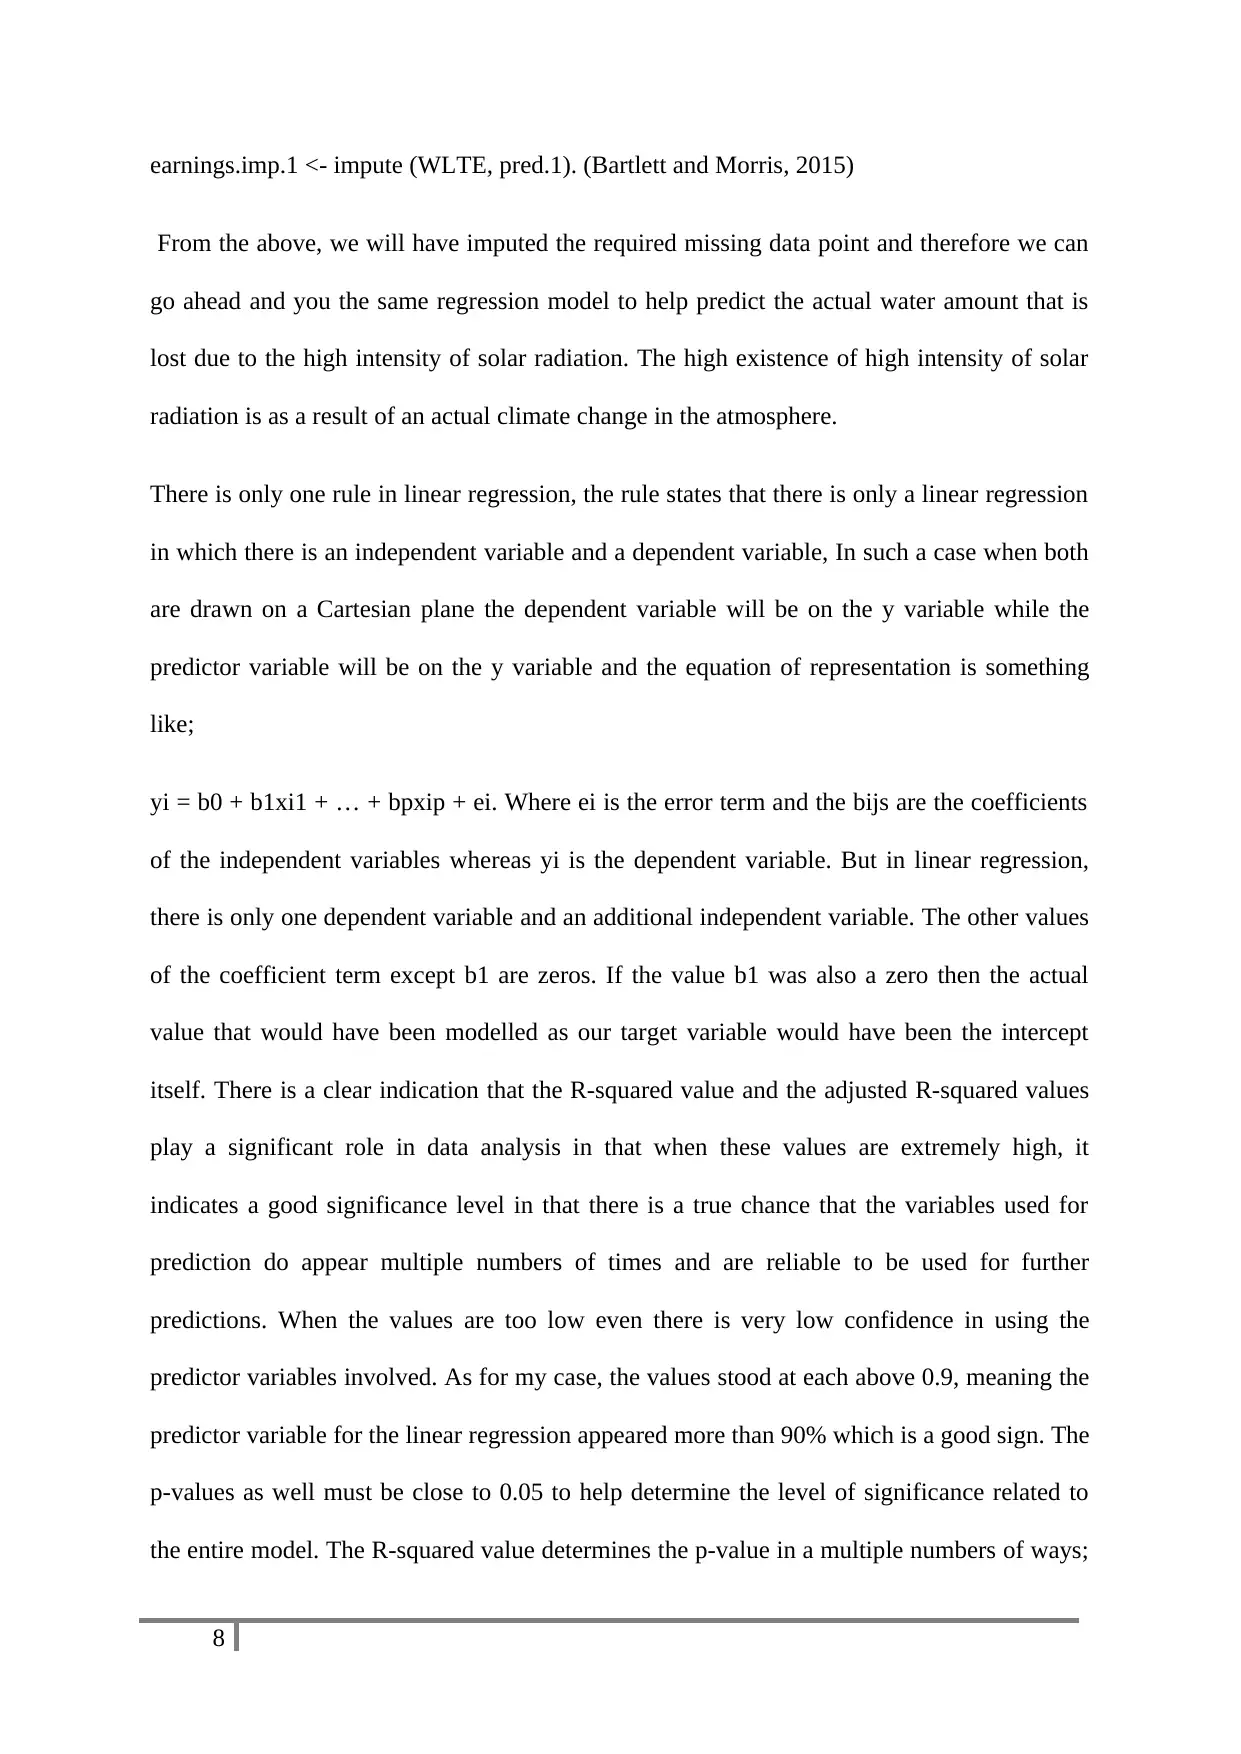
earnings.imp.1 <- impute (WLTE, pred.1). (Bartlett and Morris, 2015)
From the above, we will have imputed the required missing data point and therefore we can
go ahead and you the same regression model to help predict the actual water amount that is
lost due to the high intensity of solar radiation. The high existence of high intensity of solar
radiation is as a result of an actual climate change in the atmosphere.
There is only one rule in linear regression, the rule states that there is only a linear regression
in which there is an independent variable and a dependent variable, In such a case when both
are drawn on a Cartesian plane the dependent variable will be on the y variable while the
predictor variable will be on the y variable and the equation of representation is something
like;
yi = b0 + b1xi1 + … + bpxip + ei. Where ei is the error term and the bijs are the coefficients
of the independent variables whereas yi is the dependent variable. But in linear regression,
there is only one dependent variable and an additional independent variable. The other values
of the coefficient term except b1 are zeros. If the value b1 was also a zero then the actual
value that would have been modelled as our target variable would have been the intercept
itself. There is a clear indication that the R-squared value and the adjusted R-squared values
play a significant role in data analysis in that when these values are extremely high, it
indicates a good significance level in that there is a true chance that the variables used for
prediction do appear multiple numbers of times and are reliable to be used for further
predictions. When the values are too low even there is very low confidence in using the
predictor variables involved. As for my case, the values stood at each above 0.9, meaning the
predictor variable for the linear regression appeared more than 90% which is a good sign. The
p-values as well must be close to 0.05 to help determine the level of significance related to
the entire model. The R-squared value determines the p-value in a multiple numbers of ways;
8
one shows the actual existence of the other. One is enough to determine the next. R-squared
being relevant shows the next is also relevant (Faraway, 2016).
When the linear model is determined in R the amount of the water that is lost via evaporation
can be predicted. Since complaints had been raised it is evident to see that the amounts of
evaporation of water from the soil would be very high. This then would be addressed by
storing water that can either be used for irrigation at the water reservoirs when it rains or
planting trees or even mulching to prevent the excess water evaporation causing withering of
plants and other crops that are used for food and other things.
On the second imputation on the issue of the flood, we will venture into multiple linear
regression, where our one and the only dependent variable is the amount of water lost through
floods (meaning amount of water that is not tapped into reservoirs and that affect people's
lives) when it rains. Here predictor variables will be the availability of reservoirs, availability
of drainage and soils drainage. The existence of enough reservoirs that would trap enough
water that would otherwise be lost to floods would help a great deal on the level of water lost
via floods and that that affect peoples' lives. The availability of proper drainage would clearly
help in that the more water would be channelled to reservoirs. Soil's drainage system is also
advantageous as it aids in percolating lots of the water into the lower layers. The absence of
any of these would mean more water lost to floods (McElreath, 2018)
Methodology
For carrying out research on imputation of hydrological data in weather system, there are
several engineering tools and methods that should be used. The following are some of the
tools and techniques used for this purpose.
National Stormwater Calculator
9
⊘ This is a preview!⊘
Do you want full access?
Subscribe today to unlock all pages.
Trusted by 1+ million students worldwide
This is a desktop application that can estimate the amount of annual rainfall and the
frequency of runoff. The engineering calculation behind the app is based on local soil
conditions, historical rainfall records and land cover.
Exploration and Graphics for River Trends (EGRET)
This tool determines the long-term changes in water quality and streamflow which is
measured through weighted regression on time, season and discharge.
NOAA Weather and Climate Toolkit
This is a free and independent platform supported by esteemed corporation NOAA and uses
radar, satellite and model data for providing visualizations of weather and climate data.
Global Precipitation Measurement Education Tools
Supported by NASA’s Global Precipitation Measurement (GPM) mission, this tool helps to
measure Earth’s water cycle, climate and weather and techniques for studying them.
The methodology is technique which is based on analysis. The researcher of this project has
been used the methodology of research. The research philosophy, research technique and
designed, research approach, data analysis and data collection process have been used in this
project by the researcher.
Research Philosophy: The research philosophy contains three types of philosophy in this
project and these are realism philosophy, positivism philosophy and interpretive philosophy.
The realism philosophy provides the elements of the research which are existing in the
nature. The positivism philosophy allows the researcher to get the scientific evidence to the
research. On the other hand the interpretive philosophy allows the researcher to keep human
perception at the time of dealing with aspects of sociology. In this project the researcher will
10
Paraphrase This Document
Need a fresh take? Get an instant paraphrase of this document with our AI Paraphraser
use positivism philosophy as it is based on empiricism and it also helps to improve the quality
of the research.
Research approach: The research approach includes two types of approaches on is
deductive and the other is inductive approach. The deductive approach helps the researcher to
improve the conjecture of the research which based on the existing theory and the inductive
approach helps in improving the theory of the research. The researcher of this project will
utilize the deductive approach as it makes the strategy which is depended on the given
conjecture and it will help the researcher to reach to the result and will provide more
authentic result.
Research designed: The research design allows the researcher to get the result in more
descriptive manner. There are three types of design in the research studies. The designs are
explanatory design, exploratory design and the other is descriptive disgn of research. The
explanatory design allows the development of the relationship among the variables of the
research. The explaratory research is used by the researcher when the researcher has limited
knowledge on the research topic and the exploratory design helps in collecting the
background information of the issue of the research. On the other hand the descriptive
research design allows the research in indentifying all the elements of the research and it
allows the use of qualitative and quantitative data collection method. The researcher will use
the descriptive research design in this study as the research has significant knowledge and it
will help to carry out the research in a depth way.
Data collection method: A data collection method includes two types of method which helps
the researcher in getting data on the research topic. These are primary data collection method
and secondary data collection method. The primary data collection method allows the
collection of data from getting interview and survey. The secondary data collection method is
11
based on the estimation of the secondary resources like journal, books and more. In this study
the researcher will utilize the secondary data collection method as it will provide more
authentic information about the topic research and the researcher would get information from
difference websites and from social network.
Data analyzing: There are two types of data analyzing and these are qualitative and
quantitative. The researcher of this project will use qualitative analysis which will help the
researcher to get more information by surveying.
Ethical consideration: The researcher has to use the Data Protection Act 1998 to protect and
restrict the information of the data of the research.
Research problem
Hydrological data helps to do proper analysis of the water cycles and circulation in order to
predict the future possibilities of the circulations and doing the necessary forecasts related to
it. But it has been seen that there is always some missing data in the data collecting process of
the hydrological data. These missing data sometimes cause problems in the analysis of the
data. This fails to provide proper results of the analysis and thus hinder the process of right
forecasting and future prediction of the water circulation. Thus it is very important for the
analysts to do proper imputations of the missing data in the hydrological dataset in order to
fill the gaps in the dataset and provide a complete and right dataset for the proper analysis of
the future possibilities of the water circulation. The imputation of the necessary data in the
hydrological dataset should be done in a very responsible way as providing a wrong data by
any chance in the hydrological dataset can result into wrong prediction and in turns in wrong
forecasting(Gao, 2017). Therefore the data imputation process is a very delicate task and
should be done with proper measures and responsibility. Data imputation is a very important
thing for filling the gaps in the hydrological dataset by inserting the missing data in it. But it
12
⊘ This is a preview!⊘
Do you want full access?
Subscribe today to unlock all pages.
Trusted by 1+ million students worldwide
1 out of 19


Your All-in-One AI-Powered Toolkit for Academic Success.
+13062052269
info@desklib.com
Available 24*7 on WhatsApp / Email
![[object Object]](/_next/static/media/star-bottom.7253800d.svg)
Unlock your academic potential
Copyright © 2020–2026 A2Z Services. All Rights Reserved. Developed and managed by ZUCOL.