Surface Water Hydrology Assignment 2 - Calculations & Analysis
VerifiedAdded on 2021/06/14
|12
|1153
|47
Homework Assignment
AI Summary
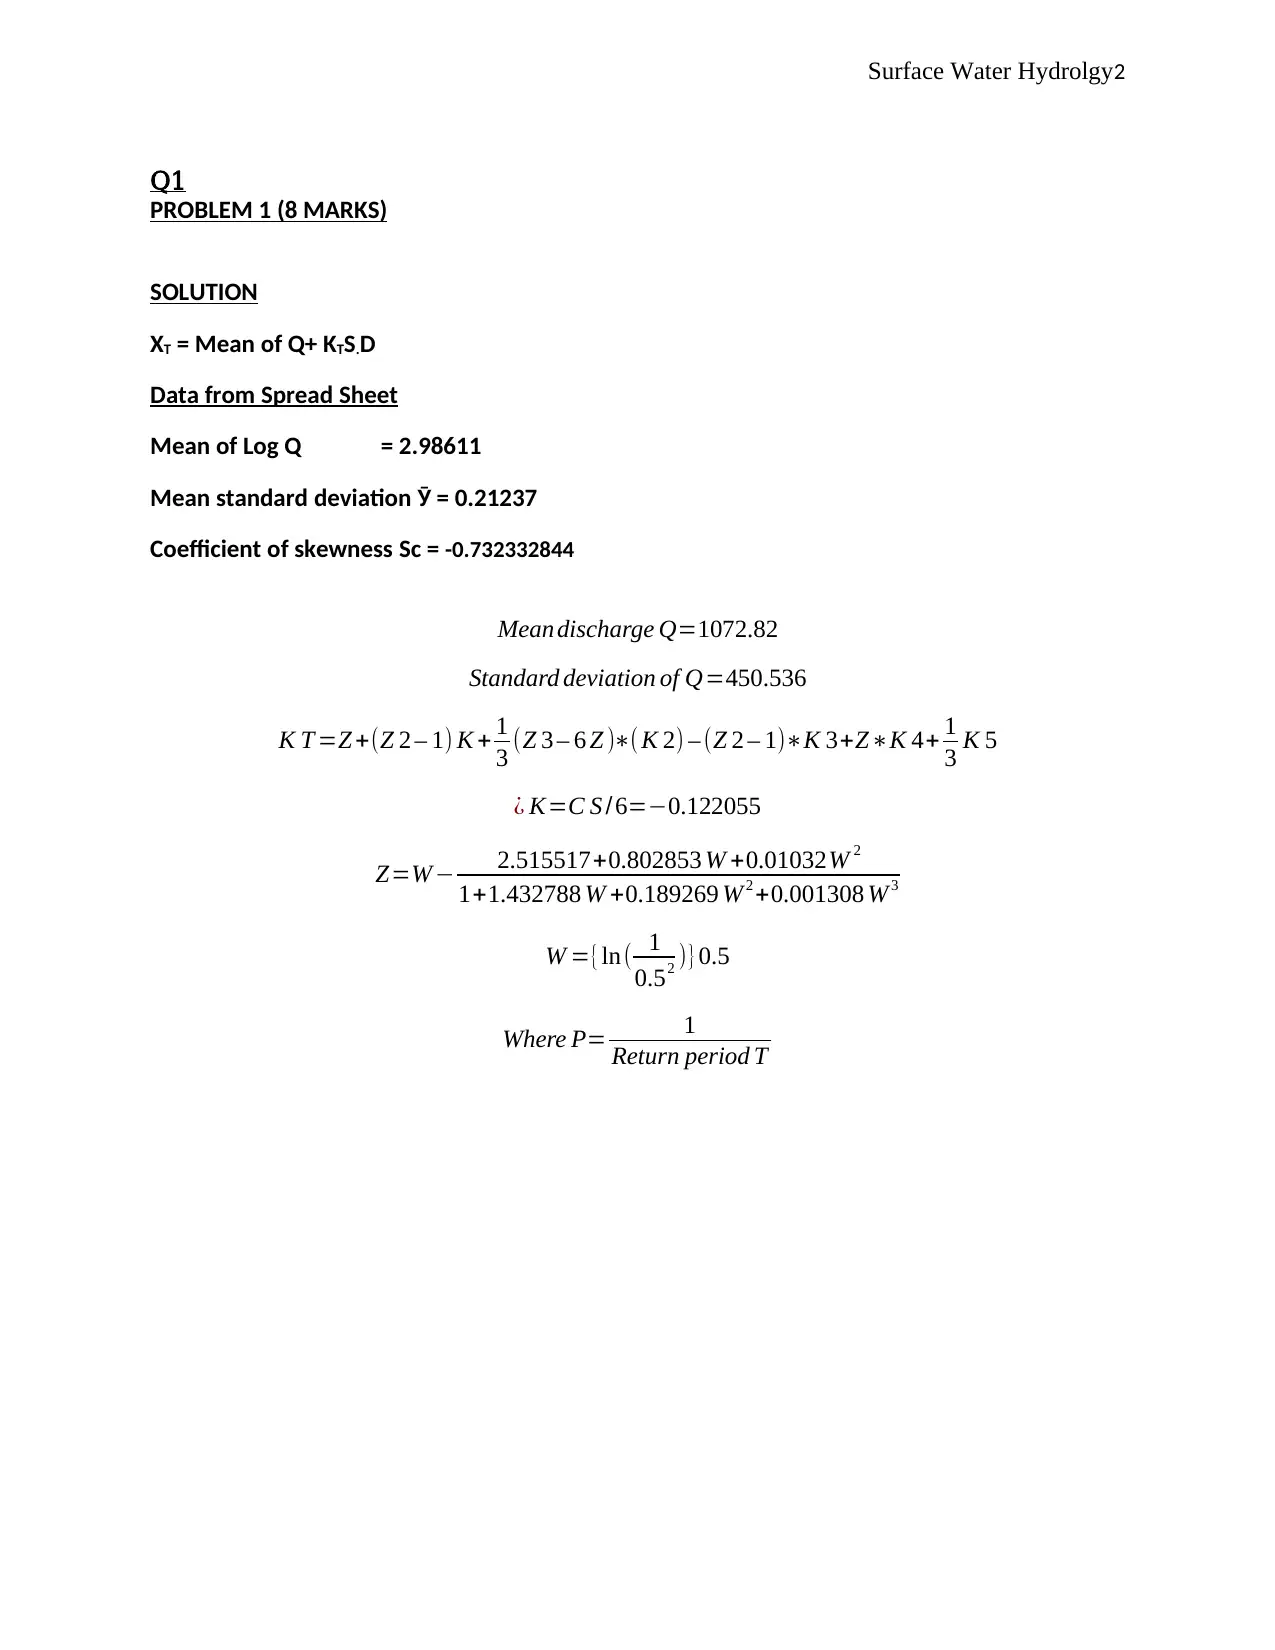
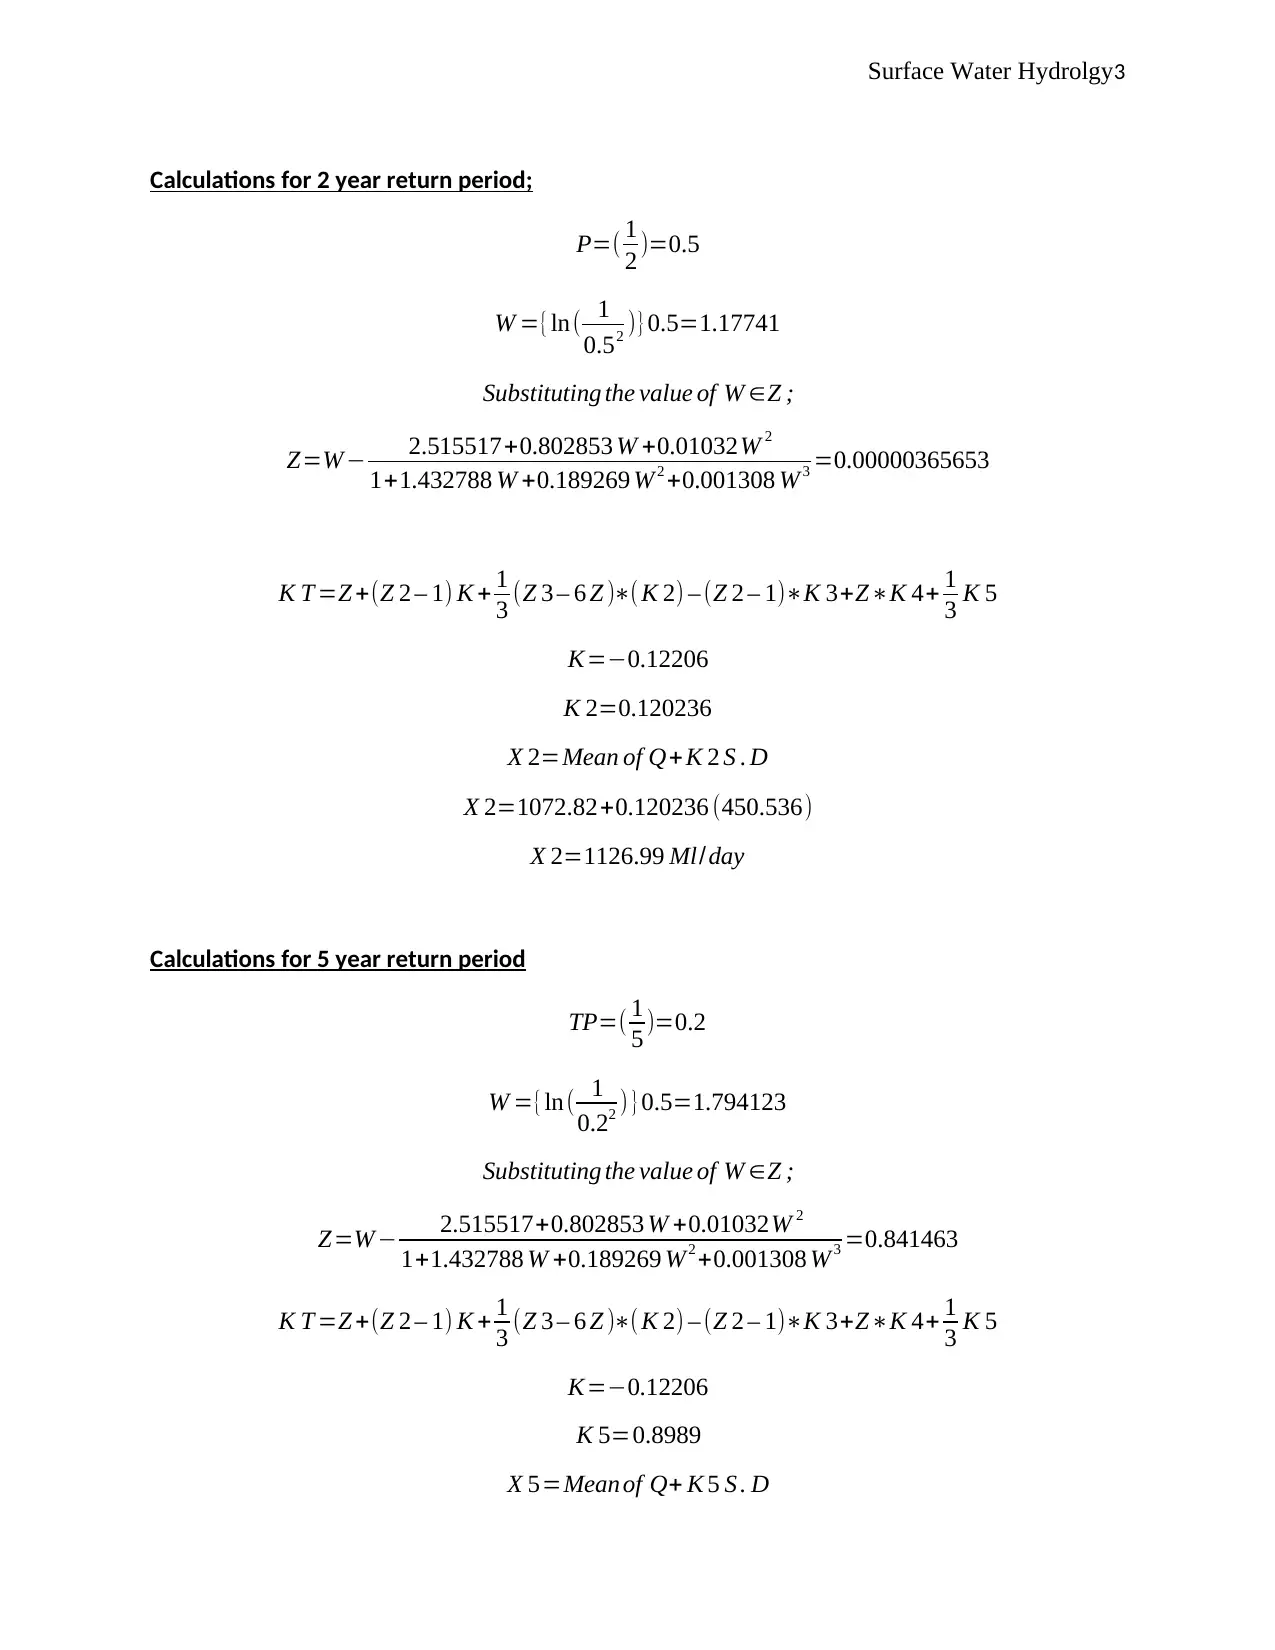
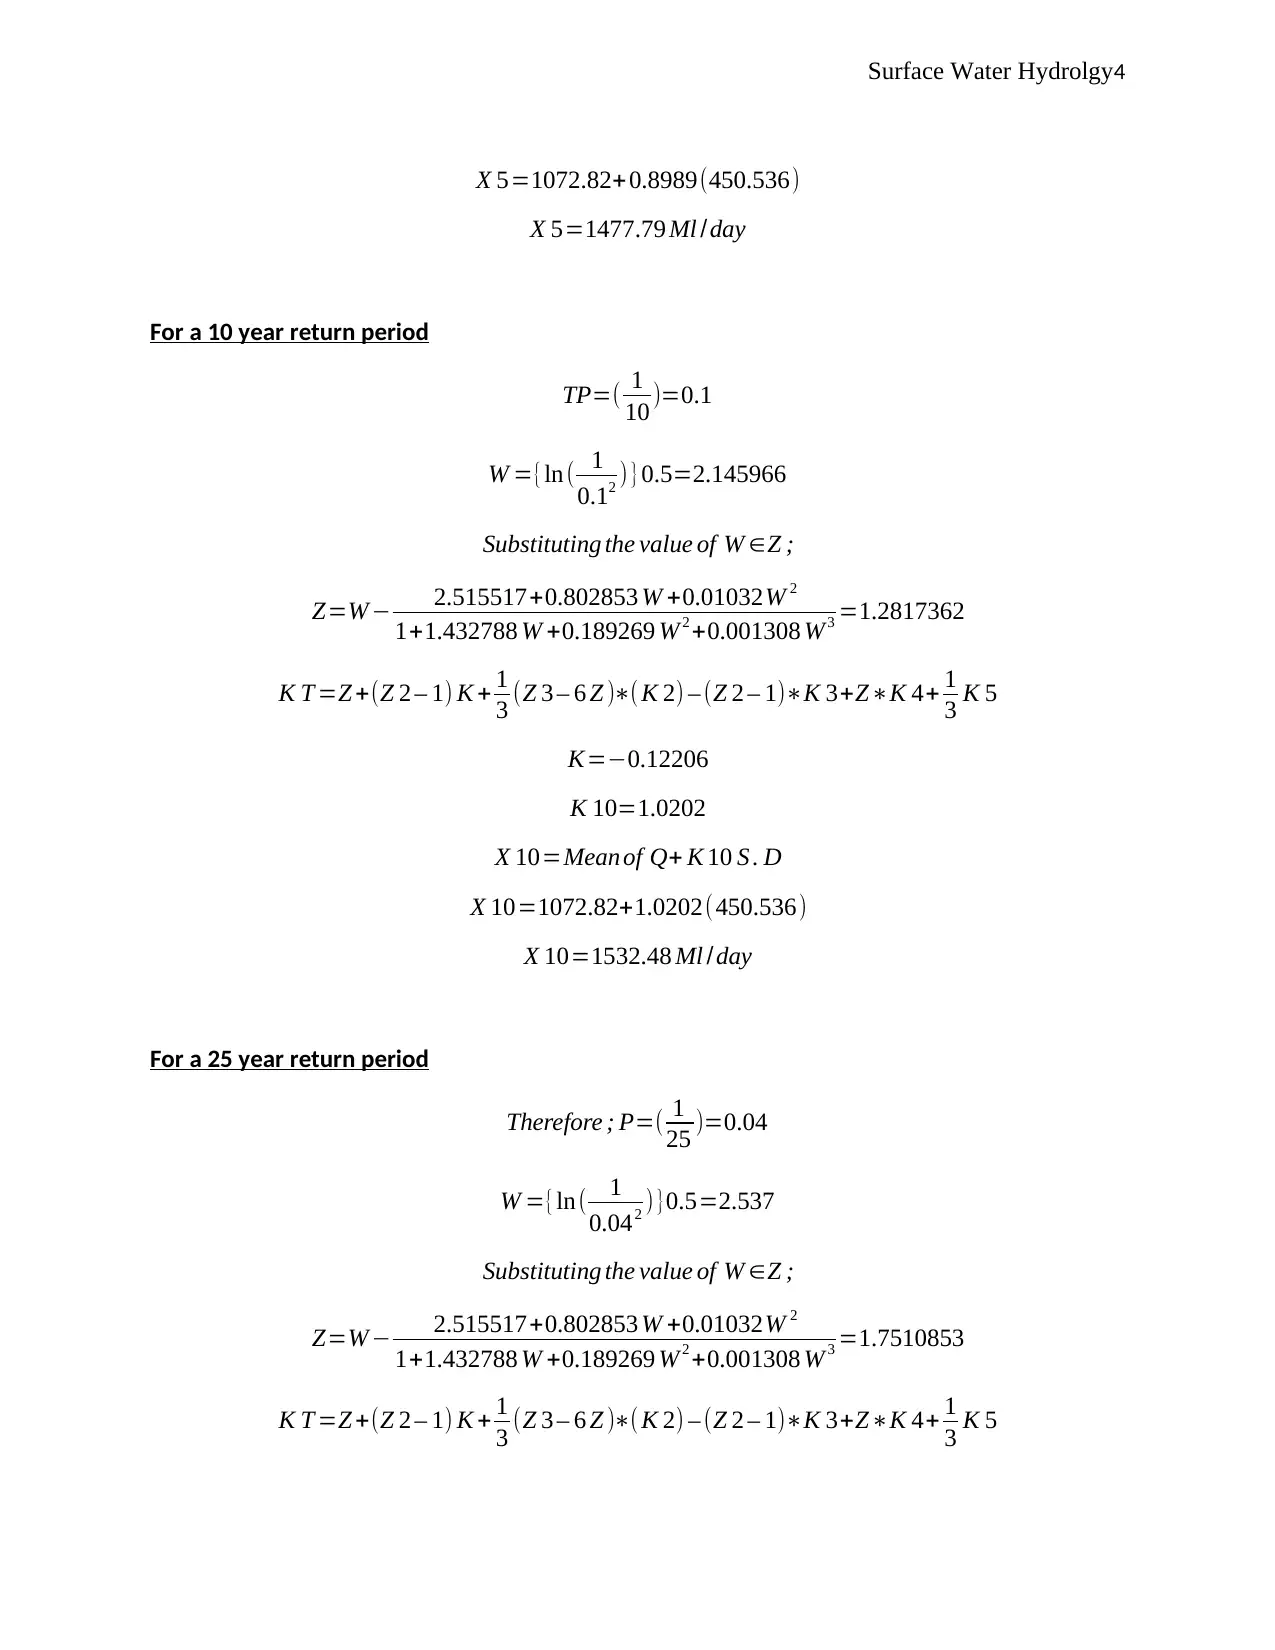
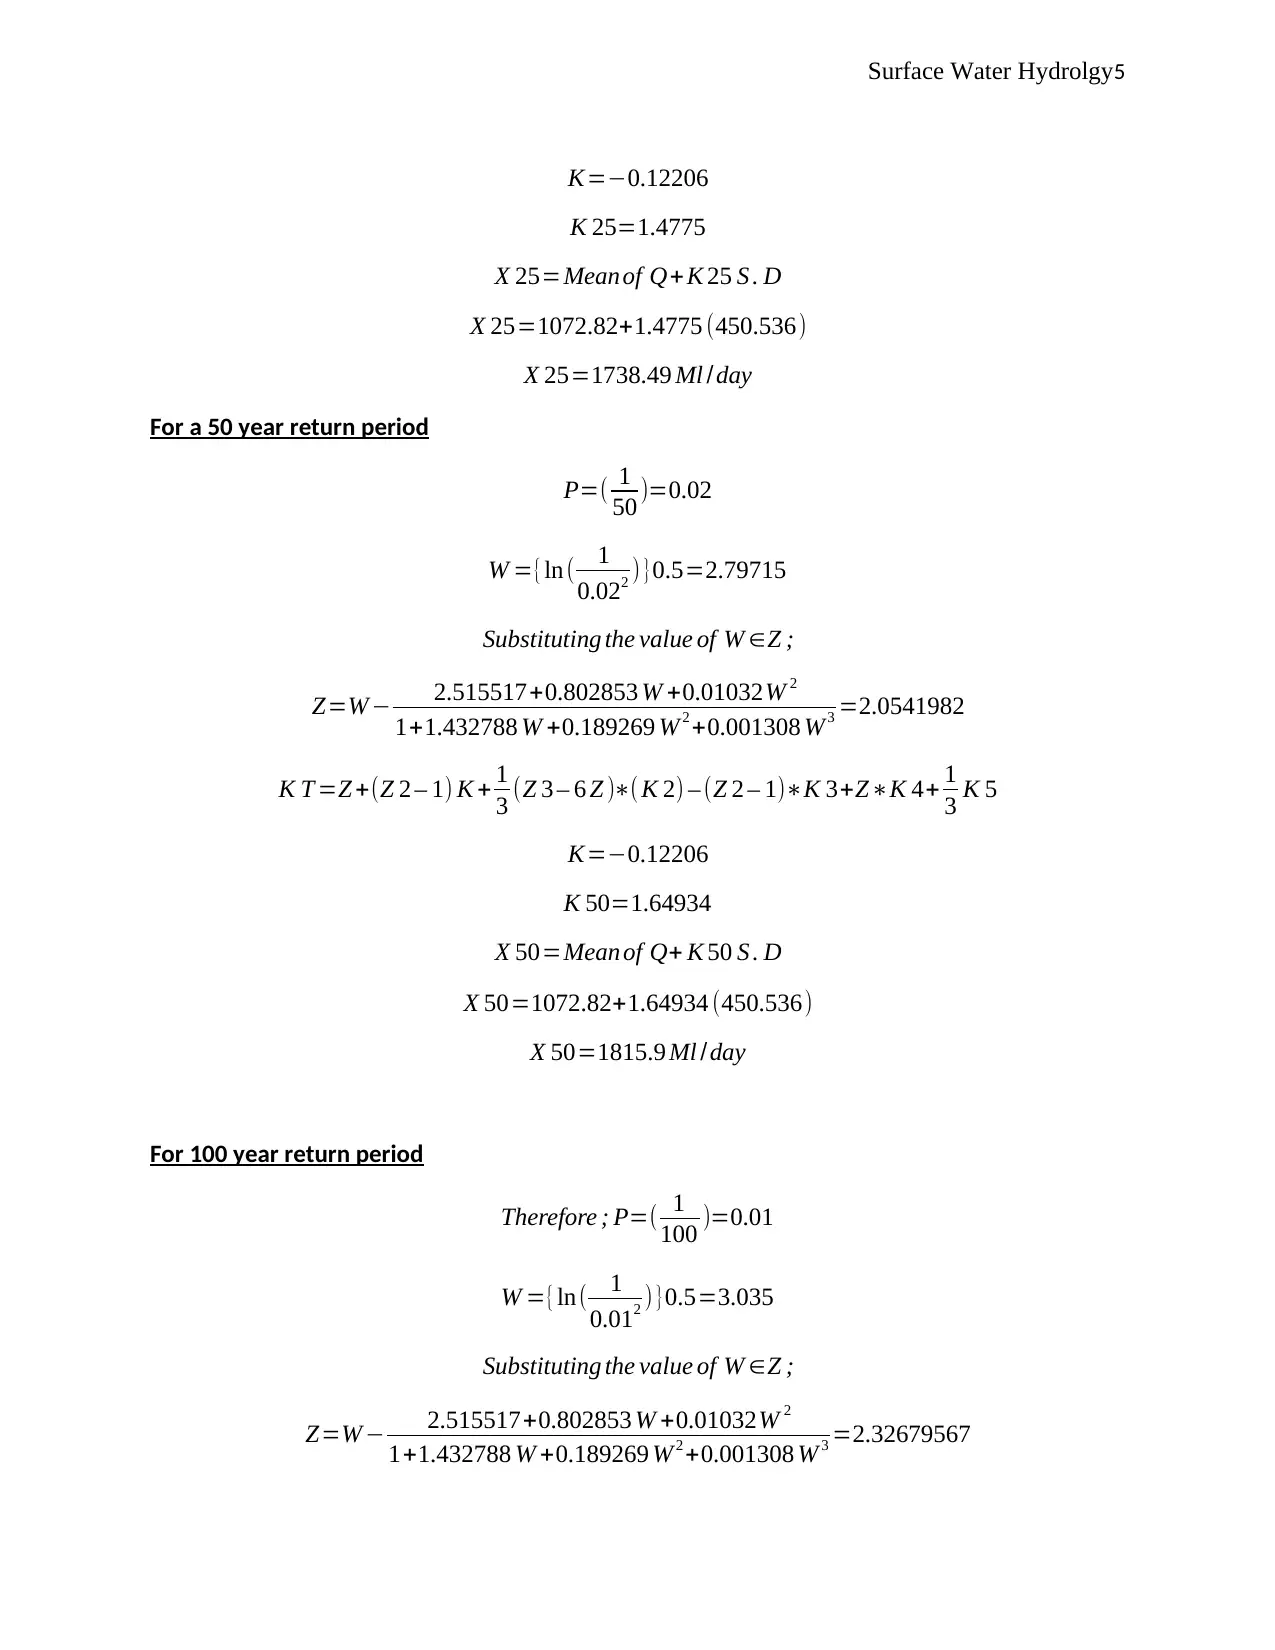
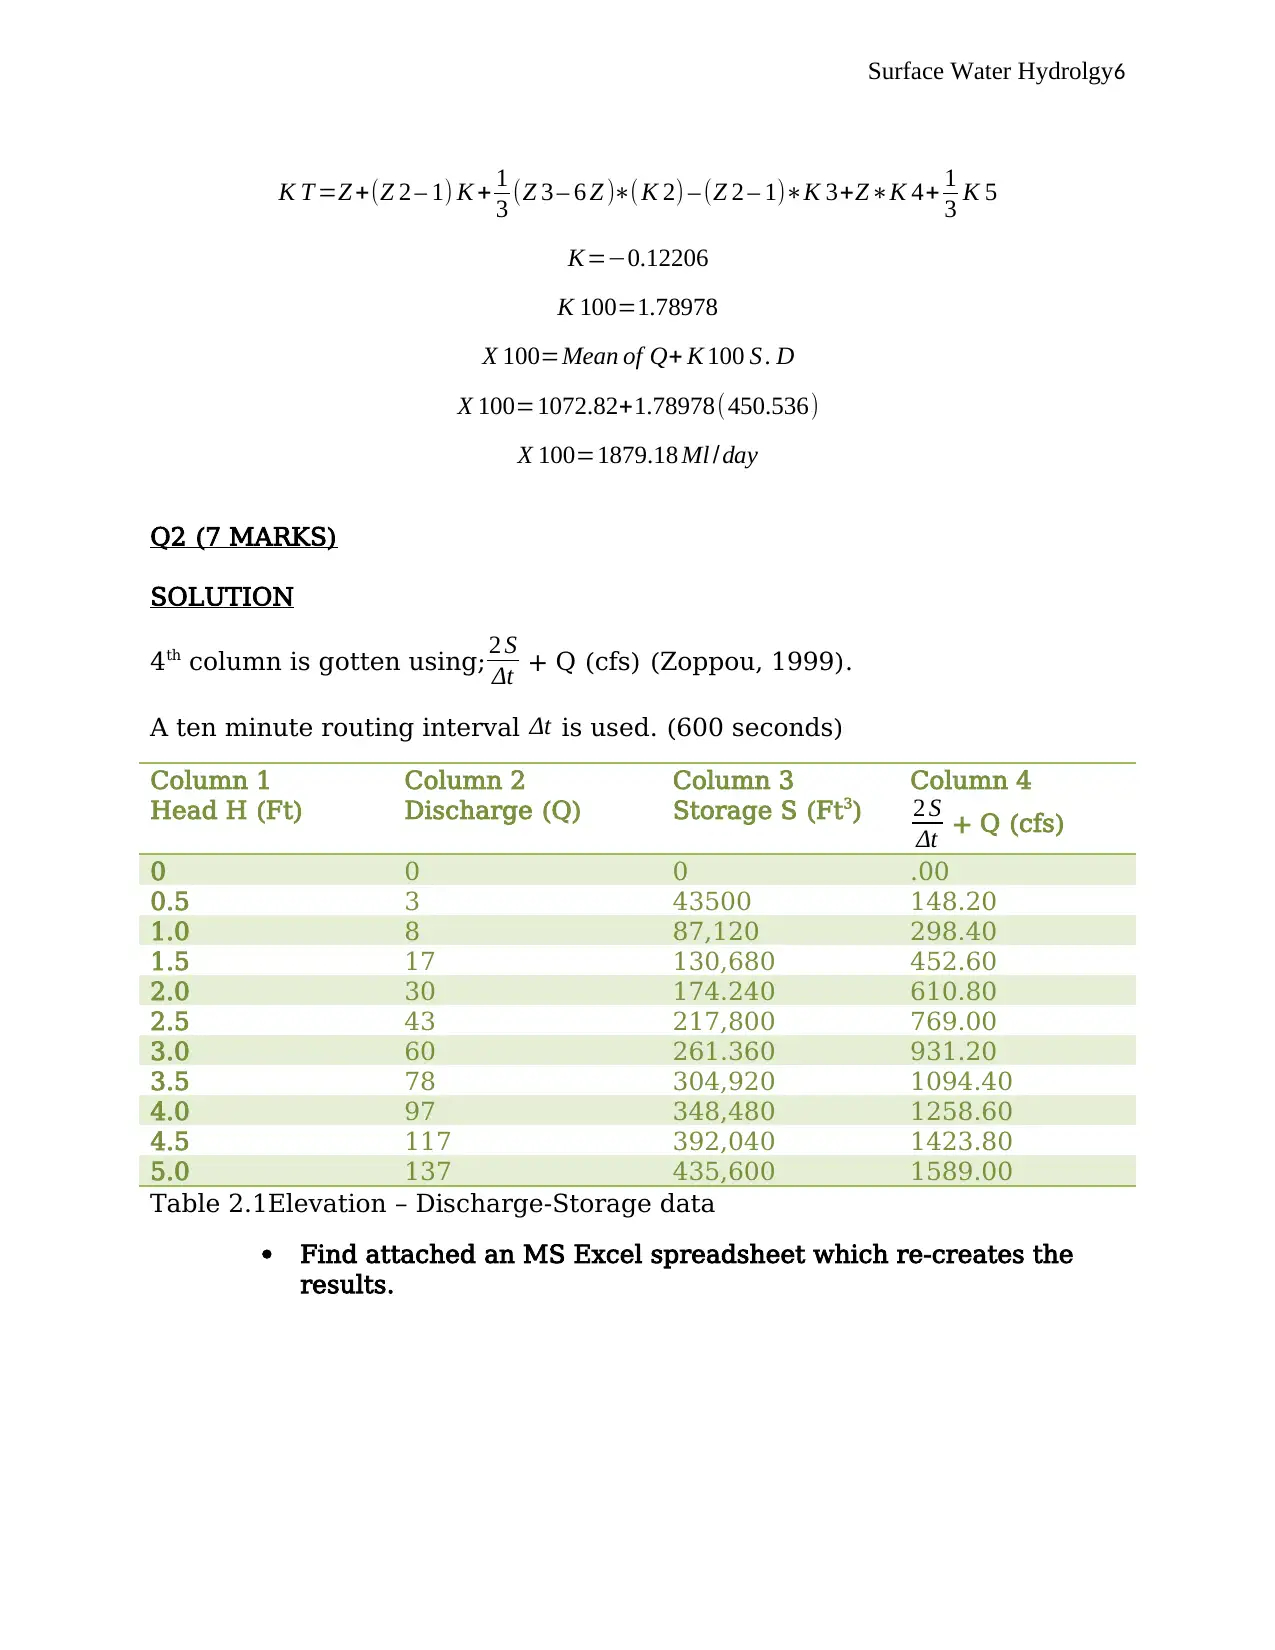
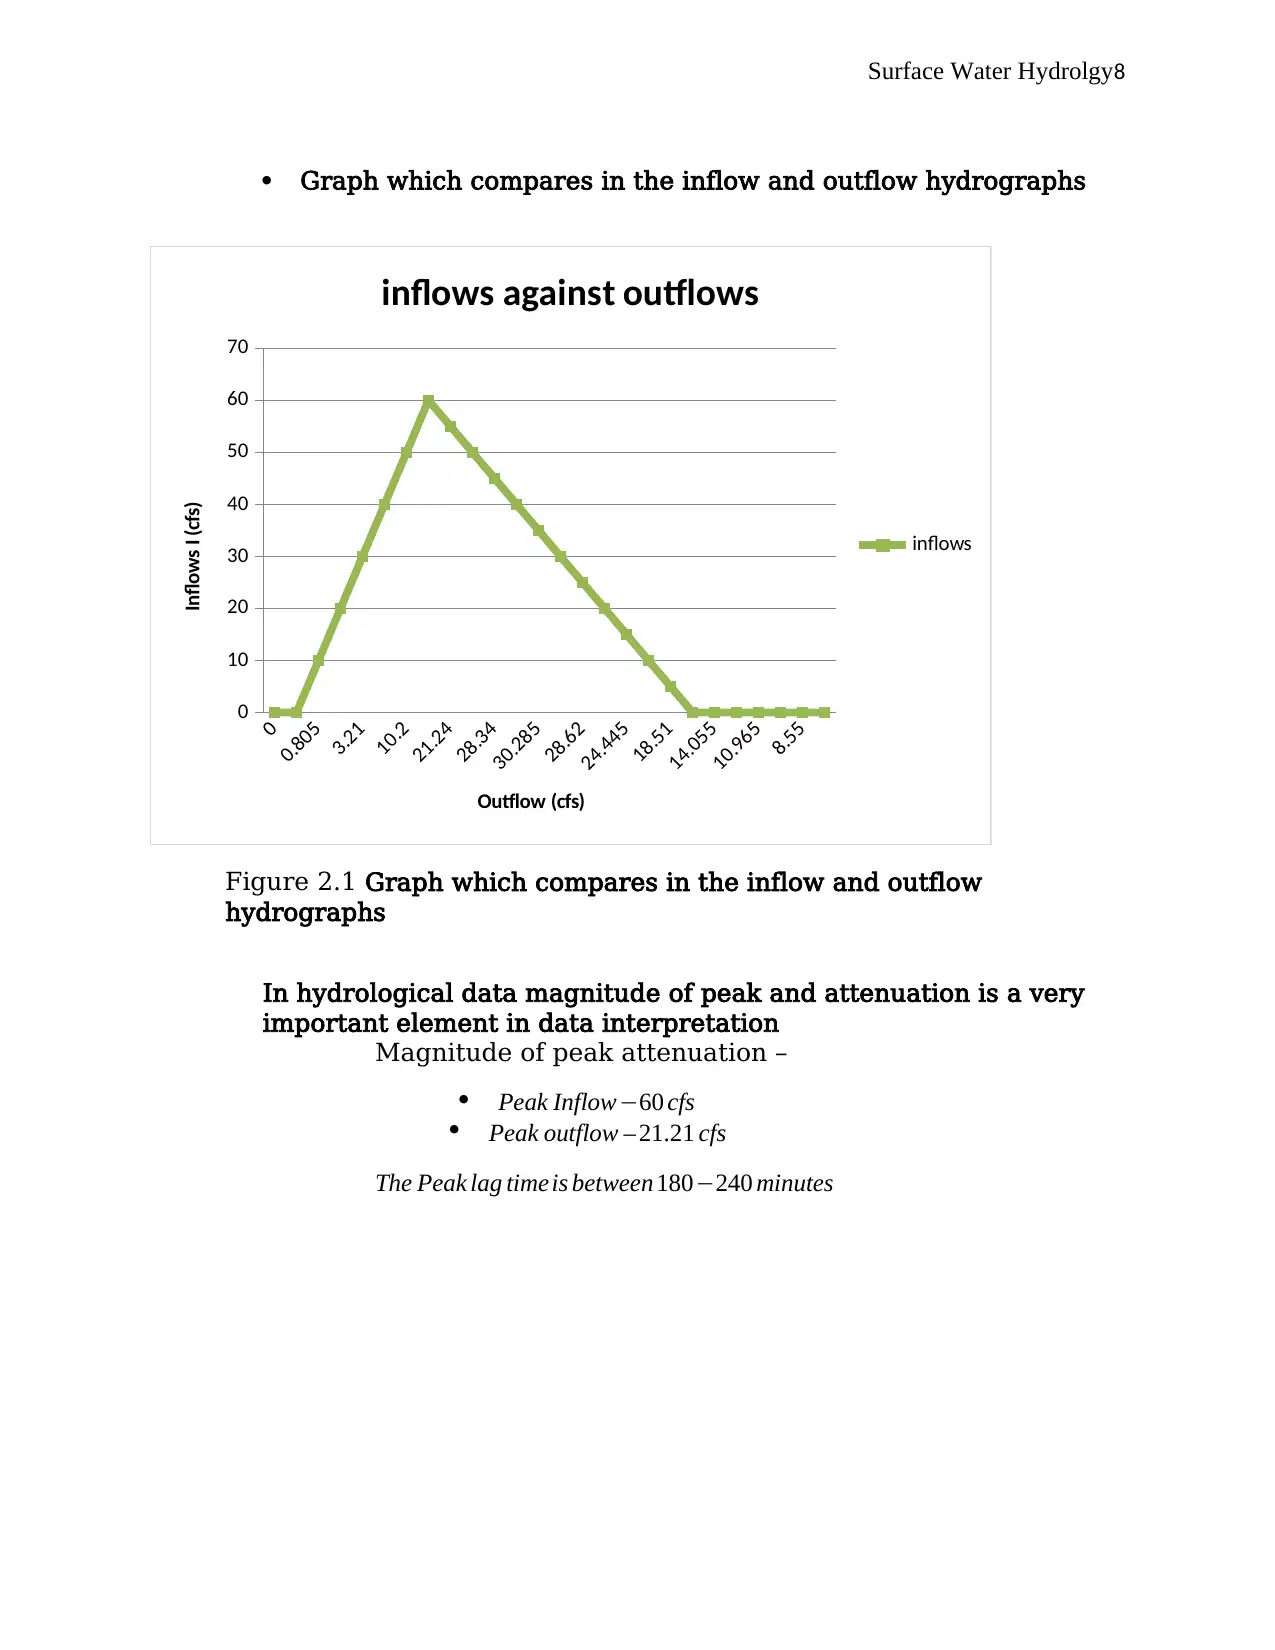
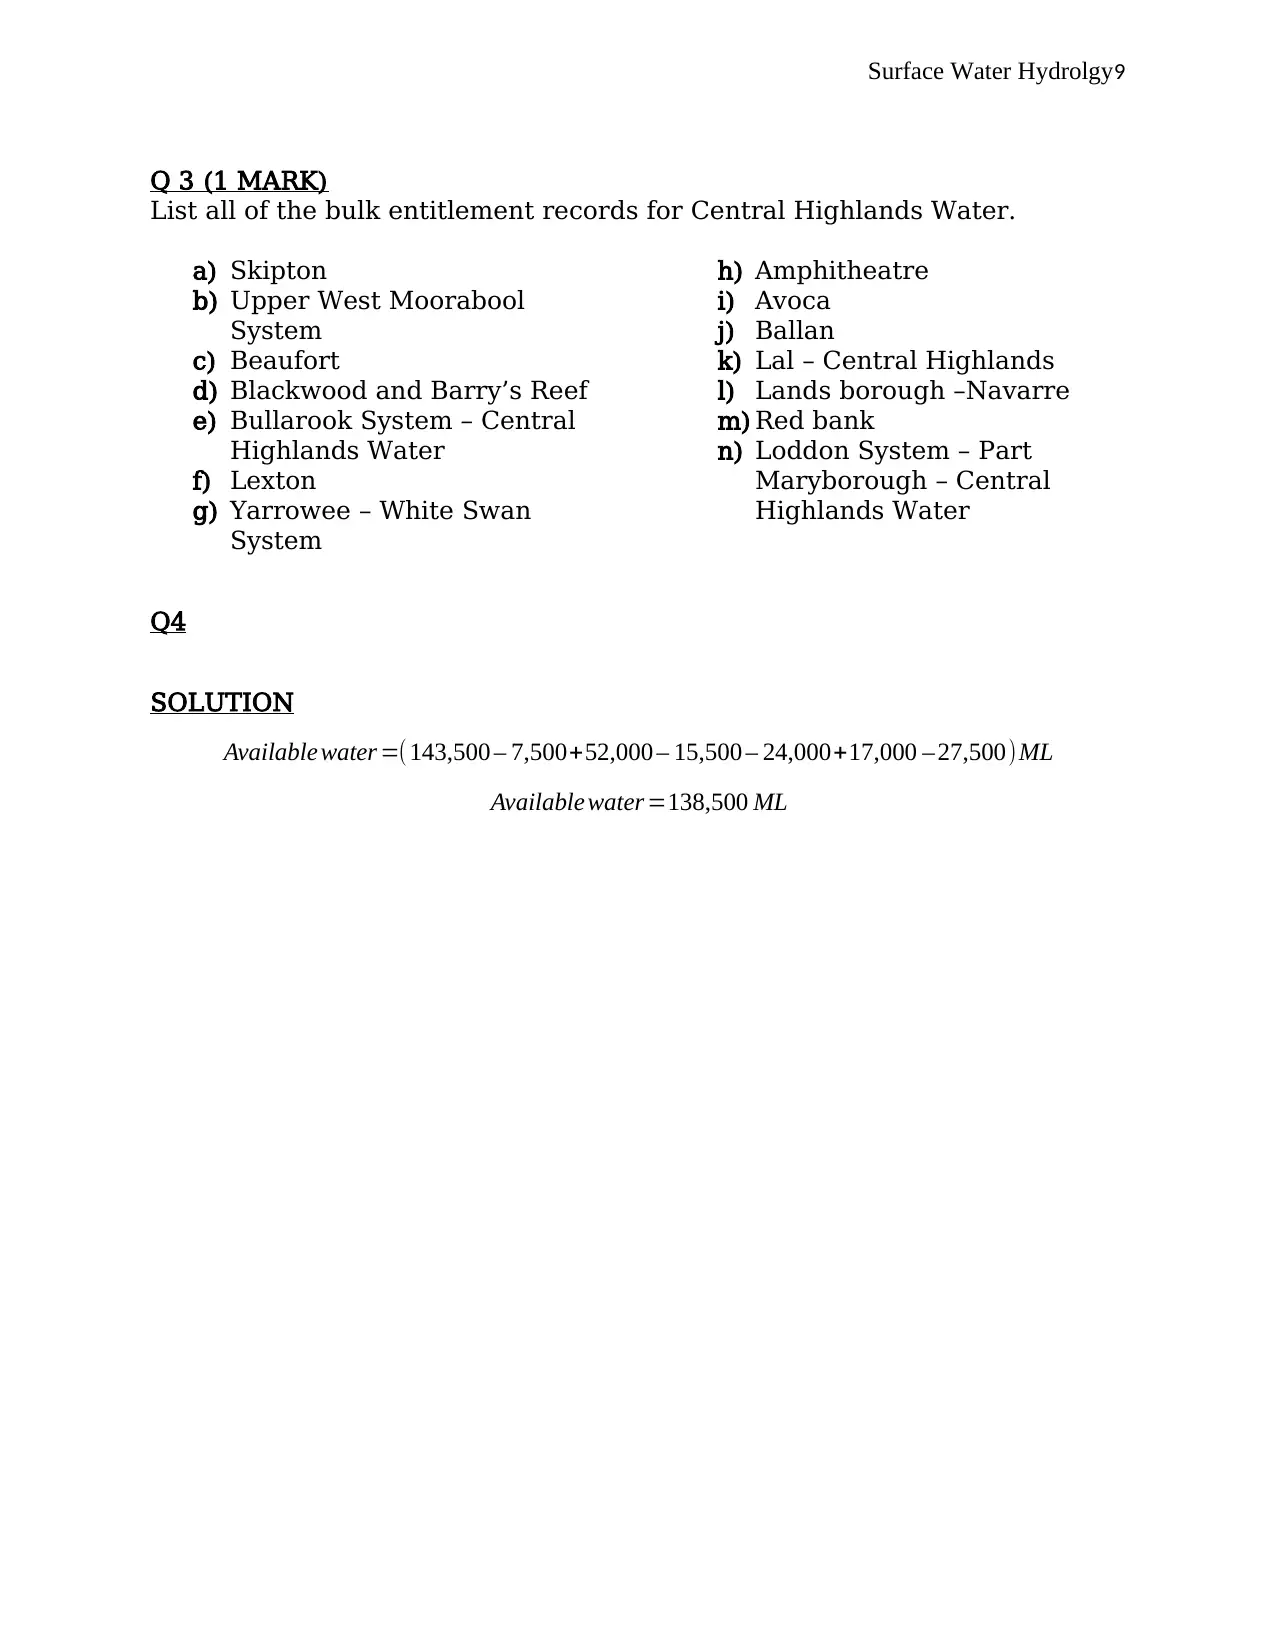
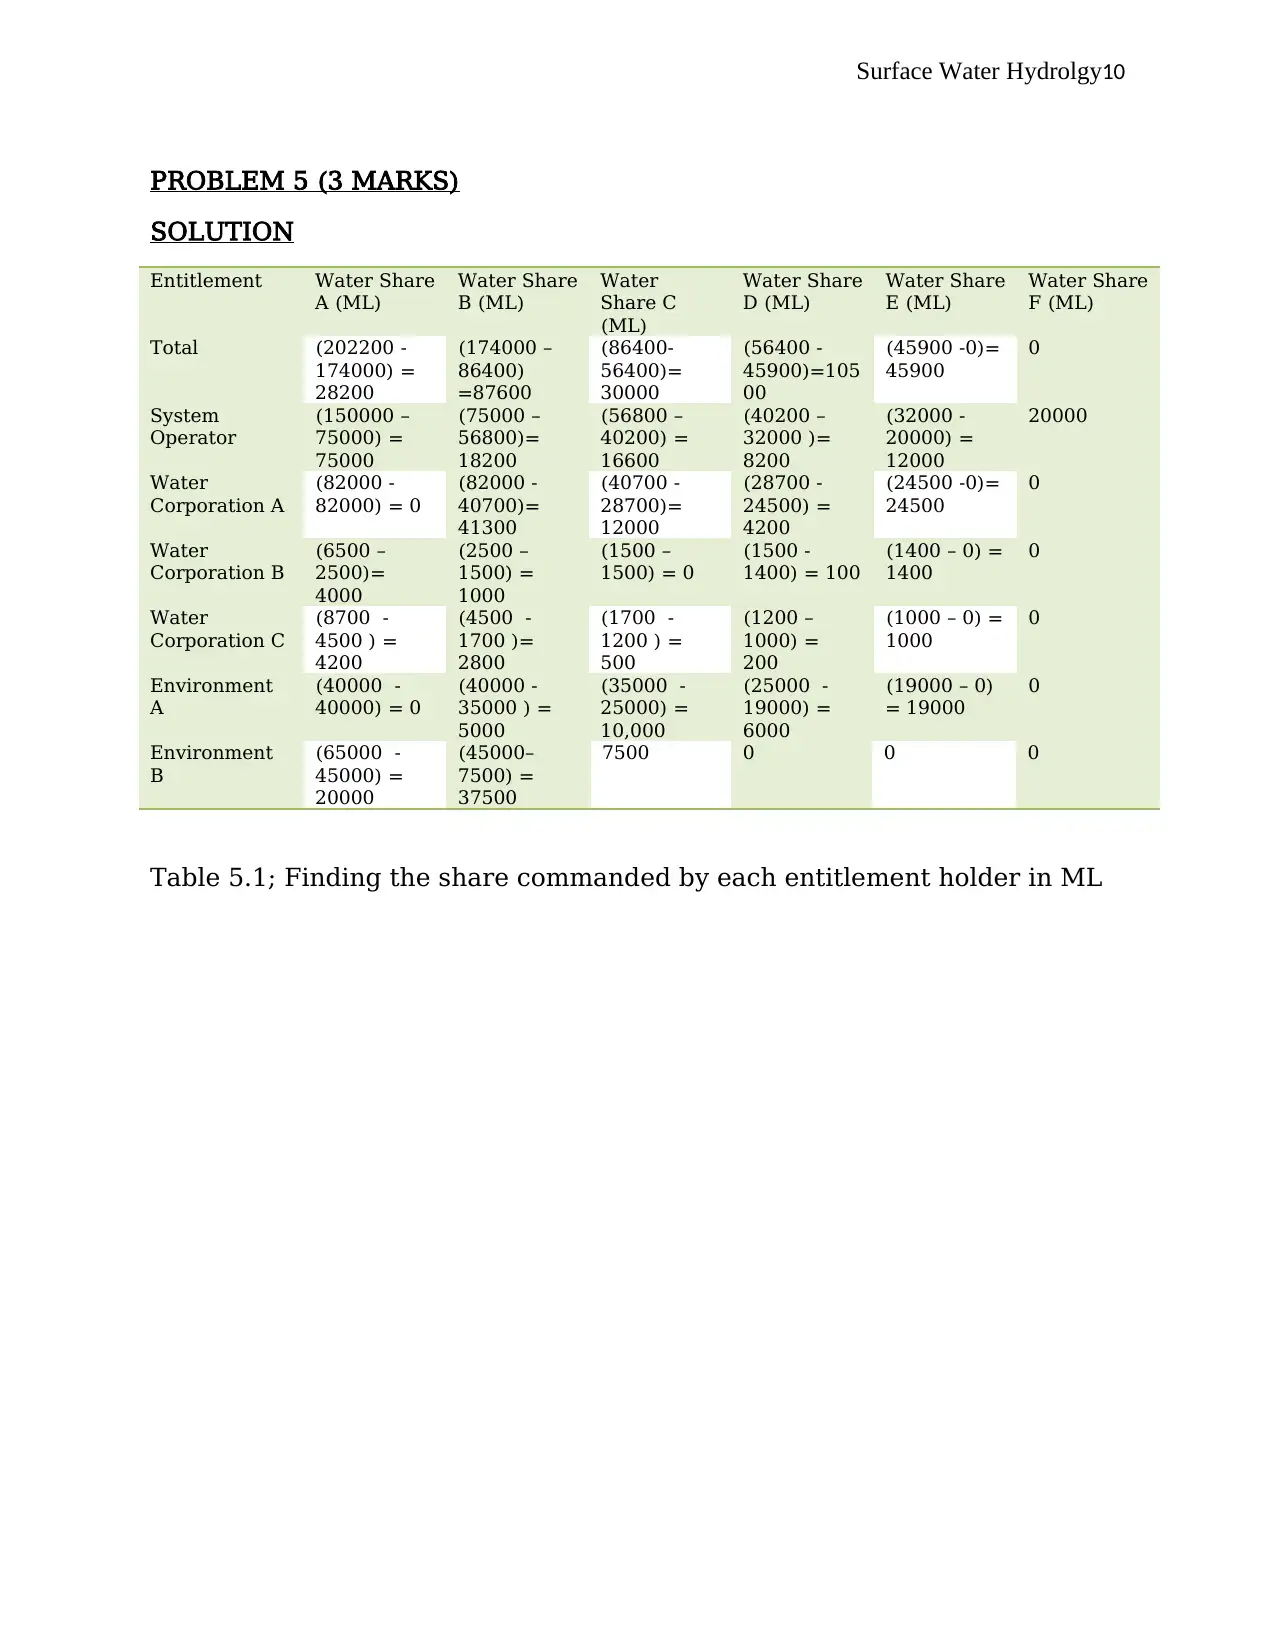
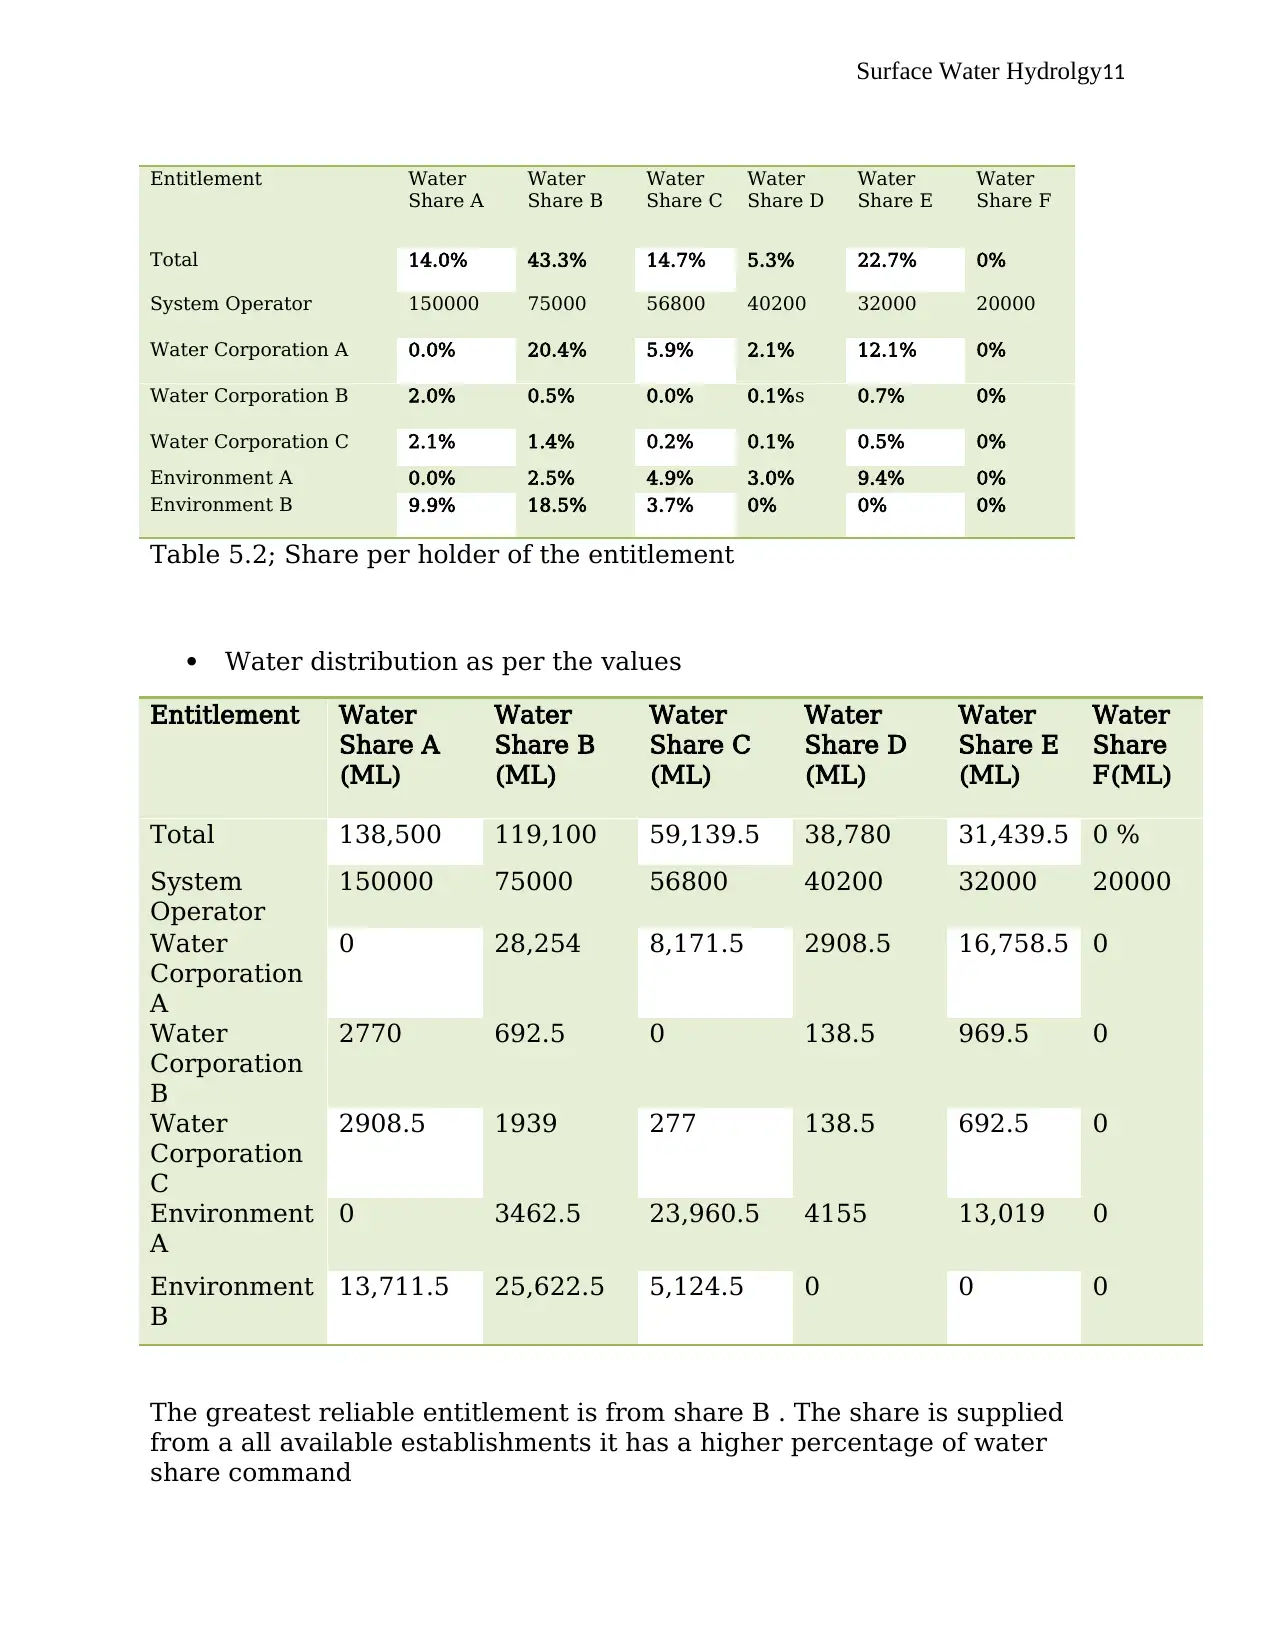
This document presents a comprehensive solution to a surface water hydrology assignment. It begins with flood frequency analysis using the log Pearson type 3 distribution, calculating return periods for different scenarios. The solution then moves on to hydrograph analysis, presenting data on head, discharge, and storage to create inflow and outflow hydrographs, with an emphasis on peak magnitude and attenuation. The assignment also includes a list of bulk entitlement records for Central Highlands Water, and a detailed analysis of water share distribution among various entitlement holders, including system operators, water corporations, and environmental entities. The analysis involves calculating water shares, percentages, and total volumes, with a focus on the greatest reliable entitlement. The document also references several key hydrological studies and resources.

Surface Water Hydrolgy1
Surface Water Hydrology
Assignment 2
[Student Number]
[Student Name]
Surface Water Hydrology
Assignment 2
[Student Number]
[Student Name]
Paraphrase This Document
Need a fresh take? Get an instant paraphrase of this document with our AI Paraphraser

Surface Water Hydrolgy2
Q1
PROBLEM 1 (8 MARKS)
SOLUTION
XT = Mean of Q+ KTS.D
Data from Spread Sheet
Mean of Log Q = 2.98611
Mean standard deviation Ӯ = 0.21237
Coefficient of skewness Sc = -0.732332844
Mean discharge Q=1072.82
Standard deviation of Q=450.536
K T =Z +(Z 2 – 1) K + 1
3 (Z 3 – 6 Z )∗( K 2) – (Z 2 – 1)∗K 3+Z∗K 4+ 1
3 K 5
¿ K=C S /6=−0.122055
Z=W− 2.515517+0.802853 W +0.01032W 2
1+1.432788 W +0.189269 W 2 +0.001308 W3
W ={ln( 1
0.52 )}0.5
Where P= 1
Return period T

Surface Water Hydrolgy3
Calculations for 2 year return period;
P=( 1
2 )=0.5
W ={ln ( 1
0.52 )}0.5=1.17741
Substituting the value of W ∈Z ;
Z=W − 2.515517+0.802853 W +0.01032W 2
1+1.432788 W +0.189269 W2 +0.001308 W3 =0.00000365653
K T =Z +(Z 2 – 1) K + 1
3 (Z 3 – 6 Z )∗( K 2) – (Z 2 – 1)∗K 3+Z∗K 4+ 1
3 K 5
K=−0.12206
K 2=0.120236
X 2=Mean of Q+ K 2 S . D
X 2=1072.82+0.120236 (450.536)
X 2=1126.99 Ml/day
Calculations for 5 year return period
TP=( 1
5 )=0.2
W ={ln( 1
0.22 ) }0.5=1.794123
Substituting the value of W ∈Z ;
Z=W − 2.515517+0.802853 W +0.01032W 2
1+1.432788 W +0.189269 W2 +0.001308 W 3 =0.841463
K T =Z +(Z 2 – 1) K + 1
3 (Z 3 – 6 Z )∗( K 2) – (Z 2 – 1)∗K 3+Z∗K 4+ 1
3 K 5
K=−0.12206
K 5=0.8989
X 5=Mean of Q+ K 5 S . D
⊘ This is a preview!⊘
Do you want full access?
Subscribe today to unlock all pages.

Trusted by 1+ million students worldwide

Surface Water Hydrolgy4
X 5=1072.82+0.8989(450.536)
X 5=1477.79 Ml /day
For a 10 year return period
TP=( 1
10 )=0.1
W ={ln( 1
0.12 ) }0.5=2.145966
Substituting the value of W ∈Z ;
Z=W − 2.515517+0.802853 W +0.01032W 2
1+1.432788 W +0.189269 W 2 +0.001308 W3 =1.2817362
K T =Z +(Z 2 – 1) K + 1
3 (Z 3 – 6 Z )∗( K 2) – (Z 2 – 1)∗K 3+Z∗K 4+ 1
3 K 5
K=−0.12206
K 10=1.0202
X 10=Mean of Q+ K 10 S . D
X 10=1072.82+1.0202(450.536)
X 10=1532.48 Ml /day
For a 25 year return period
Therefore ; P=( 1
25 )=0.04
W ={ln( 1
0.042 ) }0.5=2.537
Substituting the value of W ∈Z ;
Z=W − 2.515517+0.802853 W +0.01032W 2
1+1.432788 W +0.189269 W 2 +0.001308 W 3 =1.7510853
K T =Z +(Z 2 – 1) K + 1
3 (Z 3 – 6 Z )∗( K 2) – (Z 2 – 1)∗K 3+Z∗K 4+ 1
3 K 5
Paraphrase This Document
Need a fresh take? Get an instant paraphrase of this document with our AI Paraphraser

Surface Water Hydrolgy5
K=−0.12206
K 25=1.4775
X 25=Meanof Q+ K 25 S . D
X 25=1072.82+1.4775 (450.536)
X 25=1738.49 Ml /day
For a 50 year return period
P=( 1
50 )=0.02
W ={ln( 1
0.022 ) }0.5=2.79715
Substituting the value of W ∈Z ;
Z=W − 2.515517+0.802853 W +0.01032W 2
1+1.432788 W +0.189269 W 2 +0.001308 W3 =2.0541982
K T =Z +(Z 2 – 1) K + 1
3 (Z 3 – 6 Z )∗( K 2) – (Z 2 – 1)∗K 3+Z∗K 4+ 1
3 K 5
K=−0.12206
K 50=1.64934
X 50=Mean of Q+ K 50 S . D
X 50=1072.82+1.64934 (450.536)
X 50=1815.9 Ml /day
For 100 year return period
Therefore ; P=( 1
100 )=0.01
W ={ln( 1
0.012 ) }0.5=3.035
Substituting the value of W ∈Z ;
Z=W − 2.515517+0.802853 W +0.01032W 2
1+1.432788 W +0.189269 W 2 +0.001308 W 3 =2.32679567
K=−0.12206
K 25=1.4775
X 25=Meanof Q+ K 25 S . D
X 25=1072.82+1.4775 (450.536)
X 25=1738.49 Ml /day
For a 50 year return period
P=( 1
50 )=0.02
W ={ln( 1
0.022 ) }0.5=2.79715
Substituting the value of W ∈Z ;
Z=W − 2.515517+0.802853 W +0.01032W 2
1+1.432788 W +0.189269 W 2 +0.001308 W3 =2.0541982
K T =Z +(Z 2 – 1) K + 1
3 (Z 3 – 6 Z )∗( K 2) – (Z 2 – 1)∗K 3+Z∗K 4+ 1
3 K 5
K=−0.12206
K 50=1.64934
X 50=Mean of Q+ K 50 S . D
X 50=1072.82+1.64934 (450.536)
X 50=1815.9 Ml /day
For 100 year return period
Therefore ; P=( 1
100 )=0.01
W ={ln( 1
0.012 ) }0.5=3.035
Substituting the value of W ∈Z ;
Z=W − 2.515517+0.802853 W +0.01032W 2
1+1.432788 W +0.189269 W 2 +0.001308 W 3 =2.32679567

Surface Water Hydrolgy6
K T =Z +(Z 2 – 1) K + 1
3 (Z 3 – 6 Z )∗( K 2) – (Z 2 – 1)∗K 3+Z∗K 4+ 1
3 K 5
K=−0.12206
K 100=1.78978
X 100=Mean of Q+ K 100 S . D
X 100=1072.82+1.78978(450.536)
X 100=1879.18 Ml /day
Q2 (7 MARKS)
SOLUTION
4th column is gotten using; 2 S
Δt + Q (cfs) (Zoppou, 1999).
A ten minute routing interval Δt is used. (600 seconds)
Column 1
Head H (Ft)
Column 2
Discharge (Q)
Column 3
Storage S (Ft3)
Column 4
2 S
Δt + Q (cfs)
0 0 0 .00
0.5 3 43500 148.20
1.0 8 87,120 298.40
1.5 17 130,680 452.60
2.0 30 174.240 610.80
2.5 43 217,800 769.00
3.0 60 261.360 931.20
3.5 78 304,920 1094.40
4.0 97 348,480 1258.60
4.5 117 392,040 1423.80
5.0 137 435,600 1589.00
Table 2.1Elevation – Discharge-Storage data
Find attached an MS Excel spreadsheet which re-creates the
results.
⊘ This is a preview!⊘
Do you want full access?
Subscribe today to unlock all pages.

Trusted by 1+ million students worldwide

Surface Water Hydrolgy7
Paraphrase This Document
Need a fresh take? Get an instant paraphrase of this document with our AI Paraphraser

Surface Water Hydrolgy8
Graph which compares in the inflow and outflow hydrographs
0
0.805
3.21
10.2
21.24
28.34
30.285
28.62
24.445
18.51
14.055
10.965
8.55
0
10
20
30
40
50
60
70
inflows against outflows
inflows
Outflow (cfs)
Inflows I (cfs)
Figure 2.1 Graph which compares in the inflow and outflow
hydrographs
In hydrological data magnitude of peak and attenuation is a very
important element in data interpretation
Magnitude of peak attenuation –
Peak Inflow−60 cfs
Peak outflow – 21.21 cfs
The Peak lag timeis between 180−240 minutes

Surface Water Hydrolgy9
Q 3 (1 MARK)
List all of the bulk entitlement records for Central Highlands Water.
a) Skipton
b) Upper West Moorabool
System
c) Beaufort
d) Blackwood and Barry’s Reef
e) Bullarook System – Central
Highlands Water
f) Lexton
g) Yarrowee – White Swan
System
h) Amphitheatre
i) Avoca
j) Ballan
k) Lal – Central Highlands
l) Lands borough –Navarre
m) Red bank
n) Loddon System – Part
Maryborough – Central
Highlands Water
Q4
SOLUTION
Available water =(143,500 – 7,500+52,000 – 15,500 – 24,000+17,000 – 27,500)ML
Available water =138,500 ML
⊘ This is a preview!⊘
Do you want full access?
Subscribe today to unlock all pages.

Trusted by 1+ million students worldwide

Surface Water Hydrolgy10
PROBLEM 5 (3 MARKS)
SOLUTION
Entitlement Water Share
A (ML)
Water Share
B (ML)
Water
Share C
(ML)
Water Share
D (ML)
Water Share
E (ML)
Water Share
F (ML)
Total (202200 -
174000) =
28200
(174000 –
86400)
=87600
(86400-
56400)=
30000
(56400 -
45900)=105
00
(45900 -0)=
45900
0
System
Operator
(150000 –
75000) =
75000
(75000 –
56800)=
18200
(56800 –
40200) =
16600
(40200 –
32000 )=
8200
(32000 -
20000) =
12000
20000
Water
Corporation A
(82000 -
82000) = 0
(82000 -
40700)=
41300
(40700 -
28700)=
12000
(28700 -
24500) =
4200
(24500 -0)=
24500
0
Water
Corporation B
(6500 –
2500)=
4000
(2500 –
1500) =
1000
(1500 –
1500) = 0
(1500 -
1400) = 100
(1400 – 0) =
1400
0
Water
Corporation C
(8700 -
4500 ) =
4200
(4500 -
1700 )=
2800
(1700 -
1200 ) =
500
(1200 –
1000) =
200
(1000 – 0) =
1000
0
Environment
A
(40000 -
40000) = 0
(40000 -
35000 ) =
5000
(35000 -
25000) =
10,000
(25000 -
19000) =
6000
(19000 – 0)
= 19000
0
Environment
B
(65000 -
45000) =
20000
(45000–
7500) =
37500
7500 0 0 0
Table 5.1; Finding the share commanded by each entitlement holder in ML
Paraphrase This Document
Need a fresh take? Get an instant paraphrase of this document with our AI Paraphraser

Surface Water Hydrolgy11
Entitlement Water
Share A
Water
Share B
Water
Share C
Water
Share D
Water
Share E
Water
Share F
Total 14.0% 43.3% 14.7% 5.3% 22.7% 0%
System Operator 150000 75000 56800 40200 32000 20000
Water Corporation A 0.0% 20.4% 5.9% 2.1% 12.1% 0%
Water Corporation B 2.0% 0.5% 0.0% 0.1%s 0.7% 0%
Water Corporation C 2.1% 1.4% 0.2% 0.1% 0.5% 0%
Environment A 0.0% 2.5% 4.9% 3.0% 9.4% 0%
Environment B 9.9% 18.5% 3.7% 0% 0% 0%
Table 5.2; Share per holder of the entitlement
Water distribution as per the values
Entitlement Water
Share A
(ML)
Water
Share B
(ML)
Water
Share C
(ML)
Water
Share D
(ML)
Water
Share E
(ML)
Water
Share
F(ML)
Total 138,500 119,100 59,139.5 38,780 31,439.5 0 %
System
Operator
150000 75000 56800 40200 32000 20000
Water
Corporation
A
0 28,254 8,171.5 2908.5 16,758.5 0
Water
Corporation
B
2770 692.5 0 138.5 969.5 0
Water
Corporation
C
2908.5 1939 277 138.5 692.5 0
Environment
A
0 3462.5 23,960.5 4155 13,019 0
Environment
B
13,711.5 25,622.5 5,124.5 0 0 0
The greatest reliable entitlement is from share B . The share is supplied
from a all available establishments it has a higher percentage of water
share command
Entitlement Water
Share A
Water
Share B
Water
Share C
Water
Share D
Water
Share E
Water
Share F
Total 14.0% 43.3% 14.7% 5.3% 22.7% 0%
System Operator 150000 75000 56800 40200 32000 20000
Water Corporation A 0.0% 20.4% 5.9% 2.1% 12.1% 0%
Water Corporation B 2.0% 0.5% 0.0% 0.1%s 0.7% 0%
Water Corporation C 2.1% 1.4% 0.2% 0.1% 0.5% 0%
Environment A 0.0% 2.5% 4.9% 3.0% 9.4% 0%
Environment B 9.9% 18.5% 3.7% 0% 0% 0%
Table 5.2; Share per holder of the entitlement
Water distribution as per the values
Entitlement Water
Share A
(ML)
Water
Share B
(ML)
Water
Share C
(ML)
Water
Share D
(ML)
Water
Share E
(ML)
Water
Share
F(ML)
Total 138,500 119,100 59,139.5 38,780 31,439.5 0 %
System
Operator
150000 75000 56800 40200 32000 20000
Water
Corporation
A
0 28,254 8,171.5 2908.5 16,758.5 0
Water
Corporation
B
2770 692.5 0 138.5 969.5 0
Water
Corporation
C
2908.5 1939 277 138.5 692.5 0
Environment
A
0 3462.5 23,960.5 4155 13,019 0
Environment
B
13,711.5 25,622.5 5,124.5 0 0 0
The greatest reliable entitlement is from share B . The share is supplied
from a all available establishments it has a higher percentage of water
share command

Surface Water Hydrolgy12
References
Hoshi, K., & Burges, S. J. (1981). Sampling properties of parameter estimates for the log
Pearson type 3 distribution, using moments in real space. Journal of Hydrology, 53(3-4),
305-316.
Phien, H. N., & Ajirajah, T. J. (1984). Applications of the log Pearson type-3 distribution
. in hydrology. Journal of hydrology, 73(3-4), 359-372
Griffis, V. W., & Stedinger, J. R. (2007). Log-Pearson Type 3 distribution and its
application in flood frequency analysis. I: Distribution characteristics. Journal of
Hydrologic Engineering, 12(5), 482-491.
Mitchell, W.D., 1954, Floods in Illinois: Magnitude and Frequency: Prepared in
cooperation with the U.S. Geological Survey and Division of Waterways, Department of
Public Works and Buildings, 386 p.
Cunnane, C. (1988). Methods and merits of regional flood frequency analysis. Journal of
Hydrology, 100(1-3), 269-290
McMahon, T. A., & Srikanthan, R. (1981). Log Pearson III distribution—is it applicable to
flood frequency analysis of Australian streams? Journal of Hydrology, 52(1-2), 139-147
Milanovic, P. (2004). Water resources engineering in karst. CRC press.
Mays, L. W. (2010). Water resources engineering. John Wiley & Sons.
http://waterregister.vic.gov.au/weather-entitlements/bulk-entitlements retrieved on 13th,
May, 2018. At 1943 hours
Singh, V.P (1998). Log-Pearson type III distribution. In Hydrology (pp. 252-274).
Springer, Dordrecht.
⊘ This is a preview!⊘
Do you want full access?
Subscribe today to unlock all pages.

Trusted by 1+ million students worldwide
1 out of 12
Your All-in-One AI-Powered Toolkit for Academic Success.
+13062052269
info@desklib.com
Available 24*7 on WhatsApp / Email
Unlock your academic potential
Copyright © 2020–2025 A2Z Services. All Rights Reserved. Developed and managed by ZUCOL.
