Statistics Assignment - Hypothesis, Regression, and ANOVA

Verified

Added on  2021/06/17

|7
|650
|53
Homework Assignment
AI Summary
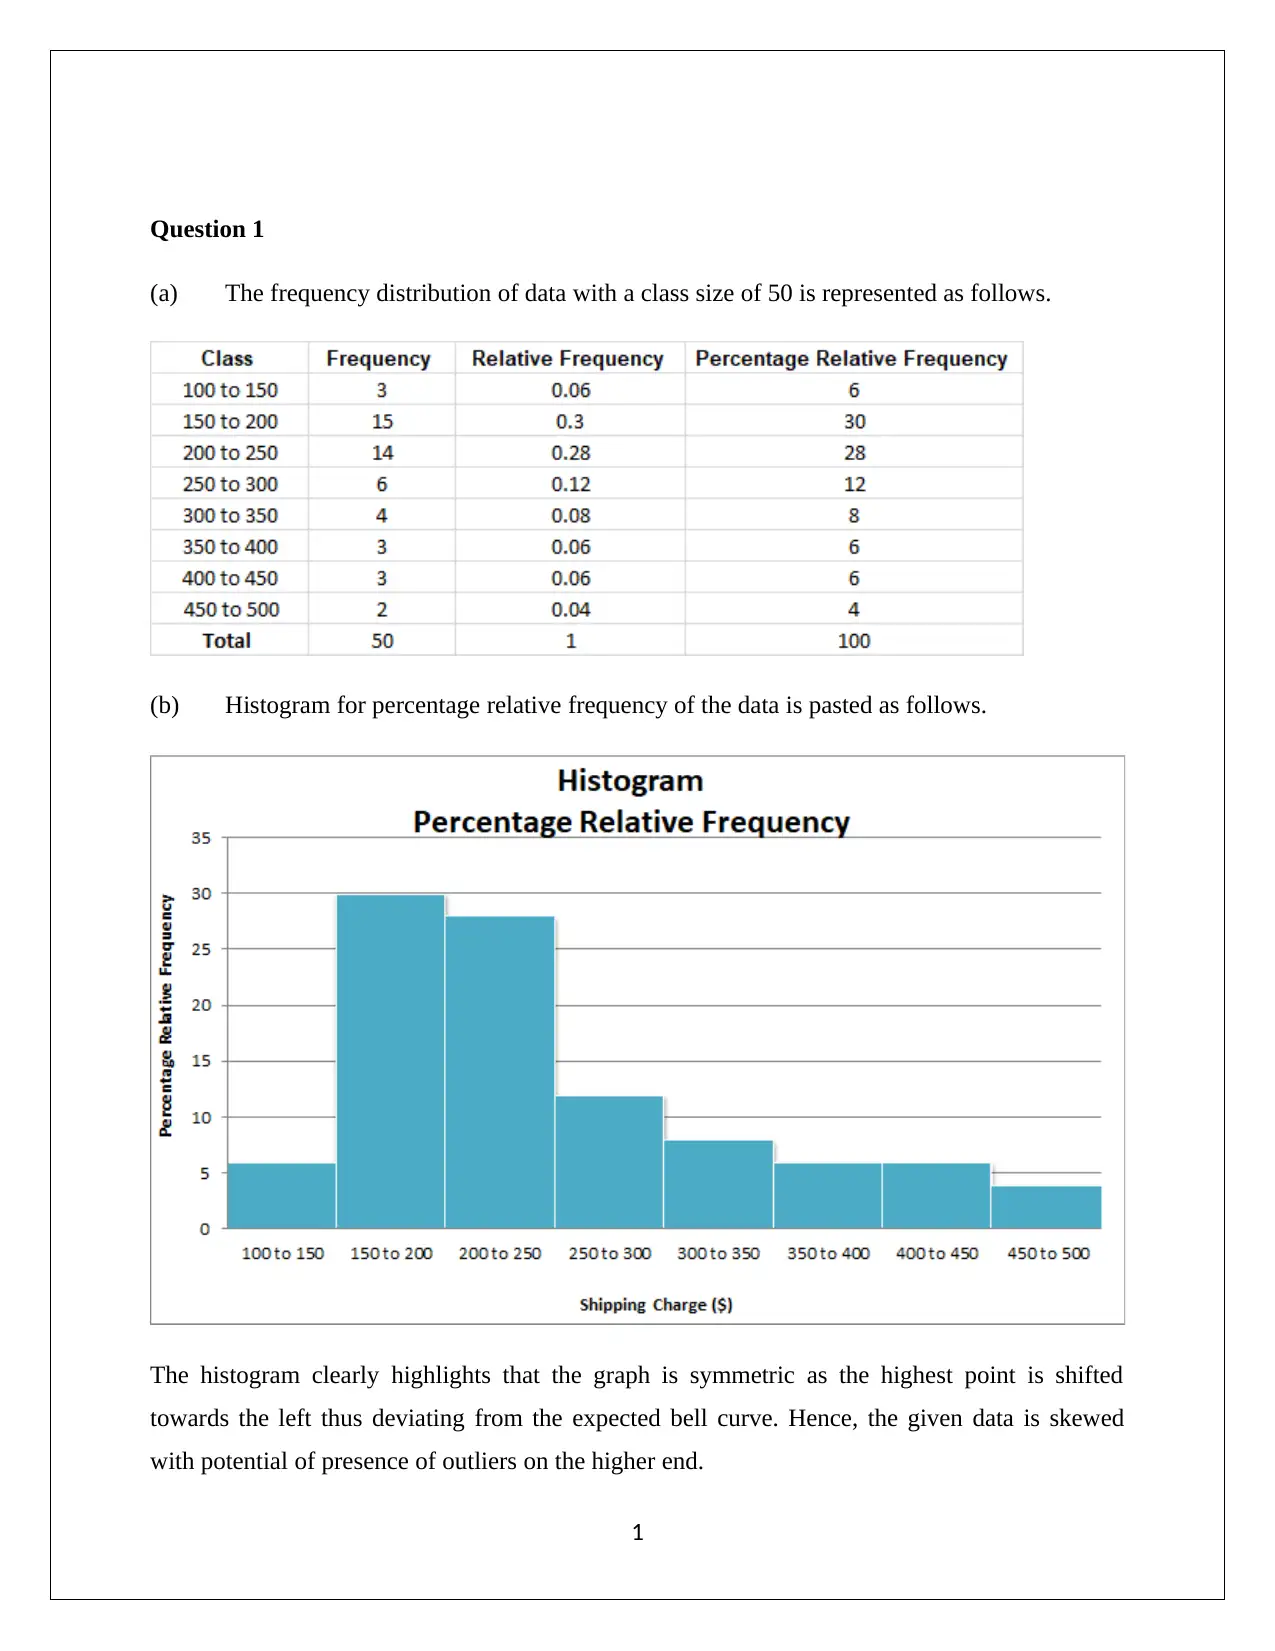
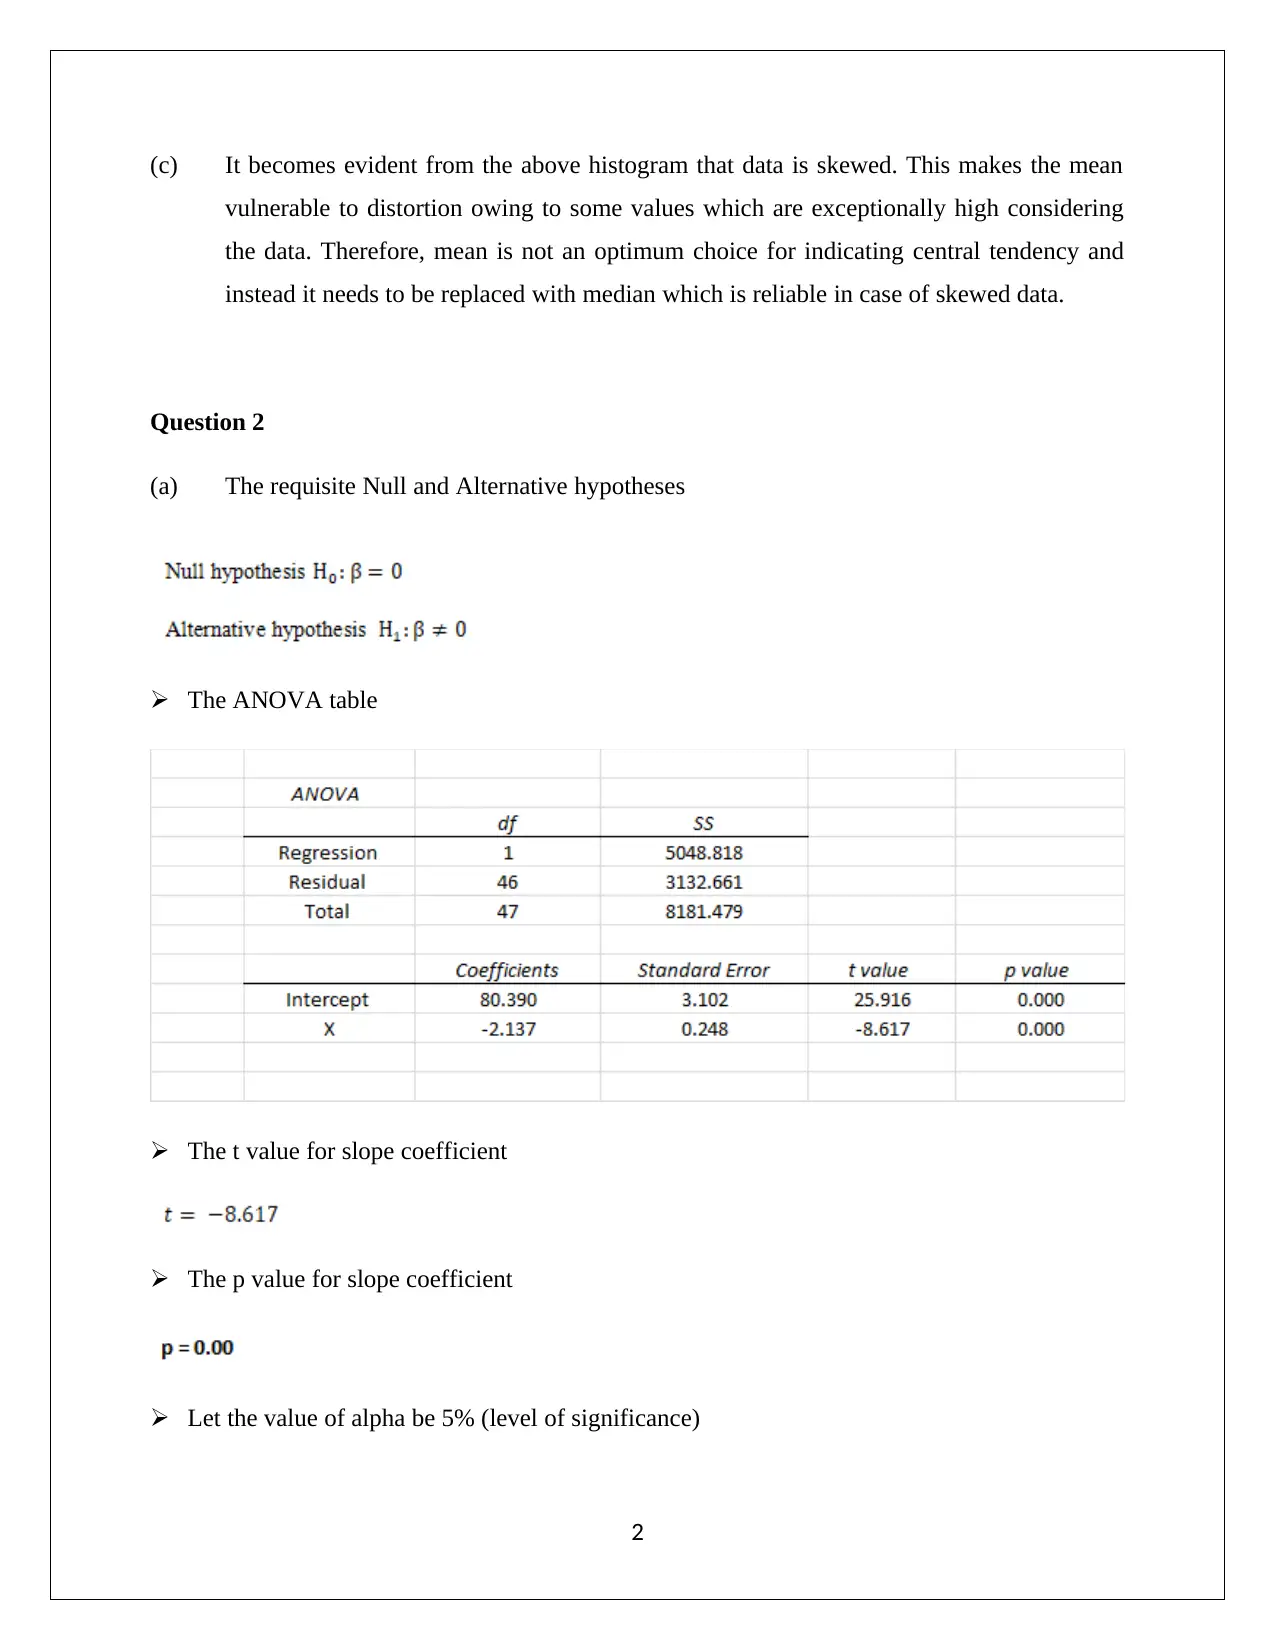
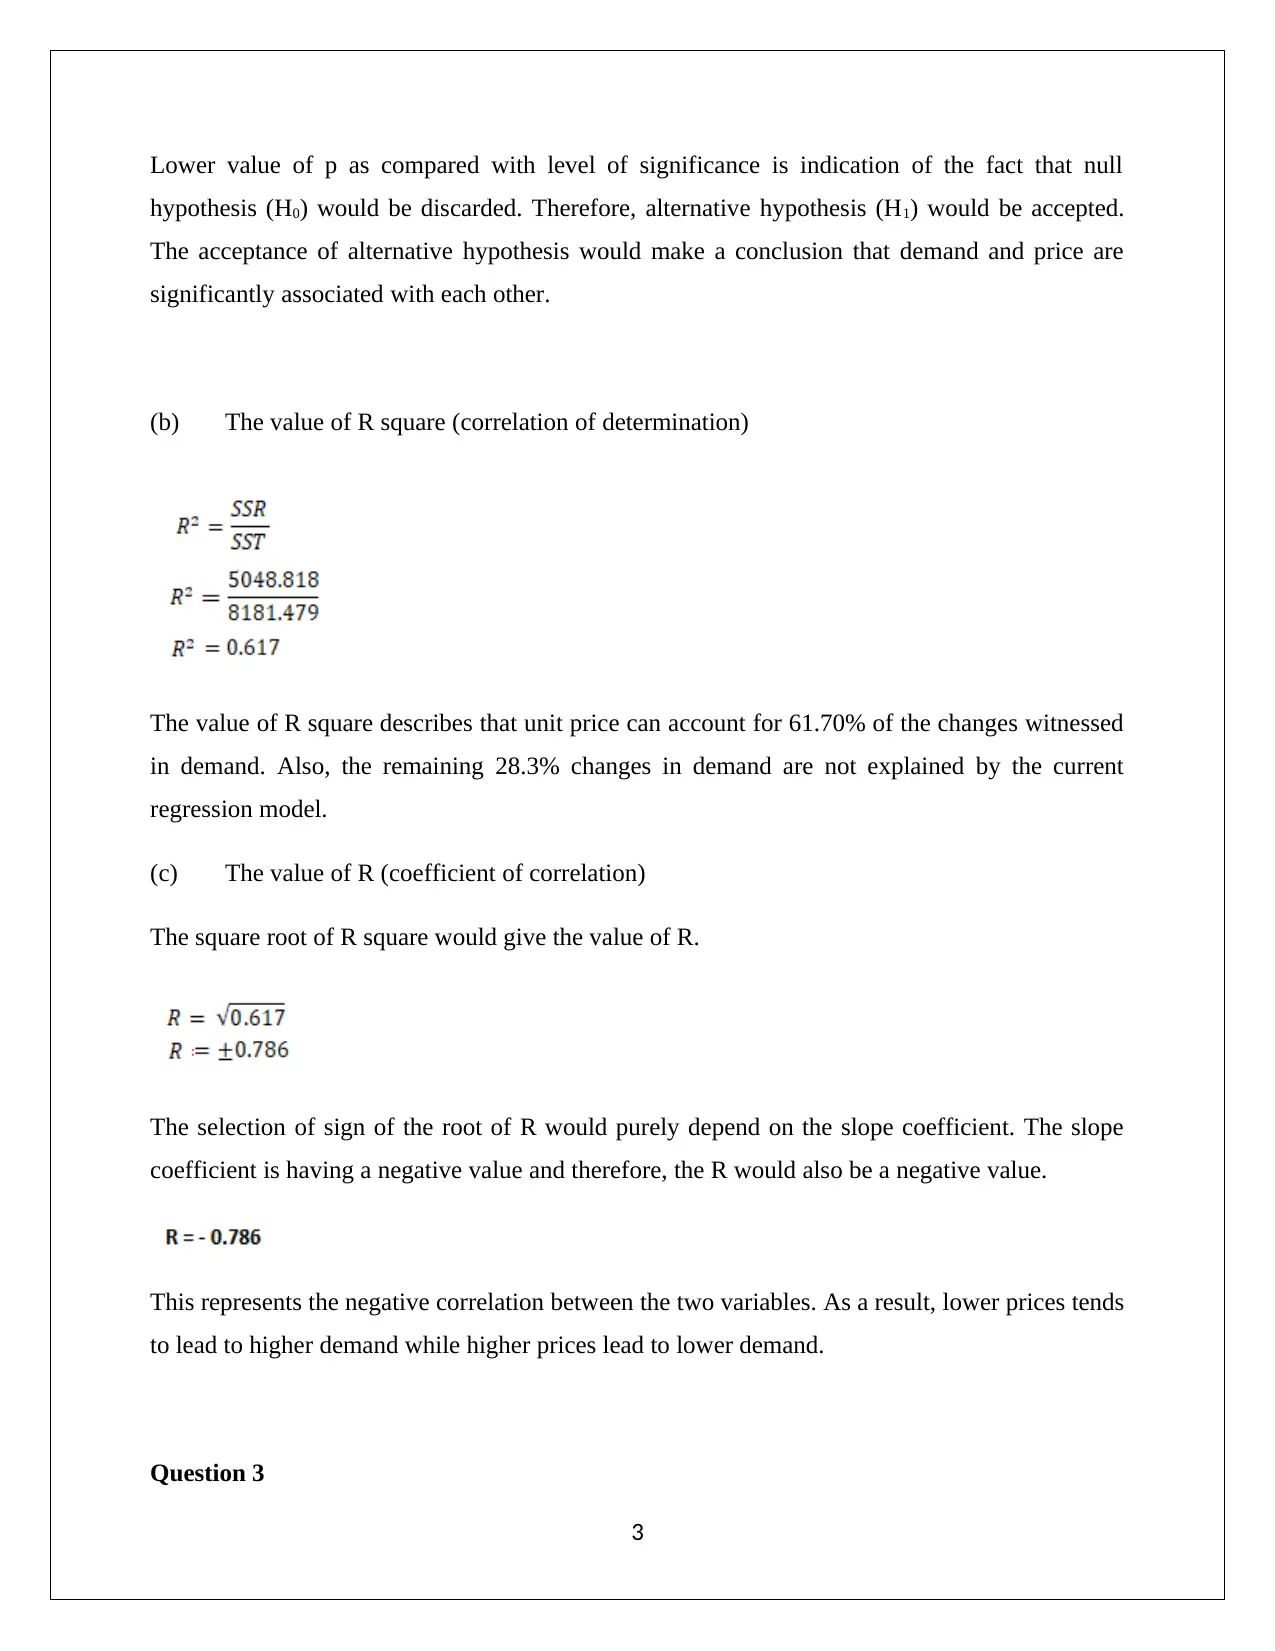
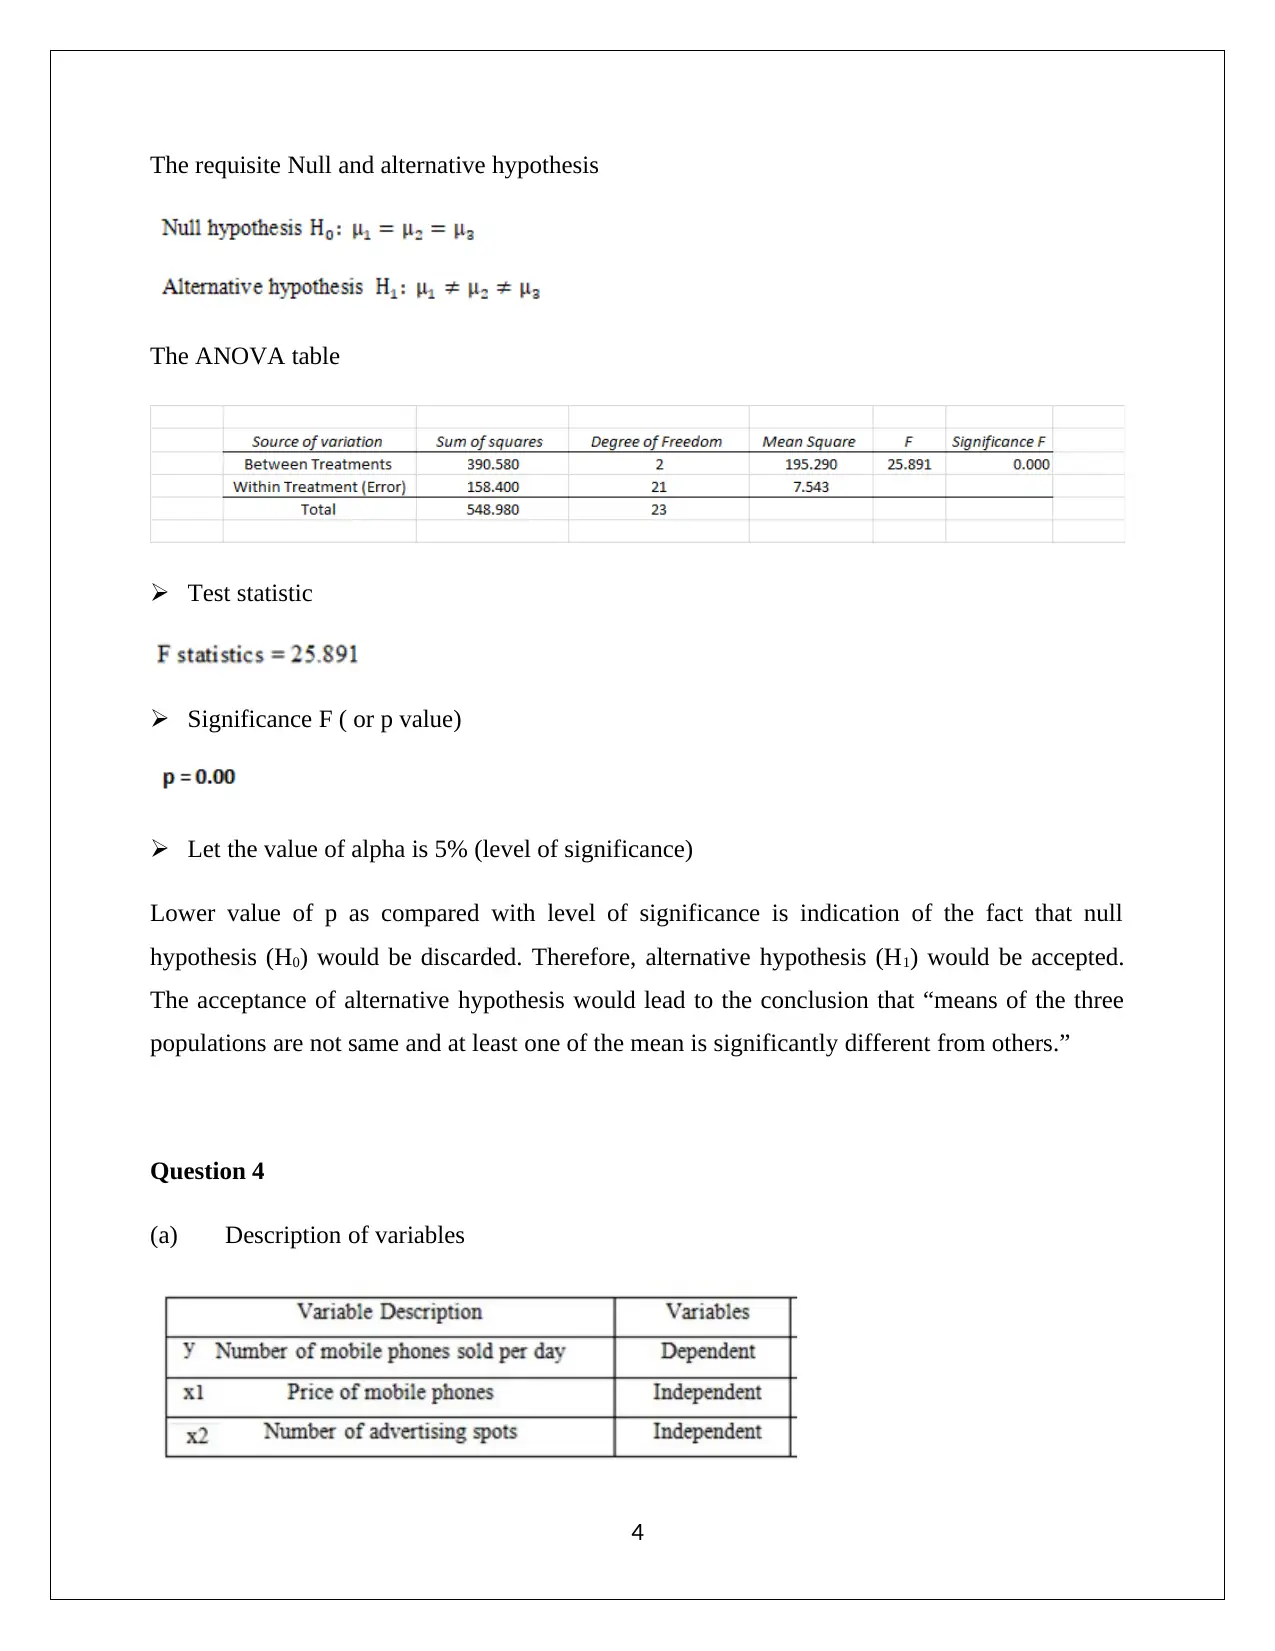
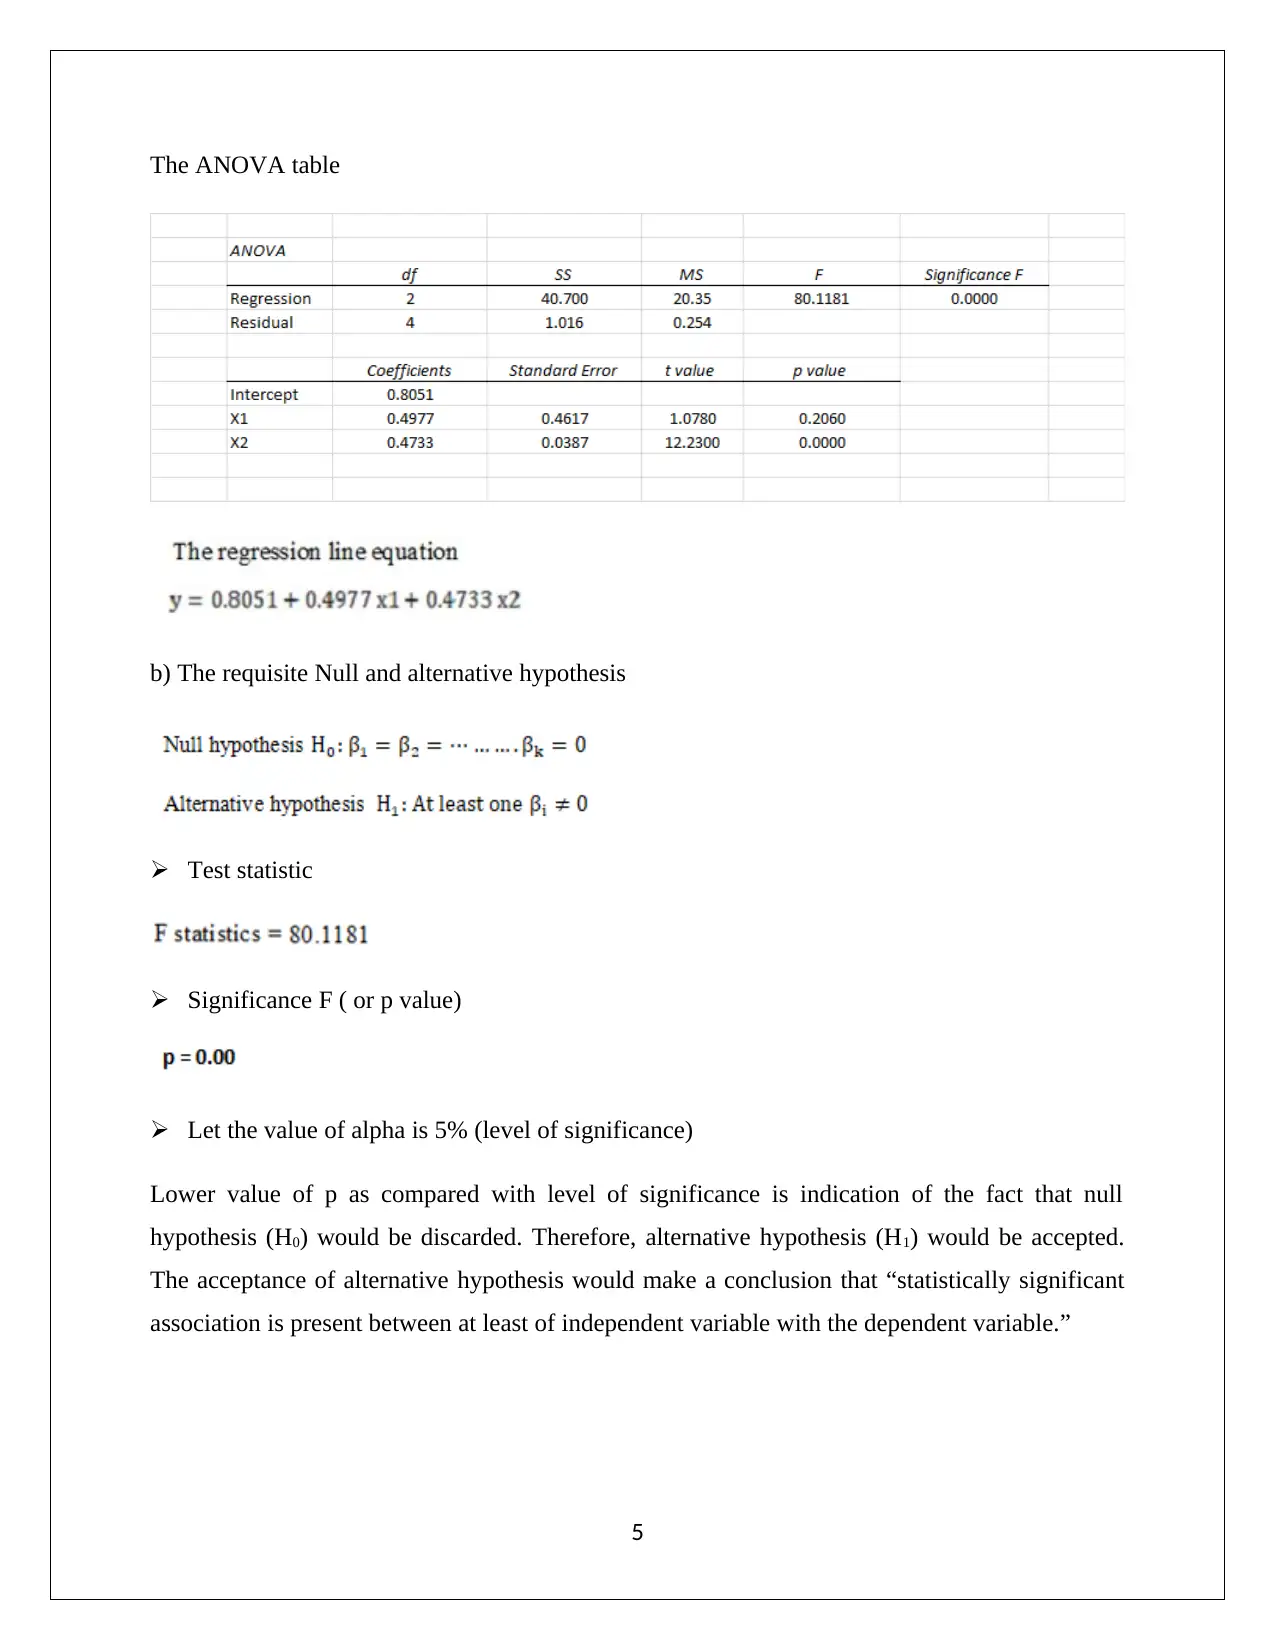
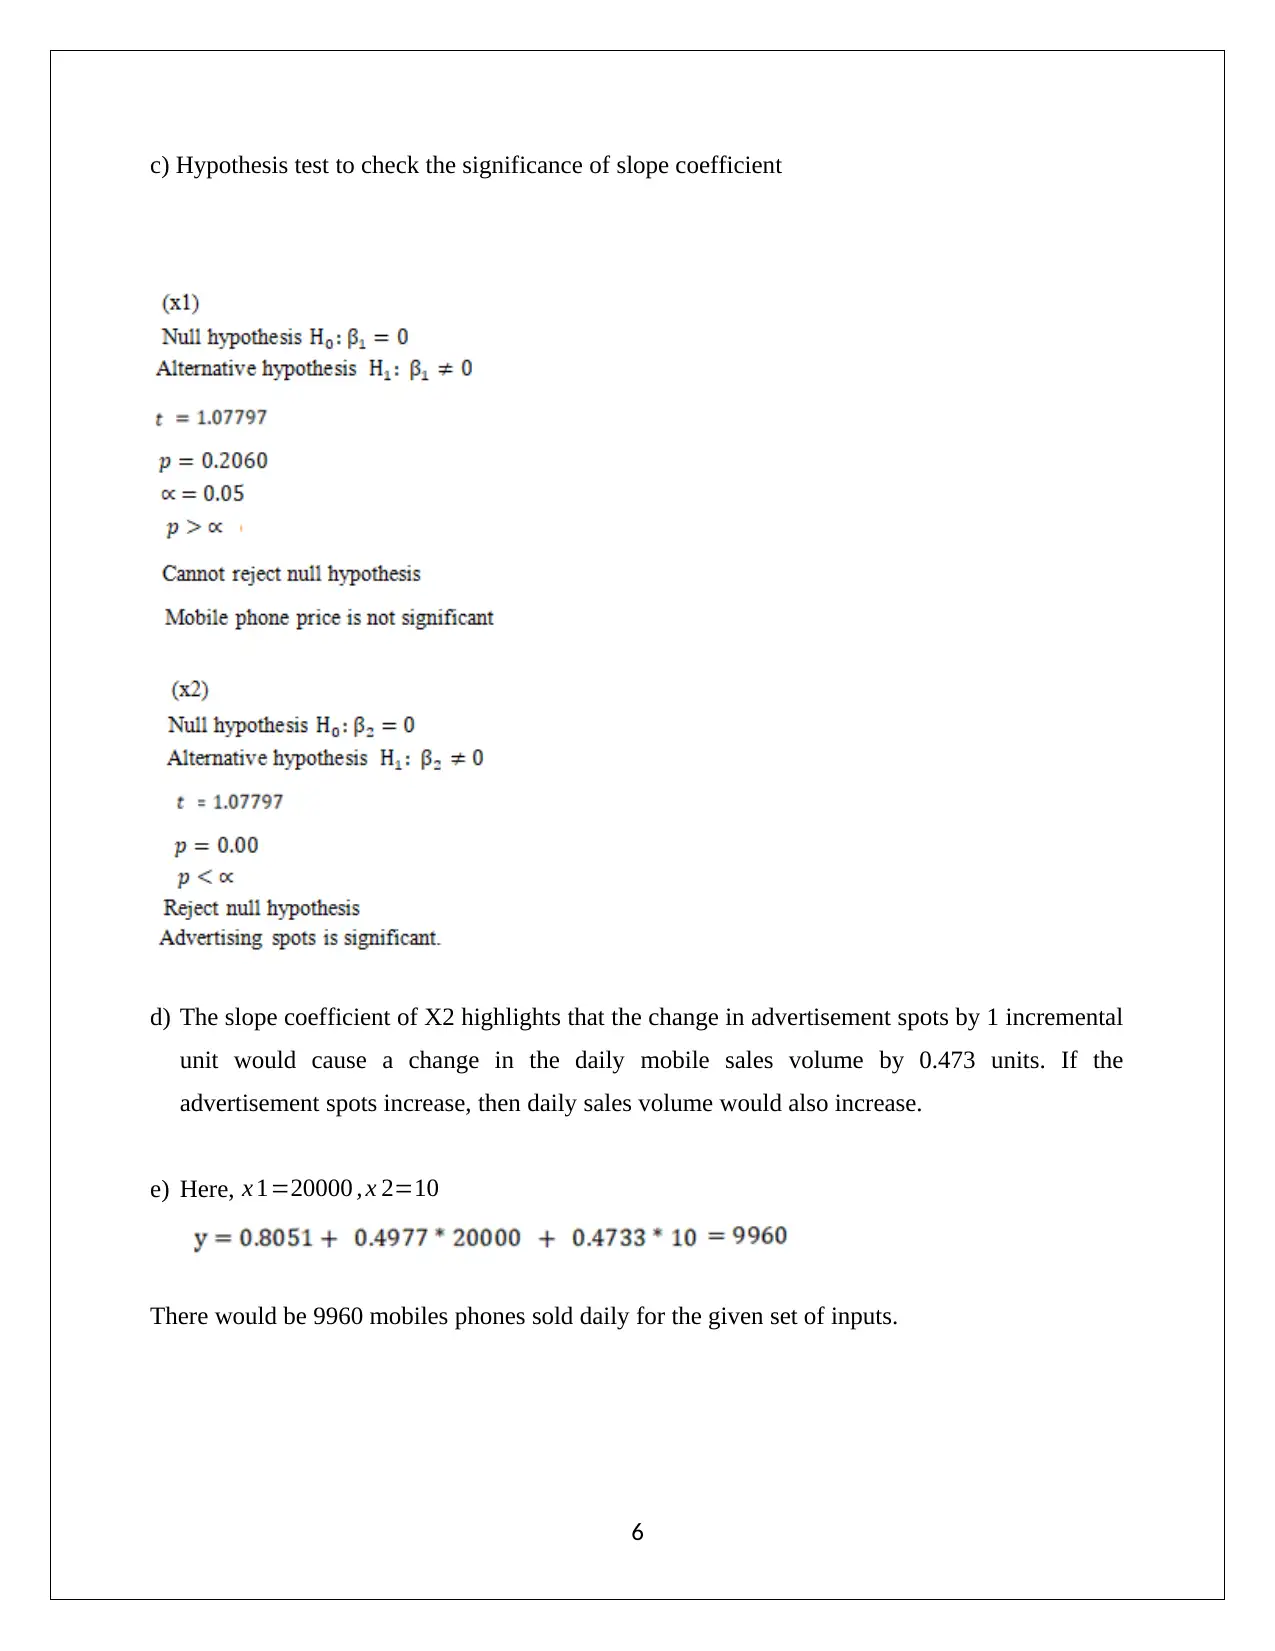
This statistics assignment addresses several key statistical concepts, including hypothesis testing, regression analysis, and ANOVA. The assignment begins with an analysis of data frequency distribution, identifying skewness and its implications on the choice of central tendency measures, specifically comparing the mean and median. The solution then proceeds to address hypothesis testing, presenting the null and alternative hypotheses, ANOVA tables, and the interpretation of p-values to determine statistical significance. Regression analysis is used to examine the relationship between demand and price, including the calculation and interpretation of the R-squared and correlation coefficients. Finally, the assignment covers the application of ANOVA to compare the means of different populations and analyze the impact of independent variables on a dependent variable, such as the effect of advertisement spots on daily mobile sales, providing detailed explanations and conclusions for each section.
Document Page
STATISTICS
Assignment
Student Name
[Pick the date]
tabler-icon-diamond-filled.svg

Paraphrase This Document

Need a fresh take? Get an instant paraphrase of this document with our AI Paraphraser
Document Page
Question 1
(a) The frequency distribution of data with a class size of 50 is represented as follows.
(b) Histogram for percentage relative frequency of the data is pasted as follows.
The histogram clearly highlights that the graph is symmetric as the highest point is shifted
towards the left thus deviating from the expected bell curve. Hence, the given data is skewed
with potential of presence of outliers on the higher end.
1
Document Page
(c) It becomes evident from the above histogram that data is skewed. This makes the mean
vulnerable to distortion owing to some values which are exceptionally high considering
the data. Therefore, mean is not an optimum choice for indicating central tendency and
instead it needs to be replaced with median which is reliable in case of skewed data.
Question 2
(a) The requisite Null and Alternative hypotheses
The ANOVA table
The t value for slope coefficient
The p value for slope coefficient
Let the value of alpha be 5% (level of significance)
2
Document Page
Lower value of p as compared with level of significance is indication of the fact that null
hypothesis (H0) would be discarded. Therefore, alternative hypothesis (H1) would be accepted.
The acceptance of alternative hypothesis would make a conclusion that demand and price are
significantly associated with each other.
(b) The value of R square (correlation of determination)
The value of R square describes that unit price can account for 61.70% of the changes witnessed
in demand. Also, the remaining 28.3% changes in demand are not explained by the current
regression model.
(c) The value of R (coefficient of correlation)
The square root of R square would give the value of R.
The selection of sign of the root of R would purely depend on the slope coefficient. The slope
coefficient is having a negative value and therefore, the R would also be a negative value.
This represents the negative correlation between the two variables. As a result, lower prices tends
to lead to higher demand while higher prices lead to lower demand.
Question 3
3
tabler-icon-diamond-filled.svg

Paraphrase This Document

Need a fresh take? Get an instant paraphrase of this document with our AI Paraphraser
Document Page
The requisite Null and alternative hypothesis
The ANOVA table
Test statistic
Significance F ( or p value)
Let the value of alpha is 5% (level of significance)
Lower value of p as compared with level of significance is indication of the fact that null
hypothesis (H0) would be discarded. Therefore, alternative hypothesis (H1) would be accepted.
The acceptance of alternative hypothesis would lead to the conclusion that “means of the three
populations are not same and at least one of the mean is significantly different from others.”
Question 4
(a) Description of variables
4
Document Page
The ANOVA table
b) The requisite Null and alternative hypothesis
Test statistic
Significance F ( or p value)
Let the value of alpha is 5% (level of significance)
Lower value of p as compared with level of significance is indication of the fact that null
hypothesis (H0) would be discarded. Therefore, alternative hypothesis (H1) would be accepted.
The acceptance of alternative hypothesis would make a conclusion that “statistically significant
association is present between at least of independent variable with the dependent variable.”
5
Document Page
c) Hypothesis test to check the significance of slope coefficient
d) The slope coefficient of X2 highlights that the change in advertisement spots by 1 incremental
unit would cause a change in the daily mobile sales volume by 0.473 units. If the
advertisement spots increase, then daily sales volume would also increase.
e) Here, x 1=20000 , x 2=10
There would be 9960 mobiles phones sold daily for the given set of inputs.
6
chevron_up_icon
1 out of 7
circle_padding
hide_on_mobile
zoom_out_icon
[object Object]